Estimated redshift from machine learning (Ukwatta et al. 2016) - may take a few minutes to calcaulte
Image
Pre-slew 15-350 keV image (Event data; bkg subtracted)

#   RAcent  DECcent POSerr  Theta    Phi     Peak Cts     SNR  Name
  233.8963 -57.2098 0.0328   16.8   46.7       1.6119     5.9  TRIG_00770431
------------------------------------------

Foreground time interval of the image:
  0.000 243.030 (delta_t = 243.030 [sec])
Background time interval of the image:
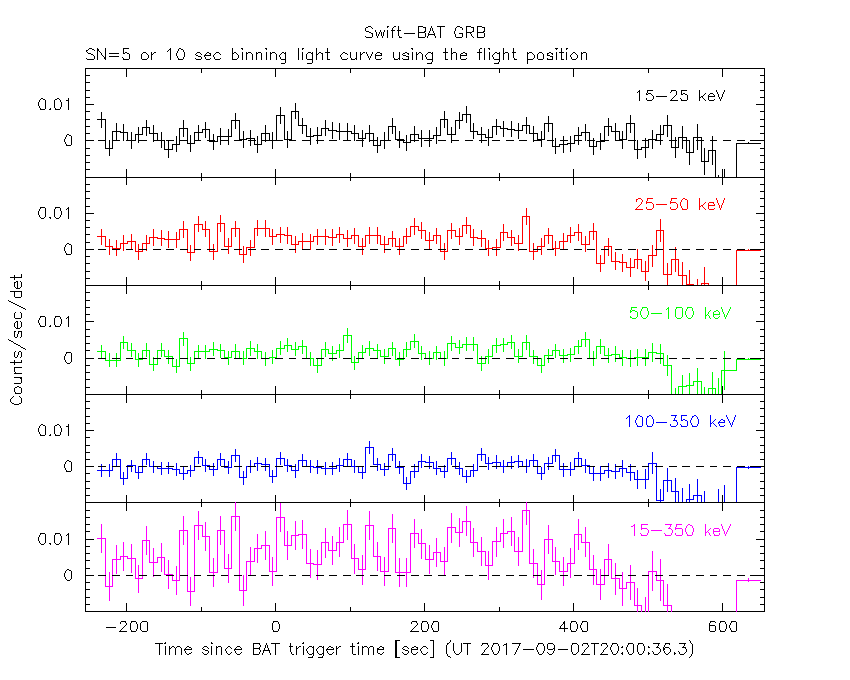
Lightcurves
Notes:
- 1) All plots contain as much data as has been downloaded to date.
- 2) The mask-weighted light curves are using the flight position.
- 3) Multiple plots of different time binning/intervals are shown to cover all scenarios of short/long GRBs, rate/image triggers, and real/false positives.
- 4) For all the mask-weighted lightcurves, the y-axis units are counts/sec/det where a det is 0.4 x 0.4 = 0.16 sq cm.
- 5) The verticle lines correspond to following: green dotted lines are T50 interval, black dotted lines are T90 interval, blue solid line(s) is a spacecraft slew start time, and orange solid line(s) is a spacecraft slew end time.
- 6) Time of each bin is in the middle of the bin.
1 s binning
From T0-310 s to T0+310 s

From T100_start - 20 s to T100_end + 30 s
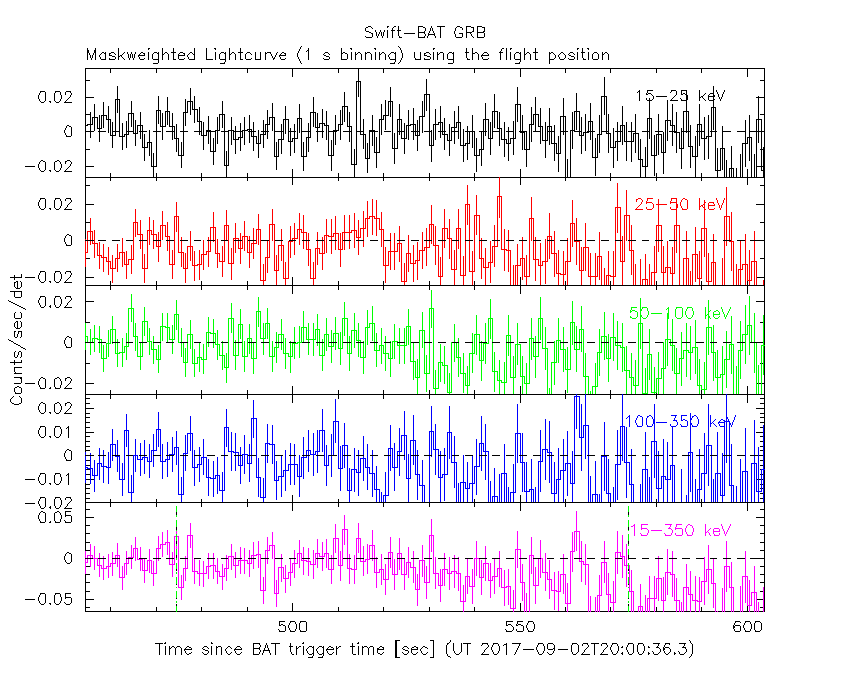
Full time interval

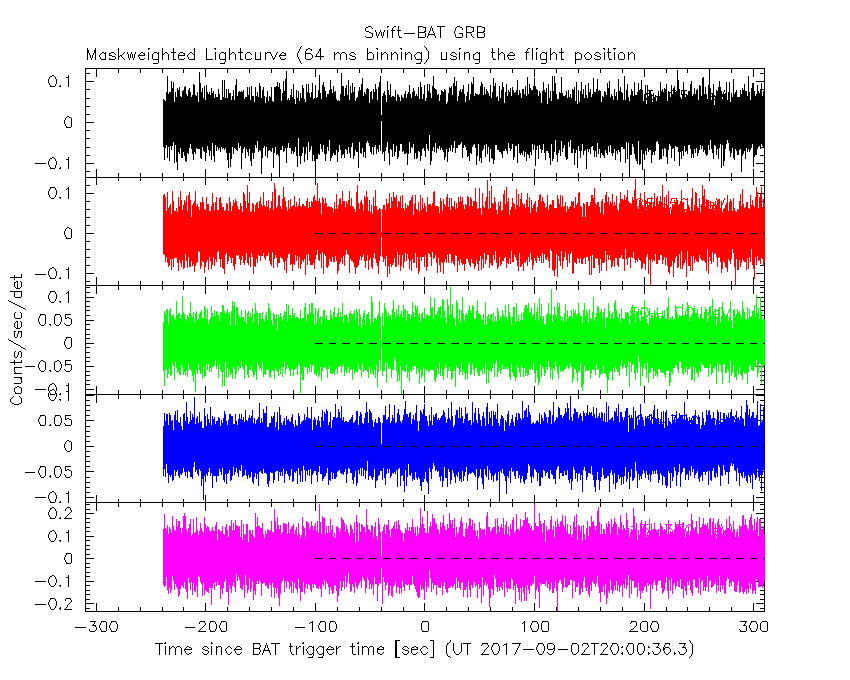
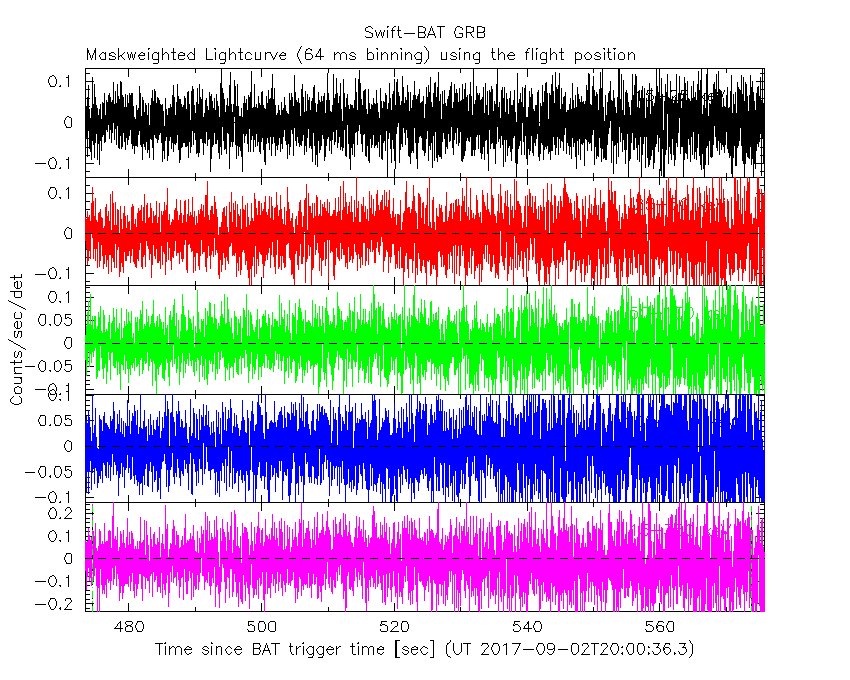
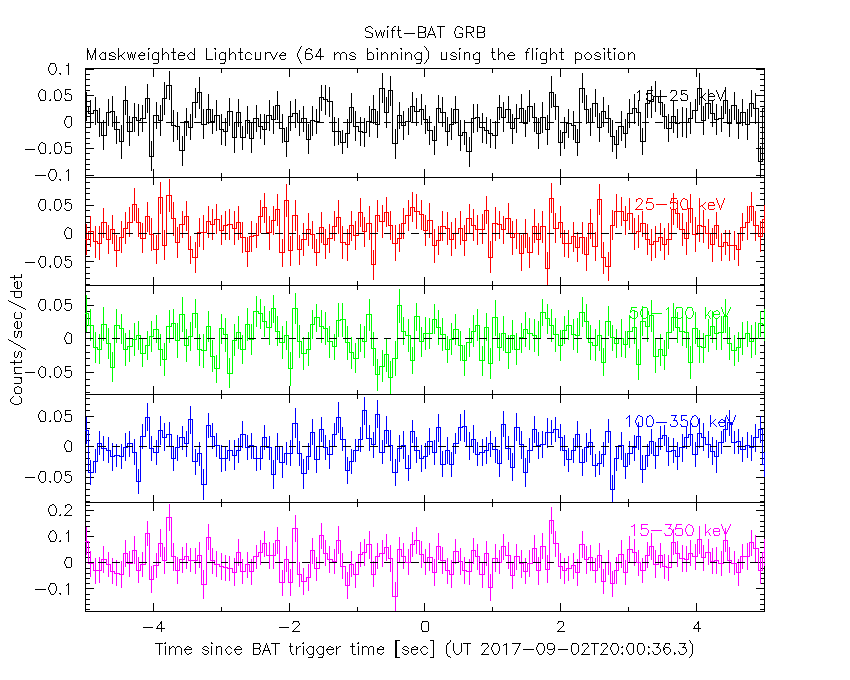
64 ms binning
Full time interval
From T100_start to T100_end
From T0-5 sec to T0+5 sec
16 ms binning
From T100_start-5 s to T100_start+5 s

8 ms binning
From T100_start-3 s to T100_start+3 s

2 ms binning
From T100_start-1 s to T100_start+1 s

SN=5 or 10 sec. binning (whichever binning is satisfied first)
SN=5 or 10 sec. binning (T < 200 sec)

Spectra
Notes:
- 1) The fitting includes the systematic errors.
- 2) For long bursts, a spectral fit of the pre-slew DRM will introduce some errors in both a spectral shape and a normalization if the PHA file contains a lot of the slew/post-slew time interval.
- 3) For fits to more complicated models (e.g. a power-law over a cutoff power-law), the BAT team has decided to require a chi-square improvement of more than 6 for each extra dof.
- 4) For short bursts (T90<1sec), the specrtum is also fit with Blackbody, OTTB, and Double Blackbody.
Time averaged spectrum fit using the pre-slew DRM
Power-law model

Time interval is from  474.444 sec. to  573.776 sec.
Usage: bat_spec_fit_sys_xspec12.sh (pha file) (response file) (script folder) (folder of taka's xspec lmodel)
       This script tries to add the systematic column to the PHA
       file before doing the fitting
script folder: /local/data/BATtools/battools/bin/GRB_spec_fit_v2
folder of taka's xspec lmodel: /local/data/bat1/prebascript/xspec_taka_lmodel
Cutoff power-law model

Time interval is from  474.444 sec. to  573.776 sec.
Usage: bat_spec_fit_cutoff_sys_xspec12.sh (pha file) (response file) (script folder) (folder of taka's xspec lmodel)
       This script tries to add the systematic column to the PHA
       file before doing the fitting
script folder: /local/data/bat2/BATtools/battools/bin/GRB_spec_fit_v2
folder of taka's xspec lmodel: /local/data/bat1/prebascript/xspec_taka_lmodel
Band function

Time interval is from  474.444 sec. to  573.776 sec.
Usage: bat_spec_fit_band_sys.sh (pha file) (response file) (script folder) (folder of taka's xspec lmodel)
       This script tries to add the systematic column to the PHA
       file before doing the fitting
script folder: /local/data/bat2/BATtools/battools/bin/GRB_spec_fit_v2
folder of taka's xspec lmodel: /local/data/bat1/prebascript/xspec_taka_lmodel
Single BB

Usage: bat_spec_fit_bb_sys.sh (pha file) (response file)
       This script tries to add the systematic column to the PHA
       file before doing the fitting
Thermal bremsstrahlung (OTTB)

Usage: bat_spec_fit_brems_sys.sh (pha file) (response file)
       This script tries to add the systematic column to the PHA
       file before doing the fitting
Double BB

Usage: bat_spec_fit_2bb_sys.sh (pha file) (response file)
       This script tries to add the systematic column to the PHA
       file before doing the fitting
Peak spectrum fit
Power-law model

Time interval is from  562.260 sec. to  563.260 sec.
Usage: bat_spec_fit_sys_xspec12.sh (pha file) (response file) (script folder) (folder of taka's xspec lmodel)
       This script tries to add the systematic column to the PHA
       file before doing the fitting
script folder: /local/data/BATtools/battools/bin/GRB_spec_fit_v2
folder of taka's xspec lmodel: /local/data/bat1/prebascript/xspec_taka_lmodel
Cutoff power-law model

Time interval is from  562.260 sec. to  563.260 sec.
Usage: bat_spec_fit_cutoff_sys_xspec12.sh (pha file) (response file) (script folder) (folder of taka's xspec lmodel)
       This script tries to add the systematic column to the PHA
       file before doing the fitting
script folder: /local/data/bat2/BATtools/battools/bin/GRB_spec_fit_v2
folder of taka's xspec lmodel: /local/data/bat1/prebascript/xspec_taka_lmodel
Band function

Time interval is from  562.260 sec. to  563.260 sec.
Usage: bat_spec_fit_band_sys.sh (pha file) (response file) (script folder) (folder of taka's xspec lmodel)
       This script tries to add the systematic column to the PHA
       file before doing the fitting
script folder: /local/data/bat2/BATtools/battools/bin/GRB_spec_fit_v2
folder of taka's xspec lmodel: /local/data/bat1/prebascript/xspec_taka_lmodel
Single BB

Usage: bat_spec_fit_bb_sys.sh (pha file) (response file)
       This script tries to add the systematic column to the PHA
       file before doing the fitting
Thermal bremsstrahlung (OTTB)

Usage: bat_spec_fit_brems_sys.sh (pha file) (response file)
       This script tries to add the systematic column to the PHA
       file before doing the fitting
Double BB

Usage: bat_spec_fit_2bb_sys.sh (pha file) (response file)
       This script tries to add the systematic column to the PHA
       file before doing the fitting
Pre-slew spectrum (Pre-slew PHA with pre-slew DRM)
Power-law model

Cutoff power-law model

Band function

S(25-50 keV) vs. S(50-100 keV) plot

S(25-50 keV)  = 2.87e-07
S(50-100 keV) = 3.47e-07
T90 vs. Hardness ratio plot

T90                                   = 99.3319999575615 sec.
Hardness ratio (energy fluence ratio) = 1.20906
Color vs. Color plot

Count Ratio  (25-50 keV) / (15-25 keV) = -19.2157
Count Ratio (50-100 keV) / (15-25 keV) = -15.0389
Mask shadow pattern

IMX = 2.073802865614133E-01, IMY = -2.200979077465725E-01
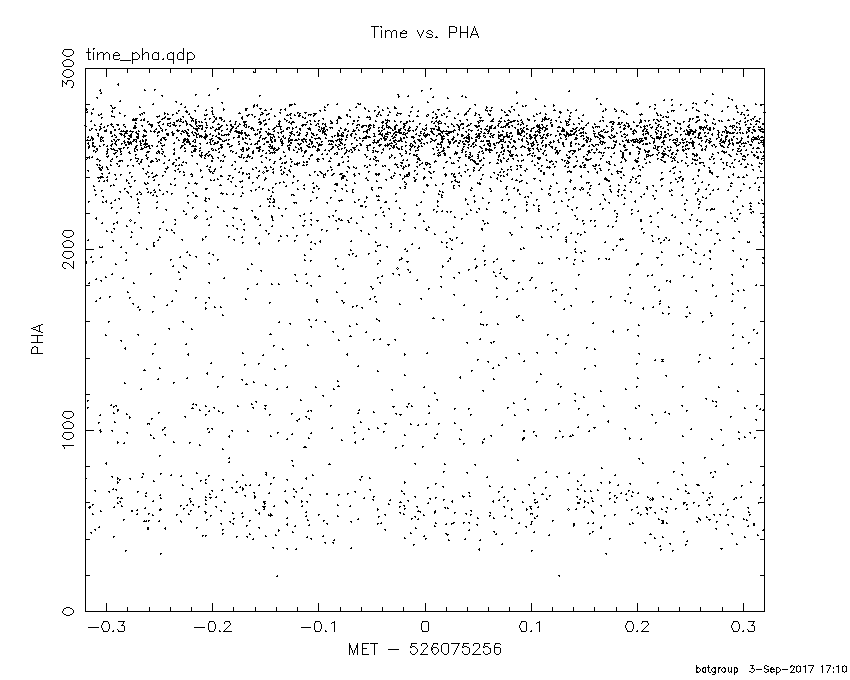
TIME vs. PHA plot around the trigger time
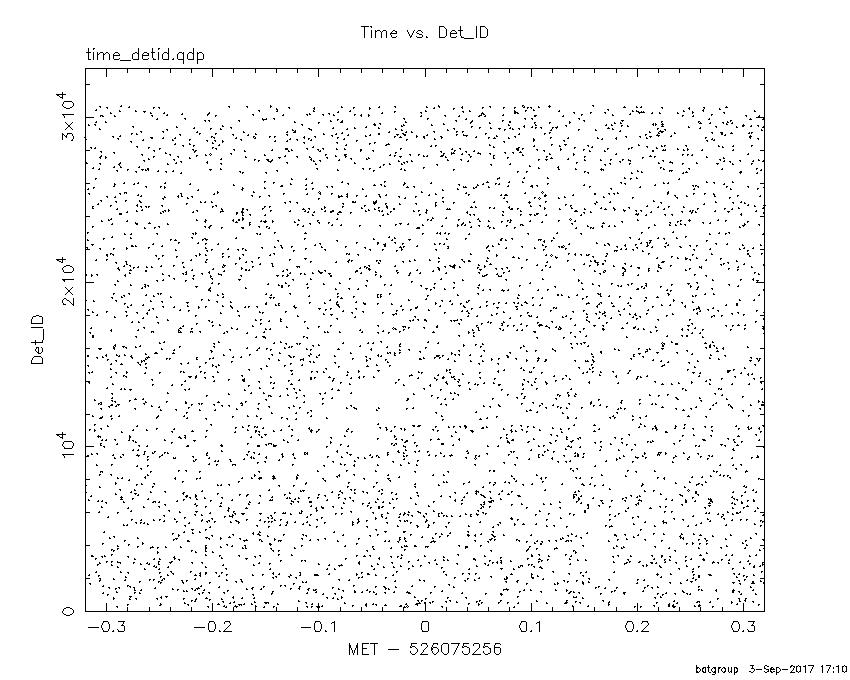
TIME vs. DetID plot around the trigger time
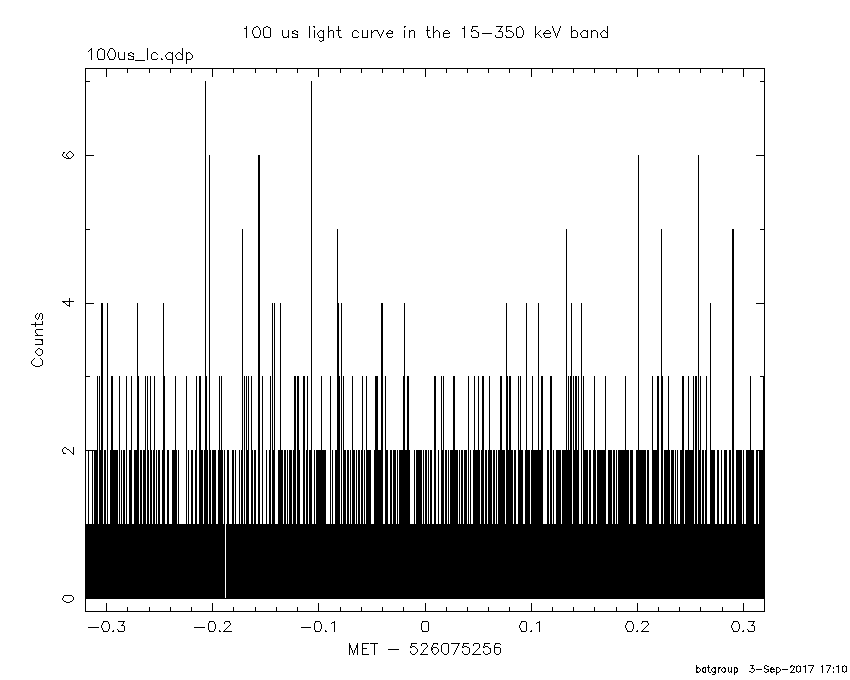
100 us light curve (15-350 keV)
Spacecraft aspect plot

Bright source in the pre-burst/pre-slew/post-slew images
Pre-burst image of 15-350 keV band
Time interval of the image:
-18.599400 352.500590

# RAcent  DECcent POSerr Theta    Phi  PeakCts   SNR AngSep     Name
#  [deg]    [deg]    ['] [deg]  [deg]                   [']
135.5305 -40.5536    0.8  44.1 -133.5  11.8925  14.1    0.1	Vela X-1
170.2591 -60.5836    1.6  15.0 -139.0   2.3605   7.4    2.9	Cen X-3
186.6386 -62.7764    1.0   6.9 -142.8   3.7636  11.3    0.6	GX 301-2
244.9994 -15.6149    2.6  55.6   12.4   7.6386   4.5    1.9	Sco X-1
255.9617 -37.8598    4.2  40.7   38.5   1.7610   2.8    1.5	4U 1700-377
256.5856 -36.3797   18.7  42.2   37.8   0.4093   0.6    7.7	GX 349+2
264.7227 -44.4853   11.7  39.6   52.9   0.8474   1.0    2.3	4U 1735-44
263.0662 -33.9684   26.2  47.2   42.1   0.5432   0.4    8.9	GX 354-0
287.9079 -61.8574    3.1  37.5   88.4   3.8501   3.7 ------	UNKNOWN
255.1337 -41.7302    3.8  37.3   41.4   1.8603   3.0 ------	UNKNOWN
251.2009 -19.8484    3.9  54.2   21.1   5.0382   3.0 ------	UNKNOWN
233.8846 -57.2062    1.6  16.8   46.7   2.6393   7.4 ------	UNKNOWN
211.7092 -23.0129    2.8  39.7  -26.3   2.1413   4.1 ------	UNKNOWN
Pre-slew background subtracted image of 15-350 keV band
Time interval of the image:
0.000000 243.030000

# RAcent  DECcent POSerr Theta    Phi  PeakCts   SNR AngSep     Name
#  [deg]    [deg]    ['] [deg]  [deg]                   [']
135.5353 -40.5517    0.9  44.1 -133.5   7.7216  12.8    0.4	Vela X-1
170.2377 -60.5987    1.6  15.0 -139.1   1.6732   7.2    2.7	Cen X-3
186.6407 -62.7841    0.9   6.9 -142.9   3.1867  13.3    0.9	GX 301-2
245.0039 -15.5994    2.5  55.6   12.4   5.8637   4.6    2.8	Sco X-1
255.9968 -37.8586    5.4  40.8   38.5   0.9902   2.1    1.0	4U 1700-377
256.5961 -36.4210    6.5  42.2   37.8   0.8678   1.8    7.8	GX 349+2
264.4984 -44.3663   13.0  39.6   52.5   0.5551   0.9   11.6	4U 1735-44
263.1301 -33.9706   12.3  47.2   42.1   0.8523   0.9   10.8	GX 354-0
330.8205 -84.6203    2.1  31.5  131.1   2.0167   5.4 ------	UNKNOWN
 71.5512 -79.1562    2.4  35.7  153.3   2.0189   4.8 ------	UNKNOWN
233.8961 -57.2098    2.0  16.8   46.7   1.6090   5.9 ------	UNKNOWN
240.4673 -19.4699    2.6  50.4    9.2   2.6355   4.5 ------	UNKNOWN
Post-slew image of 15-350 keV band
Time interval of the image:
392.600600 663.130000

# RAcent  DECcent POSerr Theta    Phi  PeakCts   SNR AngSep     Name
#  [deg]    [deg]    ['] [deg]  [deg]                   [']
170.0416 -60.5691   27.4  31.8 -142.5  -1.2693  -0.4    8.7	Cen X-3
186.4431 -62.6636    5.6  23.8 -142.2   5.4366   2.1    8.7	GX 301-2
244.9315 -15.6256    3.5  42.4   -3.3  10.5685   3.3    2.9	Sco X-1
255.9875 -37.9920   11.0  24.1   27.4  -2.3522  -1.0    8.9	4U 1700-377
256.3223 -36.2678    6.2  25.7   26.0   4.4045   1.8   10.8	GX 349+2
263.0808 -24.8950    6.1  38.5   26.1   6.1445   1.9    9.8	GX 1+4
264.7576 -44.5015    5.8  23.0   50.6   5.0478   2.0    3.2	4U 1735-44
270.4256 -25.2117    4.7  41.3   35.6  10.2694   2.5   11.1	GX 5-1
270.4305 -25.6800    9.7  40.8   36.0   4.8935   1.2    7.9	GRS 1758-258
276.0824 -30.3480    6.5  39.6   46.4  -7.7032  -1.8    8.2	H1820-303
262.8276 -33.8571   24.8  30.5   33.3  -1.2644  -0.5    8.2	GX 354-0
284.7976 -35.3940    4.0  40.1   60.2  17.9278   2.9 ------	UNKNOWN
106.7361 -61.7908    2.9  54.1 -171.5  27.5977   4.0 ------	UNKNOWN
117.3714 -62.5742    3.2  50.6 -167.0  22.4262   3.7 ------	UNKNOWN
221.8063 -12.0100    2.3  46.1  -35.7  23.1679   4.9 ------	UNKNOWN
Plot creation:
Sun Sep  3 17:12:45 EDT 2017