Estimated redshift from machine learning (Ukwatta et al. 2016) - may take a few minute to calcaulte
Image
Pre-slew 15.0-350.0 keV image (Event data)
#   RAcent    DECcent   POSerr    Theta     Phi              Peak Cts       SNR   Name
  167.3854   -54.3436   0.0173    40.6395  -139.7028         1.7896122     11.081 TRIG_00772006

Foreground time interval of the image:
 -1.208  26.312 (delta_t =  27.520 [sec])
Background time interval of the image:
-77.907  -1.208 (delta_t =  76.699 [sec])
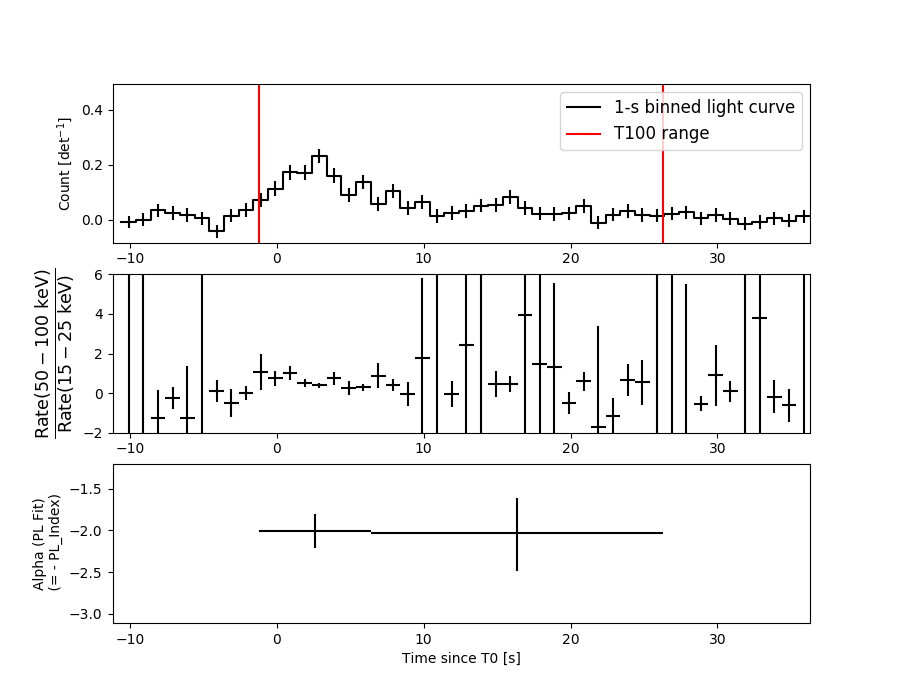
Lightcurves
Notes:
- 1) The mask-weighted light curves are using the flight position.
- 2) Multiple plots of different time binning/intervals are shown to cover all scenarios of short/long GRBs, rate/image triggers, and real/false positives.
- 3) For all the mask-weighted lightcurves, the y-axis units are counts/sec/det where a det is 0.4 x 0.4 = 0.16 sq cm.
- 4) The verticle lines correspond to following: green dotted lines are T50 interval, black dotted lines are T90 interval, blue solid line(s) is a spacecraft slew start time, and orange solid line(s) is a spacecraft slew end time.
- 5) Time of each bin is in the middle of the bin.
1 s binning
From T0-310 s to T0+310 s

From T100_start - 20 s to T100_end + 30 s
Full time interval
64 ms binning
Full time interval

From T100_start to T100_end
From T0-5 sec to T0+5 sec
16 ms binning
From T100_start-5 s to T100_start+5 s
Blue+Cyan dotted lines: Time interval of the scaled map
From 0.000000 to 4.096000
8 ms binning
From T100_start-3 s to T100_start+3 s
Blue+Cyan dotted lines: Time interval of the scaled map
From 0.000000 to 4.096000
2 ms binning
From T100_start-1 s to T100_start+1 s
Blue+Cyan dotted lines: Time interval of the scaled map
From 0.000000 to 4.096000
SN=5 or 10 sec. binning (whichever binning is satisfied first)

SN=5 or 10 sec. binning (T < 200 sec)

Quad-rate summed light curves (from T0-300s to T0+1000s)

Spectral Evolution
Spectra
Notes:
- 1) The fitting includes the systematic errors.
- 2) When the burst includes telescope slew time periods, the fitting uses an average response file made from multiple 5-s response files through out the slew time plus single time preiod for the non-slew times, and weighted by the total counts in the corresponding time period using addrmf. An average response file is needed becuase a spectral fit using the pre-slew DRM will introduce some errors in both a spectral shape and a normalization if the PHA file contains a lot of the slew/post-slew time interval.
- 3) For fits to more complicated models (e.g. a power-law over a cutoff power-law), the BAT team has decided to require a chi-square improvement of more than 6 for each extra dof.
Time averaged spectrum fit using the average DRM
Power-law model

Time interval is from   -1.208 sec. to   26.312 sec.

Spectral model in power-law:
------------------------------------------------------------
Parameters  : value       lower 90%   higher 90%
Photon index: 2.00960     ( -0.208216   0.217587 )
Norm@50keV  : 4.35423E-03    ( -0.000572253   0.00055815 )
------------------------------------------------------------
#Fit statistic : Chi-Squared =          40.32 using 59 PHA bins.
# Reduced chi-squared =         0.7075 for     57 degrees of freedom
# Null hypothesis probability =   9.537863e-01

Photon flux (15-150 keV)    in 27.52 sec: 0.656082 ( -0.075132  0.075411 ) ph/cm2/s
Energy fluence (15-150 keV)             : 1.10581e-06 ( -1.35992e-07  1.3753e-07 ) ergs/cm2
Cutoff power-law model

Time interval is from   -1.208 sec. to   26.312 sec.
Spectral model in the cutoff power-law:
------------------------------------------------------------
Parameters  : value       lower 90%   higher 90%
Photon index: 1.98578     ( -0.875378   0.107244 )
Epeak [keV] : 26.9937      ( -24.7657 -27.0027 )
Norm@50keV  : 4.48744E-03    (     )
------------------------------------------------------------
#Fit statistic : Chi-Squared =          40.32 using 59 PHA bins.
# Reduced chi-squared =         0.7200 for     56 degrees of freedom
# Null hypothesis probability =   9.433133e-01

Photon flux (15-150 keV)    in 27.52 sec: 0.655345 ( -0.078908  0.073835 ) ph/cm2/s
Energy fluence (15-150 keV)             : 1.10354e-06 ( 0  0 ) ergs/cm2
Band function

Time interval is from   -1.208 sec. to   26.312 sec.


Spectral model in the Band function:
------------------------------------------------------------
Parameters  : value       lower 90%   higher 90%
alpha       :    (     )
beta        :     (     )
Epeak [keV] :       (   )
Norm@50keV   :     (     )
------------------------------------------------------------

Photon flux (15-150 keV)    in  sec:  (    ) ph/cm2/s
Energy fluence (15-150 keV)             : 0 ( 0  0 ) ergs/cm2
Single BB
Spectral model blackbody:
------------------------------------------------------------
Parameters  : value    Lower 90%  Upper 90%
kT [keV]    : 10.6909  (-1.45989  1.70803)
R^2/D10^2   : 0.226799  (-0.099073   0.17567)
(R is the radius in km and D10 is the distance to the source in units of 10 kpc)
------------------------------------------------------------
#Fit statistic : Chi-Squared =          64.28 using 59 PHA bins.
# Reduced chi-squared =          1.128 for     57 degrees of freedom
# Null hypothesis probability =   2.368942e-01

Energy  Fluence     90% Error
[keV]   [erg/cm2]   [erg/cm2]
15- 25  1.481e-07   3.227e-08
25- 50  4.036e-07   6.577e-08
50-150  2.548e-07   6.862e-08
15-150  8.064e-07   1.215e-07
Thermal bremsstrahlung (OTTB)

Spectral model: thermal bremsstrahlung
------------------------------------------------------------
Parameters  : value         Lower 90%    Upper 90%
kT [keV]    : 72.3523       (-21.4726      37.9774)
Norm        : 3.13224       (-0.554973     0.674315)
------------------------------------------------------------
#Fit statistic : Chi-Squared =          42.02 using 59 PHA bins.
# Reduced chi-squared =         0.7371 for     57 degrees of freedom
# Null hypothesis probability =   9.312859e-01

Energy  Fluence     90% Error
[keV]   [erg/cm2]   [erg/cm2]
15- 25  2.219e-07   3.554e-08
25- 50  3.562e-07   4.431e-08
50-150  4.687e-07   1.324e-07
15-150  1.047e-06   1.591e-07
Double BB
Spectral model: bbodyrad<1> + bbodyrad<2>
------------------------------------------------------------
Parameters  : value         Lower 90%    Upper 90%
kT1 [keV]   : 5.64769        (-2.07993      2.30729)
R1^2/D10^2  : 1.95158        (-1.35306      11.385)
kT2 [keV]   : 20.6260        (-6.47254      19.4259)
R2^2/D10^2  : 1.34641E-02    (-0.0118476   0.0491969)
------------------------------------------------------------
#Fit statistic : Chi-Squared =          42.60 using 59 PHA bins.
# Reduced chi-squared =         0.7745 for     55 degrees of freedom
# Null hypothesis probability =   8.888423e-01

Energy  Fluence     90% Error
[keV]   [erg/cm2]   [erg/cm2]
15- 25  2.376e-07   1.192e-07
25- 50  3.334e-07   1.358e-07
50-150  4.956e-07   2.859e-07
15-150  1.067e-06   4.731e-07
Peak spectrum fit
Power-law model

Time interval is from    2.484 sec. to    3.484 sec.

Spectral model in power-law:
------------------------------------------------------------
Parameters  : value       lower 90%   higher 90%
Photon index: 2.25334     ( -0.393492   0.449191 )
Norm@50keV  : 1.18941E-02    ( -0.00334767   0.00314462 )
------------------------------------------------------------
#Fit statistic : Chi-Squared =          45.50 using 59 PHA bins.
# Reduced chi-squared =         0.7983 for     57 degrees of freedom
# Null hypothesis probability =   8.633860e-01

Photon flux (15-150 keV)    in 1 sec: 2.02622 ( -0.40635  0.40765 ) ph/cm2/s
Energy fluence (15-150 keV)             : 1.12766e-07 ( -2.56456e-08  2.63445e-08 ) ergs/cm2
Cutoff power-law model
Time interval is from    2.484 sec. to    3.484 sec.
Spectral model in the cutoff power-law:
------------------------------------------------------------
Parameters  : value       lower 90%   higher 90%
Photon index: 2.48865     ( -1.55376   0.254834 )
Epeak [keV] : 189.912      (   )
Norm@50keV  : 8.94737E-03    (     )
------------------------------------------------------------
#Fit statistic : Chi-Squared =          45.34 using 59 PHA bins.
# Reduced chi-squared =         0.8097 for     56 degrees of freedom
# Null hypothesis probability =   8.449202e-01

Photon flux (15-150 keV)    in 1 sec: 1.99450 ( -0.3957  0.39777 ) ph/cm2/s
Energy fluence (15-150 keV)             : 0 ( 0  0 ) ergs/cm2
Band function

Time interval is from    2.484 sec. to    3.484 sec.


Spectral model in the Band function:
------------------------------------------------------------
Parameters  : value       lower 90%   higher 90%
alpha       :    (     )
beta        :     (     )
Epeak [keV] :       (   )
Norm@50keV   :     (     )
------------------------------------------------------------

Photon flux (15-150 keV)    in  sec:  (    ) ph/cm2/s
Energy fluence (15-150 keV)             : 0 ( 0  0 ) ergs/cm2
Single BB
Spectral model blackbody:
------------------------------------------------------------
Parameters  : value    Lower 90%  Upper 90%
kT [keV]    : 8.98756  (-2.20406  2.85051)
R^2/D10^2   : 1.31936  (-0.879636   2.82542)
(R is the radius in km and D10 is the distance to the source in units of 10 kpc)
------------------------------------------------------------
#Fit statistic : Chi-Squared =          55.19 using 59 PHA bins.
# Reduced chi-squared =         0.9683 for     57 degrees of freedom
# Null hypothesis probability =   5.431805e-01

Energy  Fluence     90% Error
[keV]   [erg/cm2]   [erg/cm2]
15- 25  2.074e-08   9.147e-09
25- 50  4.398e-08   1.586e-08
50-150  1.670e-08   9.243e-09
15-150  8.142e-08   3.245e-08
Thermal bremsstrahlung (OTTB)

Spectral model: thermal bremsstrahlung
------------------------------------------------------------
Parameters  : value         Lower 90%    Upper 90%
kT [keV]    : 49.5280       (-21.3833      51.763)
Norm        : 11.2687       (-3.70625     6.32771)
------------------------------------------------------------
#Fit statistic : Chi-Squared =          47.09 using 59 PHA bins.
# Reduced chi-squared =         0.8262 for     57 degrees of freedom
# Null hypothesis probability =   8.223384e-01

Energy  Fluence     90% Error
[keV]   [erg/cm2]   [erg/cm2]
15- 25  2.749e-08   7.770e-09
25- 50  3.935e-08   1.222e-08
50-150  3.787e-08   1.892e-08
15-150  1.047e-07   3.703e-08
Double BB
Spectral model: bbodyrad<1> + bbodyrad<2>
------------------------------------------------------------
Parameters  : value         Lower 90%    Upper 90%
kT1 [keV]   : 3.67873        (-1.71692      1.51516)
R1^2/D10^2  : 44.2591        (-34.0026      1862.63)
kT2 [keV]   : 15.3370        (-5.37865      18.3487)
R2^2/D10^2  : 0.126439    (-0.120101   0.19808)
------------------------------------------------------------
#Fit statistic : Chi-Squared =          45.86 using 59 PHA bins.
# Reduced chi-squared =         0.8339 for     55 degrees of freedom
# Null hypothesis probability =   8.051323e-01

Energy  Fluence     90% Error
[keV]   [erg/cm2]   [erg/cm2]
15- 25  3.264e-08   1.842e-08
25- 50  3.261e-08   1.747e-08
50-150  4.070e-08   2.571e-08
15-150  1.060e-07   5.495e-08
Pre-slew spectrum (Pre-slew PHA with pre-slew DRM)
Power-law model
Spectral model in power-law:
------------------------------------------------------------
Parameters  : value       lower 90%   higher 90%
Photon index: 2.00960     ( -0.208216   0.217587 )
Norm@50keV  : 4.35423E-03    ( -0.000572253   0.00055815 )
------------------------------------------------------------
#Fit statistic : Chi-Squared =          40.32 using 59 PHA bins.
# Reduced chi-squared =         0.7075 for     57 degrees of freedom
# Null hypothesis probability =   9.537863e-01

Photon flux (15-150 keV)    in 27.52 sec: 0.656033 ( -0.0751224  0.0754004 ) ph/cm2/s
Energy fluence (15-150 keV)             : 1.10562e-06 ( -1.35986e-07  1.37539e-07 ) ergs/cm2
Cutoff power-law model

Spectral model in the cutoff power-law:
------------------------------------------------------------
Parameters  : value       lower 90%   higher 90%
Photon index: 1.98579     ( -0.875384   0.107466 )
Epeak [keV] : 26.9942      ( -24.7584 -26.9981 )
Norm@50keV  : 4.48736E-03    (     )
------------------------------------------------------------
#Fit statistic : Chi-Squared =          40.32 using 59 PHA bins.
# Reduced chi-squared =         0.7200 for     56 degrees of freedom
# Null hypothesis probability =   9.433133e-01

Photon flux (15-150 keV)    in 27.52 sec: 0.653848 ( -0.077847  0.077346 ) ph/cm2/s
Energy fluence (15-150 keV)             : 1.10552e-06 ( -1.56198e-07  1.36084e-07 ) ergs/cm2
Band function

Spectral model in the Band function:
------------------------------------------------------------
Parameters  : value       lower 90%   higher 90%
alpha       :    (     )
beta        :     (     )
Epeak [keV] :       (   )
Norm@50keV   :     (     )
------------------------------------------------------------

Photon flux (15-150 keV)    in  sec:  (    ) ph/cm2/s
Energy fluence (15-150 keV)             : 0 ( 0  0 ) ergs/cm2
S(25-50 keV) vs. S(50-100 keV) plot
S(25-50 keV)  = 3.33e-07
S(50-100 keV) = 3.30e-07
T90 vs. Hardness ratio plot

T90                                   = 21.1840000152588 sec.
Hardness ratio (energy fluence ratio) = 0.990991
Color vs. Color plot
Count Ratio  (25-50 keV) / (15-25 keV) = 0.990142
Count Ratio (50-100 keV) / (15-25 keV) = 0.595889
Mask shadow pattern
IMX = -6.546266131044436E-01, IMY = 5.551078567736205E-01
TIME vs. PHA plot around the trigger time
Blue+Cyan dotted lines: Time interval of the scaled map
From 0.000000 to 4.096000
TIME vs. DetID plot around the trigger time
Blue+Cyan dotted lines: Time interval of the scaled map
From 0.000000 to 4.096000
100 us light curve (15-350 keV)

Blue+Cyan dotted lines: Time interval of the scaled map
From 0.000000 to 4.096000
Spacecraft aspect plot
Bright source in the pre-burst/pre-slew/post-slew images
Pre-burst image of 15-350 keV band
Time interval of the image:
-77.907400 -1.208000

# RAcent  DECcent POSerr Theta    Phi  PeakCts   SNR AngSep     Name
#  [deg]    [deg]    ['] [deg]  [deg]                   [']
170.2125 -60.5619    3.4  37.6 -148.6   0.8023   3.4    4.8	Cen X-3
186.6347 -62.7489    3.2  29.8 -152.2   0.6159   3.6    1.4	GX 301-2
244.9894 -15.6343    0.5  33.6    4.7   4.0770  22.4    0.7	Sco X-1
256.1211 -37.8704    2.9  19.0   51.3   0.6345   3.9    6.6	4U 1700-377
256.3022 -36.4354    7.1  20.1   48.4   0.2673   1.6    6.5	GX 349+2
262.9958 -24.7324    5.3  32.6   40.1   0.4759   2.2    1.1	GX 1+4
264.7178 -44.5932   15.8  21.4   77.7   0.1370   0.7    8.7	4U 1735-44
270.4244 -25.2065    3.6  36.5   49.8   0.8730   3.2   10.8	GX 5-1
270.1312 -25.6959    3.3  36.0   50.0   0.9383   3.5    9.7	GRS 1758-258
273.9123 -13.9010    5.7  47.4   43.0  -1.1243  -2.0    9.8	GX 17+2
275.8491 -30.2464    4.4  36.4   61.5   0.8824   2.6    8.2	H1820-303
263.0288 -33.7518    4.8  26.0   52.7   0.4456   2.4    5.4	GX 354-0
312.5510 -62.9198    2.0  43.8  125.0   3.4875   5.8 ------	UNKNOWN
233.8387 -57.2242    0.3   9.3  165.4   4.6424  34.0 ------	UNKNOWN
195.9670 -60.0142    2.8  24.9 -148.0   0.6434   4.2 ------	UNKNOWN
133.8450 -58.7083    2.7  55.0 -156.2   2.9518   4.3 ------	UNKNOWN
Pre-slew background subtracted image of 15-350 keV band
Time interval of the image:
-1.208000 26.312000

# RAcent  DECcent POSerr Theta    Phi  PeakCts   SNR AngSep     Name
#  [deg]    [deg]    ['] [deg]  [deg]                   [']
170.4459 -60.6914  209.2  37.4 -148.8   0.0070   0.1    5.6	Cen X-3
186.8658 -62.8665   38.4  29.7 -152.5  -0.0291  -0.3    8.1	GX 301-2
245.1085 -15.5920   45.9  33.6    4.8   0.0249   0.3    8.0	Sco X-1
255.9466 -37.9886    7.0  18.8   51.4   0.1464   1.7    8.9	4U 1700-377
256.2734 -36.5648    4.9  20.0   48.6   0.2175   2.4   11.6	GX 349+2
263.1124 -24.8737    4.4  32.6   40.4  -0.3103  -2.6    9.5	GX 1+4
264.6069 -44.3203    5.8  21.4   76.9   0.2026   2.0    9.7	4U 1735-44
270.4745 -25.2083    4.9  36.6   49.9  -0.3866  -2.3   12.9	GX 5-1
270.1805 -25.8803    0.0  35.9   50.3   0.1650   1.0   10.5	GRS 1758-258
274.1368 -14.0171    6.8  47.5   43.4  -0.5715  -1.7    7.7	GX 17+2
275.8365 -30.4327    6.2  36.3   61.7   0.3259   1.9    6.0	H1820-303
263.1273 -33.6909    3.3  26.1   52.7  -0.3610  -3.5   11.0	GX 354-0
237.8222  10.9159    2.4  59.0  -10.4   2.3773   4.8 ------	UNKNOWN
167.3854 -54.3437    1.0  40.6 -139.7   1.7895  11.1 ------	UNKNOWN
Post-slew image of 15-350 keV band
Time interval of the image:
102.692600 962.455000

# RAcent  DECcent POSerr Theta    Phi  PeakCts   SNR AngSep     Name
#  [deg]    [deg]    ['] [deg]  [deg]                   [']
135.5076 -40.6254    2.6  25.2 -163.4   3.6050   4.5    4.3	Vela X-1
170.4014 -60.6547    1.8   6.5   73.6   4.8882   6.3    3.2	Cen X-3
186.6983 -62.7804    0.7  13.0   44.6  12.5218  15.7    1.3	GX 301-2
233.8316 -57.2191    0.3  35.9   29.0  48.2446  41.6 ------	UNKNOWN
200.0574 -61.4331    3.5  18.5   32.3   2.3691   3.3 ------	UNKNOWN
113.7126 -22.9231    3.2  50.6 -167.0   8.6147   3.6 ------	UNKNOWN
Plot creation:
Fri Sep 29 00:50:14 EDT 2017