Special notes of this burst
Image
Pre-slew 15.0-350.0 keV image (Event data)
#   RAcent    DECcent   POSerr    Theta     Phi              Peak Cts       SNR   Name
135.544 42.849 0.000 10.186 -8.975 0.138 9.093 TRIG_00777215

Image time interval: 0.000 to 2.240 [sec]
Lightcurves
Notes:
- 1) The mask-weighted light curves are using the flight position.
- 2) Multiple plots of different time binning/intervals are shown to cover all scenarios of short/long GRBs, rate/image triggers, and real/false positives.
- 3) For all the mask-weighted lightcurves, the y-axis units are counts/sec/det where a det is 0.4 x 0.4 = 0.16 sq cm.
- 4) The verticle lines correspond to following: green dotted lines are T50 interval, black dotted lines are T90 interval, blue solid line(s) is a spacecraft slew start time, and orange solid line(s) is a spacecraft slew end time.
- 5) Time of each bin is in the middle of the bin.
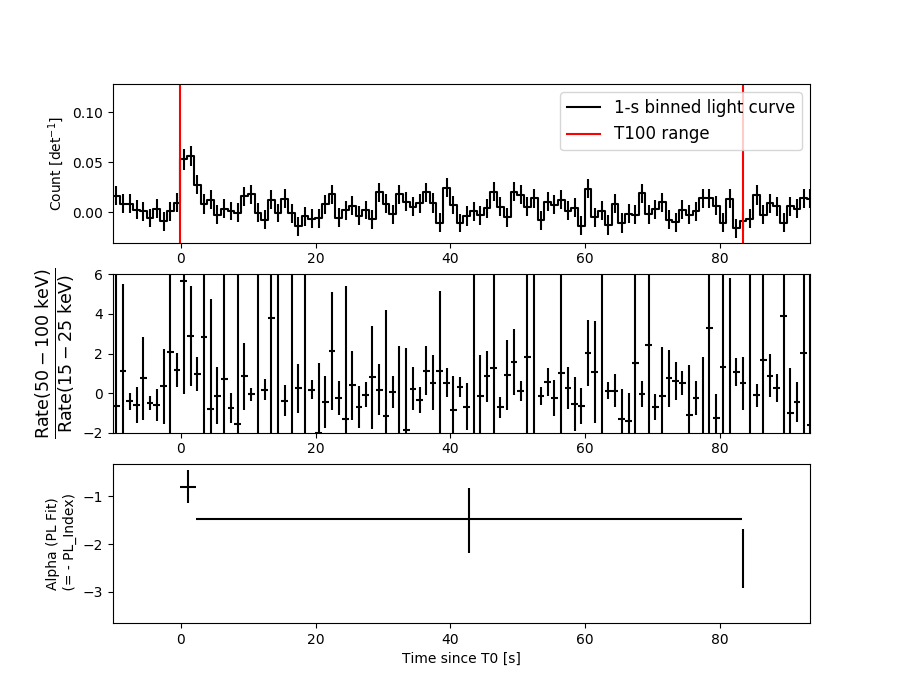
1 s binning
From T0-310 s to T0+310 s
From T100_start - 20 s to T100_end + 30 s
Full time interval
64 ms binning
Full time interval
From T100_start to T100_end
From T0-5 sec to T0+5 sec
16 ms binning
From T100_start-5 s to T100_start+5 s
Blue+Cyan dotted lines: Time interval of the scaled map
From 0.000000 to 2.048000
8 ms binning
From T100_start-3 s to T100_start+3 s
Blue+Cyan dotted lines: Time interval of the scaled map
From 0.000000 to 2.048000
2 ms binning
From T100_start-1 s to T100_start+1 s
Blue+Cyan dotted lines: Time interval of the scaled map
From 0.000000 to 2.048000
SN=5 or 10 sec. binning (whichever binning is satisfied first)
SN=5 or 10 sec. binning (T < 200 sec)
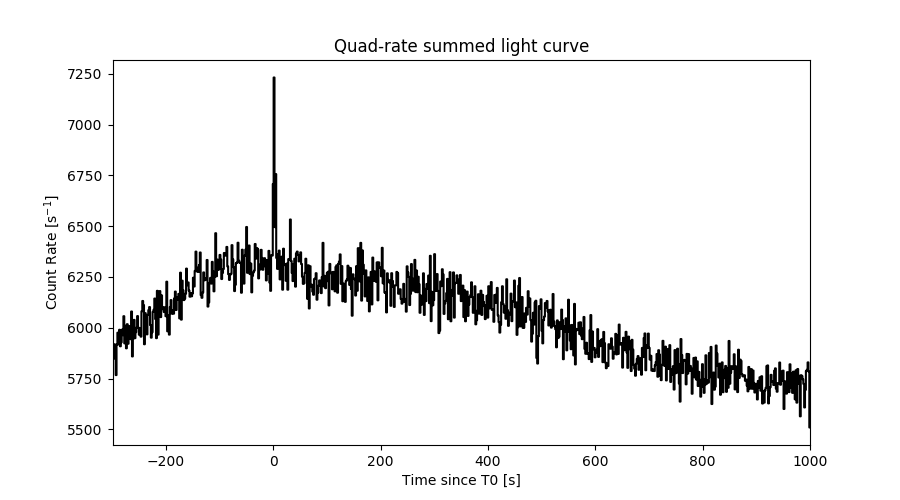
Quad-rate summed light curves (from T0-300s to T0+1000s)
Spectral Evolution
Spectra
Notes:
- 1) The fitting includes the systematic errors.
- 2) When the burst includes telescope slew time periods, the fitting uses an average response file made from multiple 5-s response files through out the slew time plus single time preiod for the non-slew times, and weighted by the total counts in the corresponding time period using addrmf. An average response file is needed becuase a spectral fit using the pre-slew DRM will introduce some errors in both a spectral shape and a normalization if the PHA file contains a lot of the slew/post-slew time interval.
- 3) For fits to more complicated models (e.g. a power-law over a cutoff power-law), the BAT team has decided to require a chi-square improvement of more than 6 for each extra dof.
Time averaged spectrum fit using the average DRM
Power-law model
Time interval is from   -0.156 sec. to   83.348 sec.

Spectral model in power-law:
------------------------------------------------------------
Parameters  : value       lower 90%   higher 90%
Photon index: 1.35148     ( -0.481681   0.485282 )
Norm@50keV  : 3.24044E-04    ( -0.000105834   0.000105353 )
------------------------------------------------------------
#Fit statistic : Chi-Squared =          79.25 using 59 PHA bins.
# Reduced chi-squared =          1.390 for     57 degrees of freedom
# Null hypothesis probability =   2.731207e-02

Photon flux (15-150 keV)    in 83.5 sec: 3.90401E-02 ( -0.0125265  0.0126071 ) ph/cm2/s
Energy fluence (15-150 keV)             : 2.64476e-07 ( -9.27184e-08  9.66396e-08 ) ergs/cm2
Cutoff power-law model
Time interval is from   -0.156 sec. to   83.348 sec.
Spectral model in the cutoff power-law:
------------------------------------------------------------
Parameters  : value       lower 90%   higher 90%
Photon index: -3.25996     ( 3.51879   3.89855 )
Epeak [keV] : 52.7195      ( -10.2908 31.7793 )
Norm@50keV  : 8.02692E-02    ( -0.0772621   219.17 )
------------------------------------------------------------
#Fit statistic : Chi-Squared =          73.27 using 59 PHA bins.
# Reduced chi-squared =          1.308 for     56 degrees of freedom
# Null hypothesis probability =   6.053977e-02

Photon flux (15-150 keV)    in 83.5 sec: 3.45320E-02 ( -0.0125957  0.0128289 ) ph/cm2/s
Energy fluence (15-150 keV)             : 2.04558e-07 ( -7.23111e-08  9.36478e-08 ) ergs/cm2
Band function

Time interval is from   -0.156 sec. to   83.348 sec.


Spectral model in the Band function:
------------------------------------------------------------
Parameters  : value       lower 90%   higher 90%
alpha       :    (     )
beta        :     (     )
Epeak [keV] :       (   )
Norm@50keV   :     (     )
------------------------------------------------------------

Photon flux (15-150 keV)    in  sec:  (    ) ph/cm2/s
Energy fluence (15-150 keV)             : 0 ( 0  0 ) ergs/cm2
Single BB
Spectral model blackbody:
------------------------------------------------------------
Parameters  : value    Lower 90%  Upper 90%
kT [keV]    : 14.4846  (-3.42384  4.97667)
R^2/D10^2   : 5.80969E-03  (-0.0058097   0.00908725)
(R is the radius in km and D10 is the distance to the source in units of 10 kpc)
------------------------------------------------------------
#Fit statistic : Chi-Squared =          73.62 using 59 PHA bins.
# Reduced chi-squared =          1.292 for     57 degrees of freedom
# Null hypothesis probability =   6.838404e-02

Energy  Fluence     90% Error
[keV]   [erg/cm2]   [erg/cm2]
15- 25  2.142e-08   1.333e-08
25- 50  8.235e-08   4.910e-08
50-150  1.157e-07   7.519e-08
15-150  2.195e-07   1.245e-07
Thermal bremsstrahlung (OTTB)
Spectral model: thermal bremsstrahlung
------------------------------------------------------------
Parameters  : value         Lower 90%    Upper 90%
kT [keV]    : 199.361       (-199.363      -199.363)
Norm        : 0.162822       (-0.051537     0.051574)
------------------------------------------------------------
#Fit statistic : Chi-Squared =          78.60 using 59 PHA bins.
# Reduced chi-squared =          1.379 for     57 degrees of freedom
# Null hypothesis probability =   3.053922e-02

Energy  Fluence     90% Error
[keV]   [erg/cm2]   [erg/cm2]
15- 25  3.385e-08   2.211e-08
25- 50  6.512e-08   4.005e-08
50-150  1.428e-07   8.663e-08
15-150  2.418e-07   1.481e-07
Double BB

Spectral model: bbodyrad<1> + bbodyrad<2>
------------------------------------------------------------
Parameters  : value         Lower 90%    Upper 90%
kT1 [keV]   : 14.4359        (-14.4767      -14.4767)
R1^2/D10^2  : 3.81307E-04        (-0.000383676      -0.000383676)
kT2 [keV]   : 14.4937        (-14.486      -14.486)
R2^2/D10^2  : 5.42060E-03    (-0.0054247   -0.0054247)
------------------------------------------------------------
#Fit statistic : Chi-Squared =          73.62 using 59 PHA bins.
# Reduced chi-squared =          1.339 for     55 degrees of freedom
# Null hypothesis probability =   4.753850e-02

Energy  Fluence     90% Error
[keV]   [erg/cm2]   [erg/cm2]
15- 25  2.140e-08   1.716e+00
25- 50  8.232e-08   1.598e+01
50-150  1.158e-07   3.327e+02
15-150  2.195e-07   3.627e+02
Peak spectrum fit
Power-law model
Time interval is from    0.452 sec. to    1.452 sec.

Spectral model in power-law:
------------------------------------------------------------
Parameters  : value       lower 90%   higher 90%
Photon index: 0.926946     ( -0.397051   0.367905 )
Norm@50keV  : 4.79374E-03    ( -0.00104575   0.001037 )
------------------------------------------------------------
#Fit statistic : Chi-Squared =          65.79 using 59 PHA bins.
# Reduced chi-squared =          1.154 for     57 degrees of freedom
# Null hypothesis probability =   1.987962e-01

Photon flux (15-150 keV)    in 1 sec: 0.550424 ( -0.11999  0.120498 ) ph/cm2/s
Energy fluence (15-150 keV)             : 5.32513e-08 ( -1.24062e-08  1.25948e-08 ) ergs/cm2
Cutoff power-law model
Time interval is from    0.452 sec. to    1.452 sec.
Spectral model in the cutoff power-law:
------------------------------------------------------------
Parameters  : value       lower 90%   higher 90%
Photon index: 0.290651     ( -2.26028   0.966731 )
Epeak [keV] : 148.928      ( -148.954 -148.954 )
Norm@50keV  : 9.38672E-03    ( -0.00547917   0.0769161 )
------------------------------------------------------------
#Fit statistic : Chi-Squared =          65.32 using 59 PHA bins.
# Reduced chi-squared =          1.166 for     56 degrees of freedom
# Null hypothesis probability =   1.845628e-01

Photon flux (15-150 keV)    in 1 sec: 0.535788 ( -0.127259  0.125835 ) ph/cm2/s
Energy fluence (15-150 keV)             : 5.09988e-08 ( -1.40806e-08  1.37706e-08 ) ergs/cm2
Band function

Time interval is from    0.452 sec. to    1.452 sec.


Spectral model in the Band function:
------------------------------------------------------------
Parameters  : value       lower 90%   higher 90%
alpha       :    (     )
beta        :     (     )
Epeak [keV] :       (   )
Norm@50keV   :     (     )
------------------------------------------------------------

Photon flux (15-150 keV)    in  sec:  (    ) ph/cm2/s
Energy fluence (15-150 keV)             : 0 ( 0  0 ) ergs/cm2
Single BB
Spectral model blackbody:
------------------------------------------------------------
Parameters  : value    Lower 90%  Upper 90%
kT [keV]    : 21.5090  (-5.18976  8.24363)
R^2/D10^2   : 2.14792E-02  (-0.0135329   0.0301984)
(R is the radius in km and D10 is the distance to the source in units of 10 kpc)
------------------------------------------------------------
#Fit statistic : Chi-Squared =          67.04 using 59 PHA bins.
# Reduced chi-squared =          1.176 for     57 degrees of freedom
# Null hypothesis probability =   1.706358e-01

Energy  Fluence     90% Error
[keV]   [erg/cm2]   [erg/cm2]
15- 25  1.858e-09   8.612e-10
25- 50  9.692e-09   4.132e-09
50-150  3.347e-08   1.597e-08
15-150  4.502e-08   2.016e-08
Thermal bremsstrahlung (OTTB)
Spectral model: thermal bremsstrahlung
------------------------------------------------------------
Parameters  : value         Lower 90%    Upper 90%
kT [keV]    : 200.000       (-63.5264      -200)
Norm        : 2.19148       (-0.496992     0.496992)
------------------------------------------------------------
#Fit statistic : Chi-Squared =          72.84 using 59 PHA bins.
# Reduced chi-squared =          1.278 for     57 degrees of freedom
# Null hypothesis probability =   7.694910e-02

Energy  Fluence     90% Error
[keV]   [erg/cm2]   [erg/cm2]
15- 25  5.459e-09   3.223e-09
25- 50  1.050e-08   6.290e-09
50-150  2.303e-08   1.369e-08
15-150  3.899e-08   2.315e-08
Double BB
------------------------------------------------------------
#Fit statistic : Chi-Squared =          65.36 using 59 PHA bins.
#Fit statistic : Chi-Squared =          65.34 using 59 PHA bins.
#Fit statistic : Chi-Squared =          65.24 using 59 PHA bins.
#Fit statistic : Chi-Squared =          65.16 using 59 PHA bins.
# Reduced chi-squared =          1.188 for     55 degrees of freedom
# Reduced chi-squared =          1.188 for     55 degrees of freedom
# Reduced chi-squared =          1.186 for     55 degrees of freedom
# Reduced chi-squared =          1.185 for     55 degrees of freedom
# Null hypothesis probability =   1.599824e-01
# Null hypothesis probability =   1.603465e-01
# Null hypothesis probability =   1.624899e-01
# Null hypothesis probability =   1.641741e-01

Energy  Fluence     90% Error
[keV]   [erg/cm2]   [erg/cm2]
15- 25  3.023e-09   1.987e-09
25- 50  9.947e-09   5.605e-09
50-150  3.705e-08   2.168e-08
15-150  5.002e-08   2.761e-08
Pre-slew spectrum (Pre-slew PHA with pre-slew DRM)
Power-law model
Spectral model in power-law:
------------------------------------------------------------
Parameters  : value       lower 90%   higher 90%
Photon index: 1.11678     ( -0.583198   0.548722 )
Norm@50keV  : 5.42001E-04    ( -0.000186803   0.000186749 )
------------------------------------------------------------
#Fit statistic : Chi-Squared =          67.52 using 59 PHA bins.
# Reduced chi-squared =          1.185 for     57 degrees of freedom
# Null hypothesis probability =   1.605488e-01

Photon flux (15-150 keV)    in 26.58 sec: 6.29703E-02 ( -0.0220042  0.0221768 ) ph/cm2/s
Energy fluence (15-150 keV)             : 1.49868e-07 ( -5.55025e-08  5.73131e-08 ) ergs/cm2
Cutoff power-law model
Spectral model in the cutoff power-law:
------------------------------------------------------------
Parameters  : value       lower 90%   higher 90%
Photon index: -1.02479     ( -6.84322   2.34976 )
Epeak [keV] : 72.9927      ( -21.5378 -72.9888 )
Norm@50keV  : 5.84170E-03    ( -0.00584338   12.0719 )
------------------------------------------------------------
#Fit statistic : Chi-Squared =          65.52 using 59 PHA bins.
# Reduced chi-squared =          1.170 for     56 degrees of freedom
# Null hypothesis probability =   1.799431e-01

Photon flux (15-150 keV)    in 26.58 sec: 5.81148E-02 ( -0.0223554  0.0229278 ) ph/cm2/s
Energy fluence (15-150 keV)             : 1.29511e-07 ( -5.6415e-08  6.31262e-08 ) ergs/cm2
Band function
Spectral model in the Band function:
------------------------------------------------------------
Parameters  : value       lower 90%   higher 90%
alpha       :    (     )
beta        :     (     )
Epeak [keV] :       (   )
Norm@50keV   :     (     )
------------------------------------------------------------

Photon flux (15-150 keV)    in  sec:  (    ) ph/cm2/s
Energy fluence (15-150 keV)             : 0 ( 0  0 ) ergs/cm2
S(25-50 keV) vs. S(50-100 keV) plot
S(25-50 keV)  = 6.05e-08
S(50-100 keV) = 9.52e-08
T90 vs. Hardness ratio plot
T90                                   = 68.4239999651909 sec.
Hardness ratio (energy fluence ratio) = 1.57355
Color vs. Color plot
Count Ratio  (25-50 keV) / (15-25 keV) = 1.9445
Count Ratio (50-100 keV) / (15-25 keV) = 0.993814
Mask shadow pattern
IMX = 1.756683852061149E-01, IMY = 2.862029514155098E-02
TIME vs. PHA plot around the trigger time
Blue+Cyan dotted lines: Time interval of the scaled map
From 0.000000 to 2.048000
TIME vs. DetID plot around the trigger time
Blue+Cyan dotted lines: Time interval of the scaled map
From 0.000000 to 2.048000
100 us light curve (15-350 keV)
Blue+Cyan dotted lines: Time interval of the scaled map
From 0.000000 to 2.048000
Spacecraft aspect plot
Bright source in the pre-burst/pre-slew/post-slew images
Pre-burst image of 15-350 keV band
Time interval of the image:
-239.080000 -0.156000

# RAcent  DECcent POSerr Theta    Phi  PeakCts   SNR AngSep     Name
#  [deg]    [deg]    ['] [deg]  [deg]                   [']
 99.6957  28.7271    2.4  37.6   41.9   1.6797   4.7 ------	UNKNOWN
110.9178   1.9867    3.1  55.9   10.7   4.0334   3.7 ------	UNKNOWN
278.6078  66.5603    2.5  56.8  173.9   5.2825   4.6 ------	UNKNOWN
125.2458  48.7833    2.4   9.6   47.1   0.8648   4.8 ------	UNKNOWN
222.4781  53.5155    2.5  47.0 -150.3   2.1715   4.7 ------	UNKNOWN
150.9208   3.1208    3.0  50.6  -39.4   3.3309   3.9 ------	UNKNOWN
Pre-slew background subtracted image of 15-350 keV band
Time interval of the image:
-0.156000 26.420600

# RAcent  DECcent POSerr Theta    Phi  PeakCts   SNR AngSep     Name
#  [deg]    [deg]    ['] [deg]  [deg]                   [']
Post-slew image of 15-350 keV band
Time interval of the image:
57.820610 963.038900
1833.920000 2000.000000

# RAcent  DECcent POSerr Theta    Phi  PeakCts   SNR AngSep     Name
#  [deg]    [deg]    ['] [deg]  [deg]                   [']
110.6163   9.4892    3.1  39.8   13.4   3.3594   3.7 ------	UNKNOWN
117.7987  17.0442    3.2  29.9    8.7   2.2865   3.7 ------	UNKNOWN
210.5680  64.2392    2.6  46.0 -171.4   5.6770   4.3 ------	UNKNOWN
187.2502  29.5535    2.9  43.1 -116.7  10.5512   3.9 ------	UNKNOWN
152.4612  -3.0090    2.5  48.3  -50.0  14.6864   4.7 ------	UNKNOWN
Plot creation:
Fri Oct 20 11:28:44 EDT 2017