Estimated redshift from machine learning (Ukwatta et al. 2016) - may take a few minute to calcaulte
Image
Pre-slew 15.0-350.0 keV image (Event data)
#   RAcent    DECcent   POSerr    Theta     Phi              Peak Cts       SNR   Name
   39.2594    15.1994   0.0148    28.2642    74.6097         1.6979571     13.043 TRIG_00780845

Foreground time interval of the image:
 -0.968  46.648 (delta_t =  47.616 [sec])
Background time interval of the image:
-222.123  -0.968 (delta_t = 221.155 [sec])
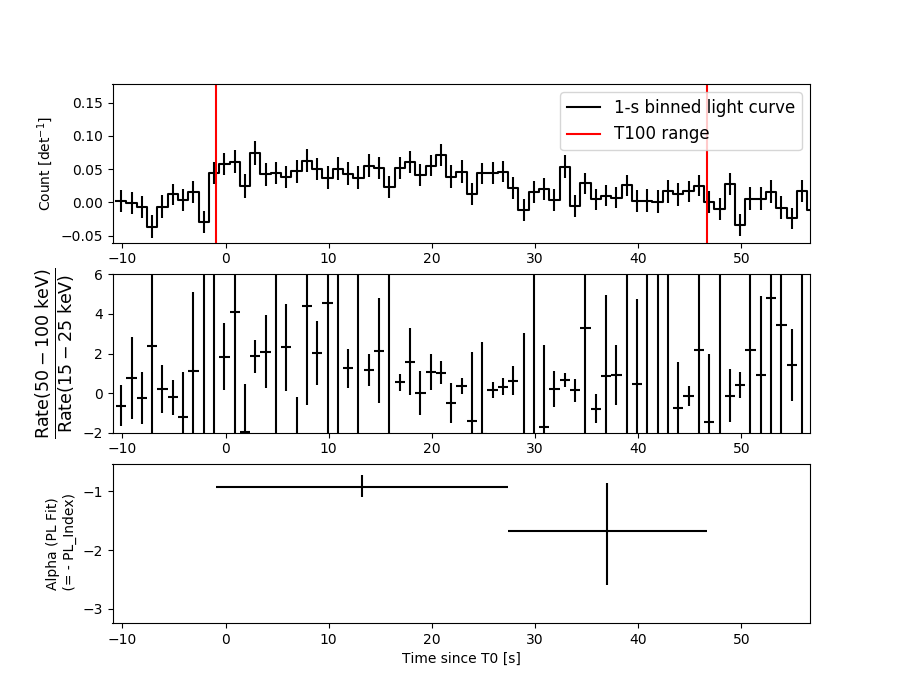
Lightcurves
Notes:
- 1) The mask-weighted light curves are using the flight position.
- 2) Multiple plots of different time binning/intervals are shown to cover all scenarios of short/long GRBs, rate/image triggers, and real/false positives.
- 3) For all the mask-weighted lightcurves, the y-axis units are counts/sec/det where a det is 0.4 x 0.4 = 0.16 sq cm.
- 4) The verticle lines correspond to following: green dotted lines are T50 interval, black dotted lines are T90 interval, blue solid line(s) is a spacecraft slew start time, and orange solid line(s) is a spacecraft slew end time.
- 5) Time of each bin is in the middle of the bin.
1 s binning
From T0-310 s to T0+310 s

From T100_start - 20 s to T100_end + 30 s

Full time interval

64 ms binning
Full time interval
From T100_start to T100_end

From T0-5 sec to T0+5 sec

16 ms binning
From T100_start-5 s to T100_start+5 s

8 ms binning
From T100_start-3 s to T100_start+3 s
2 ms binning
From T100_start-1 s to T100_start+1 s

SN=5 or 10 sec. binning (whichever binning is satisfied first)

SN=5 or 10 sec. binning (T < 200 sec)
Quad-rate summed light curves (from T0-300s to T0+1000s)

Spectral Evolution
Spectra
Notes:
- 1) The fitting includes the systematic errors.
- 2) When the burst includes telescope slew time periods, the fitting uses an average response file made from multiple 5-s response files through out the slew time plus single time preiod for the non-slew times, and weighted by the total counts in the corresponding time period using addrmf. An average response file is needed becuase a spectral fit using the pre-slew DRM will introduce some errors in both a spectral shape and a normalization if the PHA file contains a lot of the slew/post-slew time interval.
- 3) For fits to more complicated models (e.g. a power-law over a cutoff power-law), the BAT team has decided to require a chi-square improvement of more than 6 for each extra dof.
Time averaged spectrum fit using the average DRM
Power-law model

Time interval is from   -0.968 sec. to   46.648 sec.

Spectral model in power-law:
------------------------------------------------------------
Parameters  : value       lower 90%   higher 90%
Photon index: 1.03304     ( -0.207175   0.19824 )
Norm@50keV  : 2.28507E-03    ( -0.000261864   0.000259613 )
------------------------------------------------------------
#Fit statistic : Chi-Squared =          66.61 using 59 PHA bins.
# Reduced chi-squared =          1.169 for     57 degrees of freedom
# Null hypothesis probability =   1.799329e-01

Photon flux (15-150 keV)    in 47.62 sec: 0.263600 ( -0.031096  0.03127 ) ph/cm2/s
Energy fluence (15-150 keV)             : 1.16332e-06 ( -1.35351e-07  1.35892e-07 ) ergs/cm2
Cutoff power-law model

Time interval is from   -0.968 sec. to   46.648 sec.
Spectral model in the cutoff power-law:
------------------------------------------------------------
Parameters  : value       lower 90%   higher 90%
Photon index: 0.844352     ( -0.966446   0.368182 )
Epeak [keV] : 354.479      ( -354.69 -354.69 )
Norm@50keV  : 2.76835E-03    ( -0.000713439   0.00429516 )
------------------------------------------------------------
#Fit statistic : Chi-Squared =          66.46 using 59 PHA bins.
# Reduced chi-squared =          1.187 for     56 degrees of freedom
# Null hypothesis probability =   1.598903e-01

Photon flux (15-150 keV)    in 47.62 sec: 0.261282 ( -0.032862  0.032553 ) ph/cm2/s
Energy fluence (15-150 keV)             : 1.15244e-06 ( -1.46462e-07  1.42587e-07 ) ergs/cm2
Band function

Time interval is from   -0.968 sec. to   46.648 sec.


Spectral model in the Band function:
------------------------------------------------------------
Parameters  : value       lower 90%   higher 90%
alpha       :    (     )
beta        :     (     )
Epeak [keV] :       (   )
Norm@50keV   :     (     )
------------------------------------------------------------

Photon flux (15-150 keV)    in  sec:  (    ) ph/cm2/s
Energy fluence (15-150 keV)             : 0 ( 0  0 ) ergs/cm2
Single BB

Spectral model blackbody:
------------------------------------------------------------
Parameters  : value    Lower 90%  Upper 90%
kT [keV]    : 21.7016  (-3.00693  3.85487)
R^2/D10^2   : 9.65230E-03  (-0.00394094   0.00609029)
(R is the radius in km and D10 is the distance to the source in units of 10 kpc)
------------------------------------------------------------
#Fit statistic : Chi-Squared =          77.00 using 59 PHA bins.
# Reduced chi-squared =          1.351 for     57 degrees of freedom
# Null hypothesis probability =   3.997161e-02

Energy  Fluence     90% Error
[keV]   [erg/cm2]   [erg/cm2]
15- 25  4.031e-08   9.355e-09
25- 50  2.114e-07   3.638e-08
50-150  7.436e-07   1.474e-07
15-150  9.954e-07   1.495e-07
Thermal bremsstrahlung (OTTB)

Spectral model: thermal bremsstrahlung
------------------------------------------------------------
Parameters  : value         Lower 90%    Upper 90%
kT [keV]    : 200.000       (-24.2228      -200)
Norm        : 1.11598       (-0.12833     0.12833)
------------------------------------------------------------
#Fit statistic : Chi-Squared =          85.74 using 59 PHA bins.
# Reduced chi-squared =          1.504 for     57 degrees of freedom
# Null hypothesis probability =   8.221340e-03

Energy  Fluence     90% Error
[keV]   [erg/cm2]   [erg/cm2]
15- 25  1.324e-07   7.433e-08
25- 50  2.547e-07   1.403e-07
50-150  5.585e-07   3.069e-07
15-150  9.455e-07   5.155e-07
Double BB

R1^2/D10^2  : 2.62858E-02        (-0.0156989      1.61642)
kT2 [keV]   : 200.000        (-170.833      -200)
R2^2/D10^2  : 3.92009E-05    (-1.7118e-05   0.000229064)
------------------------------------------------------------
#Fit statistic : Chi-Squared =          69.00 using 59 PHA bins.
#Fit statistic : Chi-Squared =          66.65 using 59 PHA bins.
#Fit statistic : Chi-Squared =          66.30 using 59 PHA bins.
# Reduced chi-squared =          1.255 for     55 degrees of freedom
# Reduced chi-squared =          1.212 for     55 degrees of freedom
# Reduced chi-squared =          1.205 for     55 degrees of freedom
# Null hypothesis probability =   9.704916e-02
# Null hypothesis probability =   1.348398e-01
# Null hypothesis probability =   1.414826e-01

Energy  Fluence     90% Error
[keV]   [erg/cm2]   [erg/cm2]
15- 25  9.023e-08   4.258e-08
25- 50  2.020e-07   6.053e-08
50-150  8.041e-07   2.364e-07
15-150  1.096e-06   2.986e-07
Peak spectrum fit
Power-law model

Time interval is from   19.940 sec. to   20.940 sec.

Spectral model in power-law:
------------------------------------------------------------
Parameters  : value       lower 90%   higher 90%
Photon index: 1.30789     ( -0.492457   0.475409 )
Norm@50keV  : 6.11356E-03    ( -0.00172137   0.00172082 )
------------------------------------------------------------
#Fit statistic : Chi-Squared =          73.82 using 59 PHA bins.
# Reduced chi-squared =          1.295 for     57 degrees of freedom
# Null hypothesis probability =   6.637389e-02

Photon flux (15-150 keV)    in 1 sec: 0.730443 ( -0.212249  0.213786 ) ph/cm2/s
Energy fluence (15-150 keV)             : 6.03045e-08 ( -1.82841e-08  1.86251e-08 ) ergs/cm2
Cutoff power-law model
Time interval is from   19.940 sec. to   20.940 sec.
Spectral model in the cutoff power-law:
------------------------------------------------------------
Parameters  : value       lower 90%   higher 90%
Photon index: 0.116008     ( -3.95522   1.58273 )
Epeak [keV] : 82.7290      ( -59.3761 -82.7281 )
Norm@50keV  : 2.29400E-02    ( -0.022941   1.2592 )
------------------------------------------------------------
#Fit statistic : Chi-Squared =          73.00 using 59 PHA bins.
# Reduced chi-squared =          1.303 for     56 degrees of freedom
# Null hypothesis probability =   6.314319e-02

Photon flux (15-150 keV)    in 1 sec: 0.694741 ( -0.227602  0.225139 ) ph/cm2/s
Energy fluence (15-150 keV)             : 5.59887e-08 ( -1.92562e-08  2.03456e-08 ) ergs/cm2
Band function

Time interval is from   19.940 sec. to   20.940 sec.


Spectral model in the Band function:
------------------------------------------------------------
Parameters  : value       lower 90%   higher 90%
alpha       :    (     )
beta        :     (     )
Epeak [keV] :       (   )
Norm@50keV   :     (     )
------------------------------------------------------------

Photon flux (15-150 keV)    in  sec:  (    ) ph/cm2/s
Energy fluence (15-150 keV)             : 0 ( 0  0 ) ergs/cm2
Single BB

Spectral model blackbody:
------------------------------------------------------------
Parameters  : value    Lower 90%  Upper 90%
kT [keV]    : 17.1315  (-4.49439  7.00645)
R^2/D10^2   : 5.68759E-02  (-0.0568759   0.105834)
(R is the radius in km and D10 is the distance to the source in units of 10 kpc)
------------------------------------------------------------
#Fit statistic : Chi-Squared =          73.67 using 59 PHA bins.
# Reduced chi-squared =          1.293 for     57 degrees of freedom
# Null hypothesis probability =   6.782320e-02

Energy  Fluence     90% Error
[keV]   [erg/cm2]   [erg/cm2]
15- 25  3.392e-09   1.905e-09
25- 50  1.510e-08   9.085e-09
50-150  3.172e-08   1.890e-08
15-150  5.022e-08   2.578e-08
Thermal bremsstrahlung (OTTB)

Spectral model: thermal bremsstrahlung
------------------------------------------------------------
Parameters  : value         Lower 90%    Upper 90%
kT [keV]    : 199.363       (-111.411      -199.363)
Norm        : 3.05902       (-0.866119     0.866119)
------------------------------------------------------------
#Fit statistic : Chi-Squared =          74.22 using 59 PHA bins.
# Reduced chi-squared =          1.302 for     57 degrees of freedom
# Null hypothesis probability =   6.235627e-02

Energy  Fluence     90% Error
[keV]   [erg/cm2]   [erg/cm2]
15- 25  7.617e-09   4.685e-09
25- 50  1.465e-08   8.960e-09
50-150  3.214e-08   1.946e-08
15-150  5.441e-08   3.254e-08
Double BB

Spectral model: bbodyrad<1> + bbodyrad<2>
------------------------------------------------------------
Parameters  : value         Lower 90%    Upper 90%
kT1 [keV]   : 4.20787        (-4.20787      -4.20787)
R1^2/D10^2  : 2.51140        (-2.51343      -2.51343)
kT2 [keV]   : 19.0104        (-5.73577      -19.0101)
R2^2/D10^2  : 3.75053E-02    (-0.037508   0.100423)
------------------------------------------------------------
#Fit statistic : Chi-Squared =          72.90 using 59 PHA bins.
# Reduced chi-squared =          1.325 for     55 degrees of freedom
# Null hypothesis probability =   5.346684e-02

Energy  Fluence     90% Error
[keV]   [erg/cm2]   [erg/cm2]
15- 25  5.568e-09   3.359e-09
25- 50  1.403e-08   8.075e-09
50-150  3.406e-08   2.157e-08
15-150  5.366e-08   3.020e-08
Pre-slew spectrum (Pre-slew PHA with pre-slew DRM)
Power-law model

Spectral model in power-law:
------------------------------------------------------------
Parameters  : value       lower 90%   higher 90%
Photon index: 1.03304     ( -0.207175   0.19824 )
Norm@50keV  : 2.28507E-03    ( -0.000261864   0.000259613 )
------------------------------------------------------------
#Fit statistic : Chi-Squared =          66.61 using 59 PHA bins.
# Reduced chi-squared =          1.169 for     57 degrees of freedom
# Null hypothesis probability =   1.799329e-01

Photon flux (15-150 keV)    in 47.62 sec: 0.263597 ( -0.0310885  0.0312704 ) ph/cm2/s
Energy fluence (15-150 keV)             : 1.16319e-06 ( -1.3531e-07  1.36148e-07 ) ergs/cm2
Cutoff power-law model
Spectral model in the cutoff power-law:
------------------------------------------------------------
Parameters  : value       lower 90%   higher 90%
Photon index: 0.844393     ( -0.966457   0.368171 )
Epeak [keV] : 354.546      ( -354.695 -354.695 )
Norm@50keV  : 2.76823E-03    ( -0.000713436   0.00429517 )
------------------------------------------------------------
#Fit statistic : Chi-Squared =          66.46 using 59 PHA bins.
# Reduced chi-squared =          1.187 for     56 degrees of freedom
# Null hypothesis probability =   1.598903e-01

Photon flux (15-150 keV)    in 47.62 sec: 0.261266 ( -0.032852  0.03267 ) ph/cm2/s
Energy fluence (15-150 keV)             : 1.15295e-06 ( -1.46479e-07  1.42893e-07 ) ergs/cm2
Band function

Spectral model in the Band function:
------------------------------------------------------------
Parameters  : value       lower 90%   higher 90%
alpha       :    (     )
beta        :     (     )
Epeak [keV] :       (   )
Norm@50keV   :     (     )
------------------------------------------------------------

Photon flux (15-150 keV)    in  sec:  (    ) ph/cm2/s
Energy fluence (15-150 keV)             : 0 ( 0  0 ) ergs/cm2
S(25-50 keV) vs. S(50-100 keV) plot
S(25-50 keV)  = 2.20e-07
S(50-100 keV) = 4.30e-07
T90 vs. Hardness ratio plot

T90                                   = 41.8560000061989 sec.
Hardness ratio (energy fluence ratio) = 1.95455
Color vs. Color plot
Count Ratio  (25-50 keV) / (15-25 keV) = 1.32822
Count Ratio (50-100 keV) / (15-25 keV) = 1.60447
Mask shadow pattern

IMX = 1.426852745462230E-01, IMY = -5.183595386081318E-01
TIME vs. PHA plot around the trigger time

TIME vs. DetID plot around the trigger time
100 us light curve (15-350 keV)
Spacecraft aspect plot
Bright source in the pre-burst/pre-slew/post-slew images
Pre-burst image of 15-350 keV band
Time interval of the image:
-222.123400 -0.968000

# RAcent  DECcent POSerr Theta    Phi  PeakCts   SNR AngSep     Name
#  [deg]    [deg]    ['] [deg]  [deg]                   [']
 83.6323  22.0152    0.7  42.6    0.7   8.9216  17.3    0.1	Crab
326.0768  38.3765   27.6  53.5 -173.5   0.4219   0.4    5.5	Cyg X-2
 75.7324   2.1585    2.5  52.6   26.4   8.3757   4.6 ------	UNKNOWN
 40.9161  61.4295    0.2  18.0 -101.9  25.2126  75.4 ------	UNKNOWN
 18.3178  67.2981    2.6  26.3 -122.8   1.6749   4.5 ------	UNKNOWN
Pre-slew background subtracted image of 15-350 keV band
Time interval of the image:
-0.968000 46.648000

# RAcent  DECcent POSerr Theta    Phi  PeakCts   SNR AngSep     Name
#  [deg]    [deg]    ['] [deg]  [deg]                   [']
 83.7957  21.9756    4.4  42.7    0.6  -0.3594  -2.6    9.3	Crab
326.1118  38.4004   15.1  53.5 -173.5  -0.2196  -0.8    5.5	Cyg X-2
354.8875  18.8278    2.8  44.3  145.7   1.0212   4.2 ------	UNKNOWN
 39.2594  15.1994    0.9  28.3   74.6   1.6978  13.0 ------	UNKNOWN
 97.2749  13.2727    2.3  58.0   -2.2   2.8901   5.0 ------	UNKNOWN
 36.6480  62.8086    3.1  19.4 -108.1   0.3653   3.7 ------	UNKNOWN
333.1448  63.4855    2.5  41.6 -142.7   0.7719   4.7 ------	UNKNOWN
Post-slew image of 15-350 keV band
Time interval of the image:
127.076590 962.535500

# RAcent  DECcent POSerr Theta    Phi  PeakCts   SNR AngSep     Name
#  [deg]    [deg]    ['] [deg]  [deg]                   [']
349.2157  45.8783    2.9  51.7  154.7  13.2938   3.9 ------	UNKNOWN
 21.5963 -13.0659    3.2  33.2   50.2   4.3117   3.6 ------	UNKNOWN
 19.1953   3.1815    3.0  23.1   78.3   3.5177   3.9 ------	UNKNOWN
  1.9855  42.5380    3.3  42.0  155.7   5.6344   3.5 ------	UNKNOWN
 40.9557  61.4308    0.3  46.3 -161.3  76.6161  42.8 ------	UNKNOWN
 79.9785 -28.6636    3.3  58.9  -24.4  19.3733   3.5 ------	UNKNOWN
Plot creation:
Sat Jan 20 09:27:09 EST 2018