Special notes of this burst
Image
Pre-slew 15.0-350.0 keV image (Event data)

#   RAcent    DECcent   POSerr    Theta     Phi              Peak Cts       SNR   Name
   61.6825    -2.6003   0.0073    17.7237    37.5020         2.1965366     26.542 TRIG_00783479

Foreground time interval of the image:
 -1.096  37.573 (delta_t =  38.669 [sec])
Background time interval of the image:
-254.627  -1.096 (delta_t = 253.531 [sec])
Lightcurves
Notes:
- 1) The mask-weighted light curves are using the flight position.
- 2) Multiple plots of different time binning/intervals are shown to cover all scenarios of short/long GRBs, rate/image triggers, and real/false positives.
- 3) For all the mask-weighted lightcurves, the y-axis units are counts/sec/det where a det is 0.4 x 0.4 = 0.16 sq cm.
- 4) The verticle lines correspond to following: green dotted lines are T50 interval, black dotted lines are T90 interval, blue solid line(s) is a spacecraft slew start time, and orange solid line(s) is a spacecraft slew end time.
- 5) Time of each bin is in the middle of the bin.
1 s binning
From T0-310 s to T0+310 s
From T100_start - 20 s to T100_end + 30 s
Full time interval

64 ms binning
Full time interval

From T100_start to T100_end
From T0-5 sec to T0+5 sec

16 ms binning
From T100_start-5 s to T100_start+5 s
Blue+Cyan dotted lines: Time interval of the scaled map
From 0.000000 to 4.096000
8 ms binning
From T100_start-3 s to T100_start+3 s

Blue+Cyan dotted lines: Time interval of the scaled map
From 0.000000 to 4.096000
2 ms binning
From T100_start-1 s to T100_start+1 s
Blue+Cyan dotted lines: Time interval of the scaled map
From 0.000000 to 4.096000
SN=5 or 10 sec. binning (whichever binning is satisfied first)
SN=5 or 10 sec. binning (T < 200 sec)
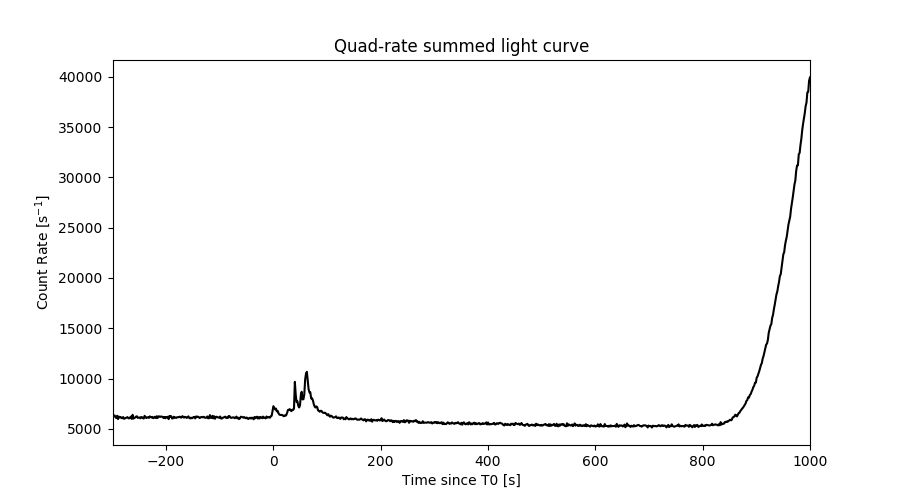
Quad-rate summed light curves (from T0-300s to T0+1000s)
Spectral Evolution

Spectra
Notes:
- 1) The fitting includes the systematic errors.
- 2) When the burst includes telescope slew time periods, the fitting uses an average response file made from multiple 5-s response files through out the slew time plus single time preiod for the non-slew times, and weighted by the total counts in the corresponding time period using addrmf. An average response file is needed becuase a spectral fit using the pre-slew DRM will introduce some errors in both a spectral shape and a normalization if the PHA file contains a lot of the slew/post-slew time interval.
- 3) For fits to more complicated models (e.g. a power-law over a cutoff power-law), the BAT team has decided to require a chi-square improvement of more than 6 for each extra dof.
Time averaged spectrum fit using the average DRM
Power-law model

Time interval is from   -1.096 sec. to  129.984 sec.

Spectral model in power-law:
------------------------------------------------------------
Parameters  : value       lower 90%   higher 90%
Photon index: 1.45896     ( -0.0423226   0.0422959 )
Norm@50keV  : 6.18550E-03    ( -0.000134139   0.000134134 )
------------------------------------------------------------
#Fit statistic : Chi-Squared =          56.86 using 59 PHA bins.
# Reduced chi-squared =         0.9976 for     57 degrees of freedom
# Null hypothesis probability =   4.801383e-01

Photon flux (15-150 keV)    in 131.1 sec: 0.764003 ( -0.018701  0.018762 ) ph/cm2/s
Energy fluence (15-150 keV)             : 7.74823e-06 ( -1.75848e-07  1.761e-07 ) ergs/cm2
Cutoff power-law model

Time interval is from   -1.096 sec. to  129.984 sec.
Spectral model in the cutoff power-law:
------------------------------------------------------------
Parameters  : value       lower 90%   higher 90%
Photon index: 1.30101     ( -0.169422   0.0846607 )
Epeak [keV] : 248.618      ( -99.2454 -248.618 )
Norm@50keV  : 7.27436E-03    ( -0.00097881   0.00133965 )
------------------------------------------------------------
#Fit statistic : Chi-Squared =          54.15 using 59 PHA bins.
# Reduced chi-squared =         0.9669 for     56 degrees of freedom
# Null hypothesis probability =   5.453597e-01

Photon flux (15-150 keV)    in 131.1 sec: 0.754139 ( -0.021063  0.021158 ) ph/cm2/s
Energy fluence (15-150 keV)             : 7.66466e-06 ( -1.95997e-07  1.95346e-07 ) ergs/cm2
Band function

Time interval is from   -1.096 sec. to  129.984 sec.


Spectral model in the Band function:
------------------------------------------------------------
Parameters  : value       lower 90%   higher 90%
alpha       :    (     )
beta        :     (     )
Epeak [keV] :       (   )
Norm@50keV   :     (     )
------------------------------------------------------------

Photon flux (15-150 keV)    in  sec:  (    ) ph/cm2/s
Energy fluence (15-150 keV)             : 0 ( 0  0 ) ergs/cm2
Single BB

Spectral model blackbody:
------------------------------------------------------------
Parameters  : value    Lower 90%  Upper 90%
kT [keV]    : 17.6742  (  )
R^2/D10^2   : 4.73677E-02  (   )
(R is the radius in km and D10 is the distance to the source in units of 10 kpc)
------------------------------------------------------------
#Fit statistic : Chi-Squared =         471.99 using 59 PHA bins.
# Reduced chi-squared =         8.2805 for     57 degrees of freedom
# Null hypothesis probability =   1.145541e-66

Energy  Fluence     90% Error
[keV]   [erg/cm2]   [erg/cm2]
15- 25  3.906e-07   1.855e-08
25- 50  1.782e-06   5.572e-08
50-150  4.020e-06   1.436e-07
15-150  6.193e-06   1.606e-07
Thermal bremsstrahlung (OTTB)

Spectral model: thermal bremsstrahlung
------------------------------------------------------------
Parameters  : value         Lower 90%    Upper 90%
kT [keV]    : 200.000       (-4.73664      -200)
Norm        : 3.16143       (-0.0686633     0.0686633)
------------------------------------------------------------
#Fit statistic : Chi-Squared =          82.24 using 59 PHA bins.
# Reduced chi-squared =          1.443 for     57 degrees of freedom
# Null hypothesis probability =   1.598495e-02

Energy  Fluence     90% Error
[keV]   [erg/cm2]   [erg/cm2]
15- 25  1.032e-06   2.596e-08
25- 50  1.986e-06   5.047e-08
50-150  4.355e-06   1.036e-07
15-150  7.374e-06   1.809e-07
Double BB

Spectral model: bbodyrad<1> + bbodyrad<2>
------------------------------------------------------------
Parameters  : value         Lower 90%    Upper 90%
kT1 [keV]   : 7.36364        (-0.593139      0.636975)
R1^2/D10^2  : 0.623130        (-0.155803      0.220998)
kT2 [keV]   : 28.5069        (-2.02585      2.49416)
R2^2/D10^2  : 7.59401E-03    (-0.00193784   0.00229639)
------------------------------------------------------------
#Fit statistic : Chi-Squared =          51.90 using 59 PHA bins.
# Reduced chi-squared =         0.9435 for     55 degrees of freedom
# Null hypothesis probability =   5.940159e-01

Energy  Fluence     90% Error
[keV]   [erg/cm2]   [erg/cm2]
15- 25  8.783e-07   7.525e-08
25- 50  1.916e-06   7.932e-08
50-150  4.830e-06   2.353e-07
15-150  7.624e-06   2.878e-07
Peak spectrum fit
Power-law model

Time interval is from   62.264 sec. to   63.264 sec.

Spectral model in power-law:
------------------------------------------------------------
Parameters  : value       lower 90%   higher 90%
Photon index: 1.17580     ( -0.098982   0.098407 )
Norm@50keV  : 2.59003E-02    ( -0.0015287   0.0015287 )
------------------------------------------------------------
#Fit statistic : Chi-Squared =          41.89 using 59 PHA bins.
# Reduced chi-squared =         0.7350 for     57 degrees of freedom
# Null hypothesis probability =   9.331281e-01

Photon flux (15-150 keV)    in 1 sec: 3.03022 ( -0.18273  0.18288 ) ph/cm2/s
Energy fluence (15-150 keV)             : 2.64631e-07 ( -1.73561e-08  1.74345e-08 ) ergs/cm2
Cutoff power-law model

Time interval is from   62.264 sec. to   63.264 sec.
Spectral model in the cutoff power-law:
------------------------------------------------------------
Parameters  : value       lower 90%   higher 90%
Photon index: 0.506636     ( -0.470522   0.424246 )
Epeak [keV] : 120.229      ( -29.091 108.757 )
Norm@50keV  : 5.38758E-02    ( -0.0196049   0.0346464 )
------------------------------------------------------------
#Fit statistic : Chi-Squared =          34.28 using 59 PHA bins.
# Reduced chi-squared =         0.6122 for     56 degrees of freedom
# Null hypothesis probability =   9.902392e-01

Photon flux (15-150 keV)    in 1 sec: 2.95890 ( -0.18893  0.18851 ) ph/cm2/s
Energy fluence (15-150 keV)             : 2.54812e-07 ( -1.87914e-08  1.87464e-08 ) ergs/cm2
Band function

Time interval is from   62.264 sec. to   63.264 sec.


Spectral model in the Band function:
------------------------------------------------------------
Parameters  : value       lower 90%   higher 90%
alpha       :    (     )
beta        :     (     )
Epeak [keV] :       (   )
Norm@50keV   :     (     )
------------------------------------------------------------

Photon flux (15-150 keV)    in  sec:  (    ) ph/cm2/s
Energy fluence (15-150 keV)             : 0 ( 0  0 ) ergs/cm2
Single BB

Spectral model blackbody:
------------------------------------------------------------
Parameters  : value    Lower 90%  Upper 90%
kT [keV]    : 18.6852  (-1.32814  1.46157)
R^2/D10^2   : 0.179863  (-0.0397046   0.0498279)
(R is the radius in km and D10 is the distance to the source in units of 10 kpc)
------------------------------------------------------------
#Fit statistic : Chi-Squared =          66.96 using 59 PHA bins.
# Reduced chi-squared =          1.175 for     57 degrees of freedom
# Null hypothesis probability =   1.722616e-01

Energy  Fluence     90% Error
[keV]   [erg/cm2]   [erg/cm2]
15- 25  1.242e-08   1.525e-09
25- 50  5.902e-08   5.315e-09
50-150  1.509e-07   1.565e-08
15-150  2.223e-07   1.580e-08
Thermal bremsstrahlung (OTTB)

Spectral model: thermal bremsstrahlung
------------------------------------------------------------
Parameters  : value         Lower 90%    Upper 90%
kT [keV]    : 200.000       (-10.419      -200)
Norm        : 12.4456       (-0.751181     0.751181)
------------------------------------------------------------
#Fit statistic : Chi-Squared =          75.61 using 59 PHA bins.
# Reduced chi-squared =          1.326 for     57 degrees of freedom
# Null hypothesis probability =   5.014444e-02

Energy  Fluence     90% Error
[keV]   [erg/cm2]   [erg/cm2]
15- 25  3.098e-08   1.935e-09
25- 50  5.960e-08   4.485e-09
50-150  1.307e-07   2.821e-08
15-150  2.213e-07   3.730e-08
Double BB

Spectral model: bbodyrad<1> + bbodyrad<2>
------------------------------------------------------------
Parameters  : value         Lower 90%    Upper 90%
kT1 [keV]   : 7.70452        (-2.2421      3.67387)
R1^2/D10^2  : 1.47829        (-0.920133      2.94004)
kT2 [keV]   : 26.2727        (-4.24081      13.2086)
R2^2/D10^2  : 4.87224E-02    (-0.0376345   0.0346051)
------------------------------------------------------------
#Fit statistic : Chi-Squared =          35.32 using 59 PHA bins.
# Reduced chi-squared =         0.6421 for     55 degrees of freedom
# Null hypothesis probability =   9.820283e-01

Energy  Fluence     90% Error
[keV]   [erg/cm2]   [erg/cm2]
15- 25  2.110e-08   8.384e-09
25- 50  5.830e-08   1.460e-08
50-150  1.736e-07   5.366e-08
15-150  2.530e-07   6.275e-08
Pre-slew spectrum (Pre-slew PHA with pre-slew DRM)
Power-law model

Spectral model in power-law:
------------------------------------------------------------
Parameters  : value       lower 90%   higher 90%
Photon index: 1.17194     ( -0.102886   0.10164 )
Norm@50keV  : 3.51162E-03    ( -0.000203527   0.000203465 )
------------------------------------------------------------
#Fit statistic : Chi-Squared =          50.30 using 59 PHA bins.
# Reduced chi-squared =         0.8825 for     57 degrees of freedom
# Null hypothesis probability =   7.226785e-01

Photon flux (15-150 keV)    in 38.67 sec: 0.410640 ( -0.0246495  0.0246859 ) ph/cm2/s
Energy fluence (15-150 keV)             : 1.38885e-06 ( -8.84066e-08  8.87852e-08 ) ergs/cm2
Cutoff power-law model

Spectral model in the cutoff power-law:
------------------------------------------------------------
Parameters  : value       lower 90%   higher 90%
Photon index: 0.824434     ( -0.428048   0.379369 )
Epeak [keV] : 183.480      ( -72.6597 -183.48 )
Norm@50keV  : 5.11638E-03    ( -0.00166603   0.00288062 )
------------------------------------------------------------
#Fit statistic : Chi-Squared =          47.96 using 59 PHA bins.
# Reduced chi-squared =         0.8565 for     56 degrees of freedom
# Null hypothesis probability =   7.688904e-01

Photon flux (15-150 keV)    in 38.67 sec: 0.404112 ( -0.025723  0.025708 ) ph/cm2/s
Energy fluence (15-150 keV)             : 1.35815e-06 ( -9.65049e-08  9.58823e-08 ) ergs/cm2
Band function

Spectral model in the Band function:
------------------------------------------------------------
Parameters  : value       lower 90%   higher 90%
alpha       :    (     )
beta        :     (     )
Epeak [keV] :       (   )
Norm@50keV   :     (     )
------------------------------------------------------------

Photon flux (15-150 keV)    in  sec:  (    ) ph/cm2/s
Energy fluence (15-150 keV)             : 0 ( 0  0 ) ergs/cm2
S(25-50 keV) vs. S(50-100 keV) plot

S(25-50 keV)  = 1.87e-06
S(50-100 keV) = 2.73e-06
T90 vs. Hardness ratio plot

T90                                   = 96.7719999551773 sec.
Hardness ratio (energy fluence ratio) = 1.45989
Color vs. Color plot

Count Ratio  (25-50 keV) / (15-25 keV) = 1.41829
Count Ratio (50-100 keV) / (15-25 keV) = 1.09808
Mask shadow pattern

IMX = 2.535455495875235E-01, IMY = -1.945664264299750E-01
TIME vs. PHA plot around the trigger time

Blue+Cyan dotted lines: Time interval of the scaled map
From 0.000000 to 4.096000
TIME vs. DetID plot around the trigger time

Blue+Cyan dotted lines: Time interval of the scaled map
From 0.000000 to 4.096000
100 us light curve (15-350 keV)

Blue+Cyan dotted lines: Time interval of the scaled map
From 0.000000 to 4.096000
Spacecraft aspect plot

Bright source in the pre-burst/pre-slew/post-slew images
Pre-burst image of 15-350 keV band
Time interval of the image:
-254.627410 -1.096000

# RAcent  DECcent POSerr Theta    Phi  PeakCts   SNR AngSep     Name
#  [deg]    [deg]    ['] [deg]  [deg]                   [']
 83.6228  22.0181    0.3  17.4  174.9  10.3038  43.6    0.6	Crab
 61.6568   0.9257    2.7  16.4   48.6   1.1159   4.3 ------	UNKNOWN
105.8944  37.6068    2.3  41.1 -169.8   1.9158   4.9 ------	UNKNOWN
Pre-slew background subtracted image of 15-350 keV band
Time interval of the image:
-1.096000 37.572600

# RAcent  DECcent POSerr Theta    Phi  PeakCts   SNR AngSep     Name
#  [deg]    [deg]    ['] [deg]  [deg]                   [']
 83.4838  22.0578   21.3  17.4  174.4   0.0406   0.5    8.7	Crab
 35.8652   7.9023    2.0  41.2   70.6   1.8266   5.7 ------	UNKNOWN
 35.7261   2.9221    1.7  41.6   63.0   1.9527   6.8 ------	UNKNOWN
 38.6004 -36.7457    2.1  55.8   12.4   2.5068   5.5 ------	UNKNOWN
 61.6825  -2.6004    0.4  17.7   37.5   2.1966  26.5 ------	UNKNOWN
 62.3081 -48.3345    2.0  55.6  -12.9   1.5611   5.7 ------	UNKNOWN
Post-slew image of 15-350 keV band
Time interval of the image:
76.572590 962.531700

# RAcent  DECcent POSerr Theta    Phi  PeakCts   SNR AngSep     Name
#  [deg]    [deg]    ['] [deg]  [deg]                   [']
 83.6155  22.0231    0.2  32.7 -168.2  30.2487  52.2    1.1	Crab
 27.3476  20.3242    2.4  40.7   97.7   9.5653   4.9 ------	UNKNOWN
 61.1391  46.3811    2.9  49.0  151.4   8.2866   4.0 ------	UNKNOWN
 61.6526  -2.6051    1.5   0.0   82.5   4.0119   7.9 ------	UNKNOWN
 78.1239  -3.2216    3.3  16.4 -115.6   1.9024   3.5 ------	UNKNOWN
112.0216  27.9501    3.0  57.2 -154.1  14.5080   3.9 ------	UNKNOWN
100.6154 -12.6706    4.2  39.8 -101.4   6.7954   2.8 ------	UNKNOWN
Plot creation:
Sat Jan 20 11:09:44 EST 2018