Estimated redshift from machine learning (Ukwatta et al. 2016) - may take a few minute to calcaulte
Image
Pre-slew 15.0-350.0 keV image (Event data)

#   RAcent    DECcent   POSerr    Theta     Phi              Peak Cts       SNR   Name
  288.1049    22.4392   0.0183    37.0280    59.3346         1.3675421     10.529 TRIG_00785510

Foreground time interval of the image:
 -5.368  15.416 (delta_t =  20.784 [sec])
Background time interval of the image:
-182.035  -5.368 (delta_t = 176.667 [sec])
Lightcurves
Notes:
- 1) The mask-weighted light curves are using the flight position.
- 2) Multiple plots of different time binning/intervals are shown to cover all scenarios of short/long GRBs, rate/image triggers, and real/false positives.
- 3) For all the mask-weighted lightcurves, the y-axis units are counts/sec/det where a det is 0.4 x 0.4 = 0.16 sq cm.
- 4) The verticle lines correspond to following: green dotted lines are T50 interval, black dotted lines are T90 interval, blue solid line(s) is a spacecraft slew start time, and orange solid line(s) is a spacecraft slew end time.
- 5) Time of each bin is in the middle of the bin.
1 s binning
From T0-310 s to T0+310 s

From T100_start - 20 s to T100_end + 30 s

Full time interval

64 ms binning
Full time interval

From T100_start to T100_end

From T0-5 sec to T0+5 sec

16 ms binning
From T100_start-5 s to T100_start+5 s

Blue+Cyan dotted lines: Time interval of the scaled map
From 0.000000 to 8.192000
8 ms binning
From T100_start-3 s to T100_start+3 s

Blue+Cyan dotted lines: Time interval of the scaled map
From 0.000000 to 8.192000
2 ms binning
From T100_start-1 s to T100_start+1 s

Blue+Cyan dotted lines: Time interval of the scaled map
From 0.000000 to 8.192000
SN=5 or 10 sec. binning (whichever binning is satisfied first)

SN=5 or 10 sec. binning (T < 200 sec)

Quad-rate summed light curves (from T0-300s to T0+1000s)

Spectral Evolution

Spectra
Notes:
- 1) The fitting includes the systematic errors.
- 2) When the burst includes telescope slew time periods, the fitting uses an average response file made from multiple 5-s response files through out the slew time plus single time preiod for the non-slew times, and weighted by the total counts in the corresponding time period using addrmf. An average response file is needed becuase a spectral fit using the pre-slew DRM will introduce some errors in both a spectral shape and a normalization if the PHA file contains a lot of the slew/post-slew time interval.
- 3) For fits to more complicated models (e.g. a power-law over a cutoff power-law), the BAT team has decided to require a chi-square improvement of more than 6 for each extra dof.
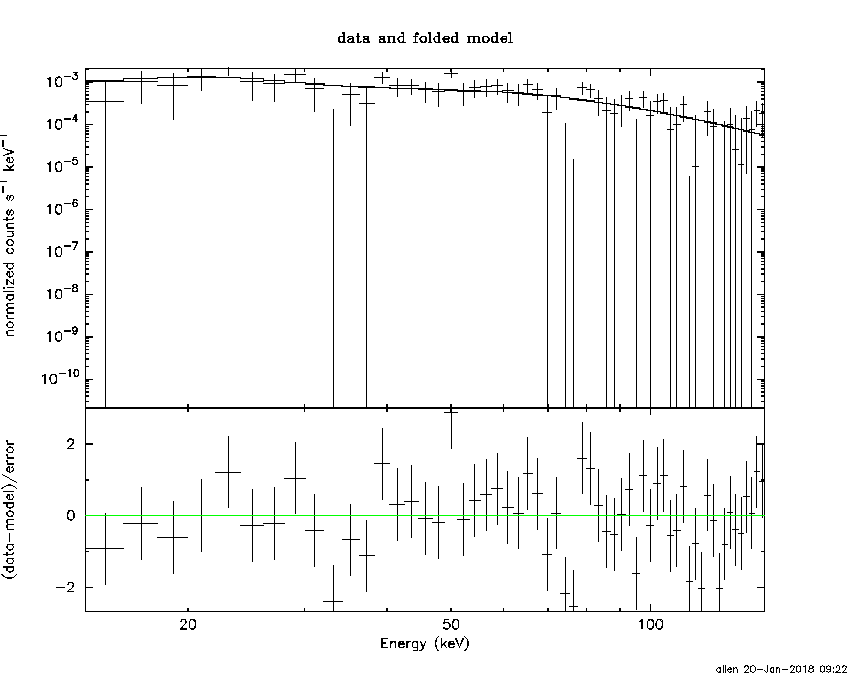
Time averaged spectrum fit using the average DRM
Power-law model

Time interval is from   -5.368 sec. to   15.416 sec.

Spectral model in power-law:
------------------------------------------------------------
Parameters  : value       lower 90%   higher 90%
Photon index: 1.15365     ( -0.251762   0.242135 )
Norm@50keV  : 4.40534E-03    ( -0.000632526   0.000630181 )
------------------------------------------------------------
#Fit statistic : Chi-Squared =          66.56 using 59 PHA bins.
# Reduced chi-squared =          1.168 for     57 degrees of freedom
# Null hypothesis probability =   1.810181e-01

Photon flux (15-150 keV)    in 20.78 sec: 0.513979 ( -0.077253  0.077864 ) ph/cm2/s
Energy fluence (15-150 keV)             : 9.41446e-07 ( -1.40422e-07  1.41272e-07 ) ergs/cm2
Cutoff power-law model

Time interval is from   -5.368 sec. to   15.416 sec.
Spectral model in the cutoff power-law:
------------------------------------------------------------
Parameters  : value       lower 90%   higher 90%
Photon index: 0.170558     ( -1.5133   1.06463 )
Epeak [keV] : 105.140      ( -31.6702 -104.967 )
Norm@50keV  : 1.20823E-02    ( -0.0121288   0.0397462 )
------------------------------------------------------------
#Fit statistic : Chi-Squared =          64.26 using 59 PHA bins.
# Reduced chi-squared =          1.147 for     56 degrees of freedom
# Null hypothesis probability =   2.097378e-01

Photon flux (15-150 keV)    in 20.78 sec: 0.488626 ( -0.083261  0.083144 ) ph/cm2/s
Energy fluence (15-150 keV)             : 8.92042e-07 ( -1.55164e-07  1.53871e-07 ) ergs/cm2
Band function

Time interval is from   -5.368 sec. to   15.416 sec.


Spectral model in the Band function:
------------------------------------------------------------
Parameters  : value       lower 90%   higher 90%
alpha       :    (     )
beta        :     (     )
Epeak [keV] :       (   )
Norm@50keV   :     (     )
------------------------------------------------------------

Photon flux (15-150 keV)    in  sec:  (    ) ph/cm2/s
Energy fluence (15-150 keV)             : 0 ( 0  0 ) ergs/cm2
Single BB

Spectral model blackbody:
------------------------------------------------------------
Parameters  : value    Lower 90%  Upper 90%
kT [keV]    : 19.7905  (-3.0478  3.92985)
R^2/D10^2   : 2.51211E-02  (-0.011382   0.0190663)
(R is the radius in km and D10 is the distance to the source in units of 10 kpc)
------------------------------------------------------------
#Fit statistic : Chi-Squared =          67.18 using 59 PHA bins.
# Reduced chi-squared =          1.179 for     57 degrees of freedom
# Null hypothesis probability =   1.675899e-01

Energy  Fluence     90% Error
[keV]   [erg/cm2]   [erg/cm2]
15- 25  3.958e-08   1.057e-08
25- 50  1.958e-07   5.214e-08
50-150  5.675e-07   1.450e-07
15-150  8.029e-07   1.753e-07
Thermal bremsstrahlung (OTTB)

Spectral model: thermal bremsstrahlung
------------------------------------------------------------
Parameters  : value         Lower 90%    Upper 90%
kT [keV]    : 200.000       (-42.044      -200)
Norm        : 2.18562       (-0.316705     0.316705)
------------------------------------------------------------
#Fit statistic : Chi-Squared =          73.12 using 59 PHA bins.
# Reduced chi-squared =          1.283 for     57 degrees of freedom
# Null hypothesis probability =   7.379433e-02

Energy  Fluence     90% Error
[keV]   [erg/cm2]   [erg/cm2]
15- 25  1.132e-07   6.342e-08
25- 50  2.177e-07   1.220e-07
50-150  4.774e-07   2.682e-07
15-150  8.083e-07   4.556e-07
Double BB

Spectral model: bbodyrad<1> + bbodyrad<2>
------------------------------------------------------------
Parameters  : value         Lower 90%    Upper 90%
kT1 [keV]   : 5.10134        (-4.08209      -5.11509)
R1^2/D10^2  : 0.779586        (-0.769831      394.464)
kT2 [keV]   : 22.3618        (-4.36188      -22.3665)
R2^2/D10^2  : 1.58106E-02    (-0.0157765   0.0143898)
------------------------------------------------------------
#Fit statistic : Chi-Squared =          64.30 using 59 PHA bins.
# Reduced chi-squared =          1.169 for     55 degrees of freedom
# Null hypothesis probability =   1.830277e-01

Energy  Fluence     90% Error
[keV]   [erg/cm2]   [erg/cm2]
15- 25  7.284e-08   3.877e-08
25- 50  1.904e-07   7.665e-08
50-150  6.033e-07   2.387e-07
15-150  8.665e-07   3.805e-07
Peak spectrum fit
Power-law model

Time interval is from    3.500 sec. to    4.500 sec.

Spectral model in power-law:
------------------------------------------------------------
Parameters  : value       lower 90%   higher 90%
Photon index: 1.54097     ( -0.568855   0.579311 )
Norm@50keV  : 9.25596E-03    ( -0.00302745   0.00296515 )
------------------------------------------------------------
#Fit statistic : Chi-Squared =          45.56 using 59 PHA bins.
# Reduced chi-squared =         0.7993 for     57 degrees of freedom
# Null hypothesis probability =   8.619633e-01

Photon flux (15-150 keV)    in 1 sec: 1.16874 ( -0.375692  0.3785 ) ph/cm2/s
Energy fluence (15-150 keV)             : 8.7263e-08 ( -2.9961e-08  3.09159e-08 ) ergs/cm2
Cutoff power-law model

Time interval is from    3.500 sec. to    4.500 sec.
Spectral model in the cutoff power-law:
------------------------------------------------------------
Parameters  : value       lower 90%   higher 90%
Photon index: 0.912544     ( -3.59703   1.27385 )
Epeak [keV] : 85.8513      ( -85.85 -85.85 )
Norm@50keV  : 1.92365E-02    ( -0.0192371   0.930107 )
------------------------------------------------------------
#Fit statistic : Chi-Squared =          45.32 using 59 PHA bins.
# Reduced chi-squared =         0.8093 for     56 degrees of freedom
# Null hypothesis probability =   8.454751e-01

Photon flux (15-150 keV)    in 1 sec: 1.13268 ( -0.405042  0.39749 ) ph/cm2/s
Energy fluence (15-150 keV)             : 8.30462e-08 ( -3.19169e-08  3.36912e-08 ) ergs/cm2
Band function

Time interval is from    3.500 sec. to    4.500 sec.


Spectral model in the Band function:
------------------------------------------------------------
Parameters  : value       lower 90%   higher 90%
alpha       :    (     )
beta        :     (     )
Epeak [keV] :       (   )
Norm@50keV   :     (     )
------------------------------------------------------------

Photon flux (15-150 keV)    in  sec:  (    ) ph/cm2/s
Energy fluence (15-150 keV)             : 0 ( 0  0 ) ergs/cm2
Single BB

Spectral model blackbody:
------------------------------------------------------------
Parameters  : value    Lower 90%  Upper 90%
kT [keV]    : 15.1672  (-4.83776  7.91284)
R^2/D10^2   : 0.125712  (-0.125664   0.373914)
(R is the radius in km and D10 is the distance to the source in units of 10 kpc)
------------------------------------------------------------
#Fit statistic : Chi-Squared =          46.84 using 59 PHA bins.
# Reduced chi-squared =         0.8218 for     57 degrees of freedom
# Null hypothesis probability =   8.292762e-01

Energy  Fluence     90% Error
[keV]   [erg/cm2]   [erg/cm2]
15- 25  6.043e-09   3.898e-09
25- 50  2.426e-08   1.499e-08
50-150  3.816e-08   2.700e-08
15-150  6.846e-08   4.140e-08
Thermal bremsstrahlung (OTTB)

Spectral model: thermal bremsstrahlung
------------------------------------------------------------
Parameters  : value         Lower 90%    Upper 90%
kT [keV]    : 199.331       (-199.333      -199.333)
Norm        : 4.77091       (-1.48823     2.24114)
------------------------------------------------------------
#Fit statistic : Chi-Squared =          45.39 using 59 PHA bins.
# Reduced chi-squared =         0.7963 for     57 degrees of freedom
# Null hypothesis probability =   8.660620e-01

Energy  Fluence     90% Error
[keV]   [erg/cm2]   [erg/cm2]
15- 25  1.188e-08   7.215e-09
25- 50  2.285e-08   1.430e-08
50-150  5.012e-08   3.062e-08
15-150  8.485e-08   5.165e-08
Double BB

Spectral model: bbodyrad<1> + bbodyrad<2>
------------------------------------------------------------
Parameters  : value         Lower 90%    Upper 90%
kT1 [keV]   : 4.67282        (-4.69404      124.232)
R1^2/D10^2  : 4.59320        (-4.55609      -4.55609)
kT2 [keV]   : 19.2014        (-7.38275      -19.2184)
R2^2/D10^2  : 4.86317E-02    (-0.0484647   0.235962)
------------------------------------------------------------
#Fit statistic : Chi-Squared =          45.01 using 59 PHA bins.
# Reduced chi-squared =         0.8184 for     55 degrees of freedom
# Null hypothesis probability =   8.295490e-01

Energy  Fluence     90% Error
[keV]   [erg/cm2]   [erg/cm2]
15- 25  1.196e-08   7.700e-09
25- 50  2.167e-08   1.176e-08
50-150  4.632e-08   3.045e-08
15-150  7.995e-08   4.535e-08
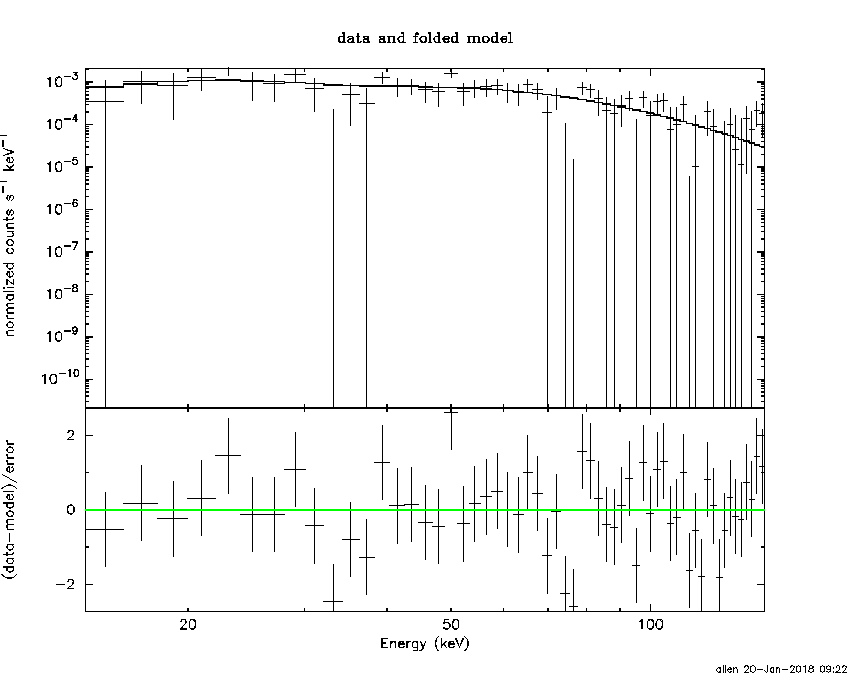
Pre-slew spectrum (Pre-slew PHA with pre-slew DRM)
Power-law model
Spectral model in power-law:
------------------------------------------------------------
Parameters  : value       lower 90%   higher 90%
Photon index: 1.15365     ( -0.251762   0.242135 )
Norm@50keV  : 4.40534E-03    ( -0.000632526   0.000630181 )
------------------------------------------------------------
#Fit statistic : Chi-Squared =          66.56 using 59 PHA bins.
# Reduced chi-squared =          1.168 for     57 degrees of freedom
# Null hypothesis probability =   1.810181e-01

Photon flux (15-150 keV)    in 20.78 sec: 0.513977 ( -0.0772479  0.0778609 ) ph/cm2/s
Energy fluence (15-150 keV)             : 9.4134e-07 ( -1.40398e-07  1.41314e-07 ) ergs/cm2
Cutoff power-law model
Spectral model in the cutoff power-law:
------------------------------------------------------------
Parameters  : value       lower 90%   higher 90%
Photon index: 0.166740     ( -1.51268   1.06527 )
Epeak [keV] : 104.962      ( -33.0339 -104.962 )
Norm@50keV  : 1.21289E-02    ( -0.012129   0.0397462 )
------------------------------------------------------------
#Fit statistic : Chi-Squared =          64.26 using 59 PHA bins.
# Reduced chi-squared =          1.147 for     56 degrees of freedom
# Null hypothesis probability =   2.097385e-01

Photon flux (15-150 keV)    in 20.78 sec: 0.488608 ( -0.083248  0.083128 ) ph/cm2/s
Energy fluence (15-150 keV)             : 8.92445e-07 ( -1.55229e-07  1.54061e-07 ) ergs/cm2
Band function

Spectral model in the Band function:
------------------------------------------------------------
Parameters  : value       lower 90%   higher 90%
alpha       :    (     )
beta        :     (     )
Epeak [keV] :       (   )
Norm@50keV   :     (     )
------------------------------------------------------------

Photon flux (15-150 keV)    in  sec:  (    ) ph/cm2/s
Energy fluence (15-150 keV)             : 0 ( 0  0 ) ergs/cm2
S(25-50 keV) vs. S(50-100 keV) plot

S(25-50 keV)  = 1.92e-07
S(50-100 keV) = 3.45e-07
T90 vs. Hardness ratio plot

T90                                   = 18.8800000548363 sec.
Hardness ratio (energy fluence ratio) = 1.79688
Color vs. Color plot

Count Ratio  (25-50 keV) / (15-25 keV) = 1.53874
Count Ratio (50-100 keV) / (15-25 keV) = 1.90734
Mask shadow pattern

IMX = 3.847212005876110E-01, IMY = -6.488364265045372E-01
TIME vs. PHA plot around the trigger time
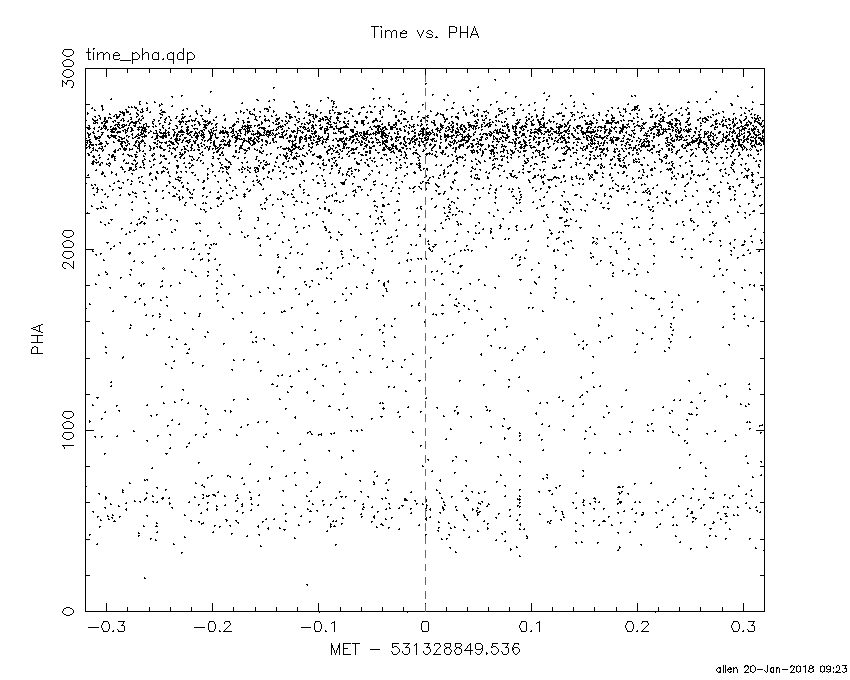
Blue+Cyan dotted lines: Time interval of the scaled map
From 0.000000 to 8.192000
TIME vs. DetID plot around the trigger time

Blue+Cyan dotted lines: Time interval of the scaled map
From 0.000000 to 8.192000
100 us light curve (15-350 keV)

Blue+Cyan dotted lines: Time interval of the scaled map
From 0.000000 to 8.192000
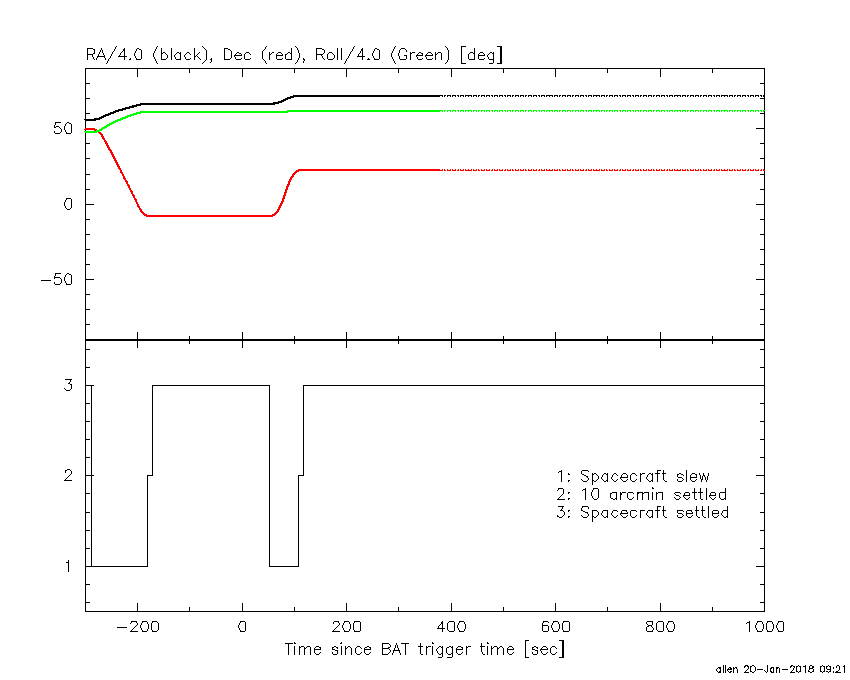
Spacecraft aspect plot
Bright source in the pre-burst/pre-slew/post-slew images
Pre-burst image of 15-350 keV band
Time interval of the image:
-182.035410 -5.368000

# RAcent  DECcent POSerr Theta    Phi  PeakCts   SNR AngSep     Name
#  [deg]    [deg]    ['] [deg]  [deg]                   [']
244.9901 -15.6410    0.3  22.3  -87.8   8.7011  34.2    0.6	Sco X-1
254.3019  35.3413    5.0  44.7   10.6  -0.8812  -2.3    7.6	Her X-1
255.9445 -37.9124    3.3  31.5 -139.5   0.9215   3.5    4.6	4U 1700-377
256.4488 -36.5680    5.2  30.1 -139.4  -0.5587  -2.2    8.7	GX 349+2
262.9900 -24.7346    2.7  17.2 -145.0   0.8363   4.3    1.2	GX 1+4
264.7446 -44.5321    7.7  36.7 -153.4  -0.4528  -1.5    4.9	4U 1735-44
268.3754  -1.4641   48.3   6.7   42.3  -0.0476  -0.2    0.8	SW J1753.5-0127
270.0701 -25.0049    4.7  17.5 -166.6   0.4594   2.4   12.5	GX 5-1
270.2978 -25.8283    4.2  18.4 -166.7   0.5232   2.8    5.1	GRS 1758-258
274.0512 -13.9681    5.6   9.7  154.3   0.4105   2.1    4.9	GX 17+2
276.0183 -30.3240    3.3  24.2 -176.0   0.7586   3.5    5.5	H1820-303
284.9527 -25.0712    7.9  24.7  161.0  -0.3347  -1.5   10.1	HT1900.1-2455
288.8014  10.9784    3.1  29.2   74.9   1.2550   3.7    2.0	GRS 1915+105
263.1182 -33.7723   36.8  26.1 -149.2   0.0731   0.3    7.4	GX 354-0
307.3261  -3.4660    2.8  41.0  110.9   3.4020   4.0 ------	UNKNOWN
258.1007  30.9227    2.8  39.6   13.5   1.2128   4.1 ------	UNKNOWN
234.1222 -43.1627    2.1  45.2 -122.1   4.7531   5.6 ------	UNKNOWN
Pre-slew background subtracted image of 15-350 keV band
Time interval of the image:
-5.368000 15.416000

# RAcent  DECcent POSerr Theta    Phi  PeakCts   SNR AngSep     Name
#  [deg]    [deg]    ['] [deg]  [deg]                   [']
245.1098 -15.6977    4.1  22.2  -88.0  -0.2051  -2.8    8.3	Sco X-1
254.4264  35.3476   15.9  44.6   10.8   0.0780   0.7    1.6	Her X-1
256.1557 -37.9526    5.2  31.5 -139.8  -0.1744  -2.2   10.3	4U 1700-377
256.4465 -36.4435   18.6  30.0 -139.3   0.0476   0.6    1.3	GX 349+2
262.7921 -24.6671    0.0  17.2 -144.3   0.0927   1.6   12.7	GX 1+4
264.4720 -44.3641    0.0  36.6 -153.1  -0.1365  -1.6   12.7	4U 1735-44
268.1689  -1.3793    0.0   6.7   40.4   0.0580   1.0   12.7	SW J1753.5-0127
270.2242 -24.9393   23.8  17.5 -167.1  -0.0270  -0.5    9.0	GX 5-1
270.3208 -25.5699    5.9  18.1 -166.9   0.1076   1.9   10.4	GRS 1758-258
273.8654 -13.9722    6.6   9.6  155.0   0.1038   1.8    9.0	GX 17+2
275.8354 -30.3349    6.7  24.2 -175.7   0.1085   1.7    5.0	H1820-303
284.8304 -24.8646    4.1  24.5  160.8   0.1780   2.8   11.7	HT1900.1-2455
288.5985  11.0092    0.0  29.1   74.5  -0.0183  -0.2   12.4	GRS 1915+105
262.8068 -33.8417   15.7  26.2 -148.7  -0.0481  -0.7    9.1	GX 354-0
288.1049  22.4392    1.1  37.0   59.3   1.3682  10.5 ------	UNKNOWN
277.1990  -5.3365    2.2  11.1  102.2   0.2950   5.4 ------	UNKNOWN
279.5268 -46.4597    2.1  40.2 -169.4   0.4959   5.5 ------	UNKNOWN
231.7320  29.6788    2.7  50.1  -15.3   0.5220   4.3 ------	UNKNOWN
Post-slew image of 15-350 keV band
Time interval of the image:
107.964600 962.545500

# RAcent  DECcent POSerr Theta    Phi  PeakCts   SNR AngSep     Name
#  [deg]    [deg]    ['] [deg]  [deg]                   [']
254.5300  35.4317    6.9  31.9  -36.4  -1.1565  -1.7    6.4	Her X-1
268.3153  -1.4283   11.3  30.7 -116.5   0.8999   1.0    3.5	SW J1753.5-0127
270.1375 -25.1042   11.3  50.6 -136.9   3.0611   1.0    8.1	GX 5-1
270.2101 -25.6271    6.5  51.1 -137.2   5.6420   1.8    8.6	GRS 1758-258
274.0065 -14.0698   32.7  39.0 -136.0  -0.3681  -0.4    2.0	GX 17+2
275.9340 -30.3684    7.6  54.1 -145.1   5.3929   1.5    0.5	H1820-303
284.9328 -24.9393    5.7  47.5 -154.1  -2.7873  -2.0    5.7	HT1900.1-2455
288.7900  10.9726    1.4  11.5 -161.6   4.7206   8.5    1.7	GRS 1915+105
299.5901  35.1845    2.0  16.2   57.7   3.2342   5.7    1.0	Cyg X-1
308.1272  40.9488    1.1  25.1   59.7   7.5845  10.7    0.8	Cyg X-3
325.9847  38.4321    9.2  36.1   76.9   1.8253   1.3   11.0	Cyg X-2
325.3514  61.2894    4.2  46.5   45.6   6.5011   2.7 ------	UNKNOWN
294.8354  44.5879    2.5  22.8   34.5   2.6594   4.7 ------	UNKNOWN
305.8022 -30.5131    4.1  55.6 -176.5   7.0601   2.9 ------	UNKNOWN
278.9541  -2.2290    2.7  26.2 -137.0   2.5991   4.3 ------	UNKNOWN
284.0534 -34.6714    3.7  57.2 -154.1  11.3516   3.1 ------	UNKNOWN
Plot creation:
Sat Jan 20 09:23:21 EST 2018