Estimated redshift from machine learning (Ukwatta et al. 2016) - may take a few minute to calcaulte
Image
Pre-slew 15.0-350.0 keV image (Event data)

#   RAcent    DECcent   POSerr    Theta     Phi              Peak Cts       SNR   Name
  163.7746    22.4607   0.0085    55.1704   -10.6579         5.1845359     22.785 TRIG_00791201

Foreground time interval of the image:
-15.528   9.173 (delta_t =  24.701 [sec])
Background time interval of the image:
-239.528 -15.528 (delta_t = 224.000 [sec])
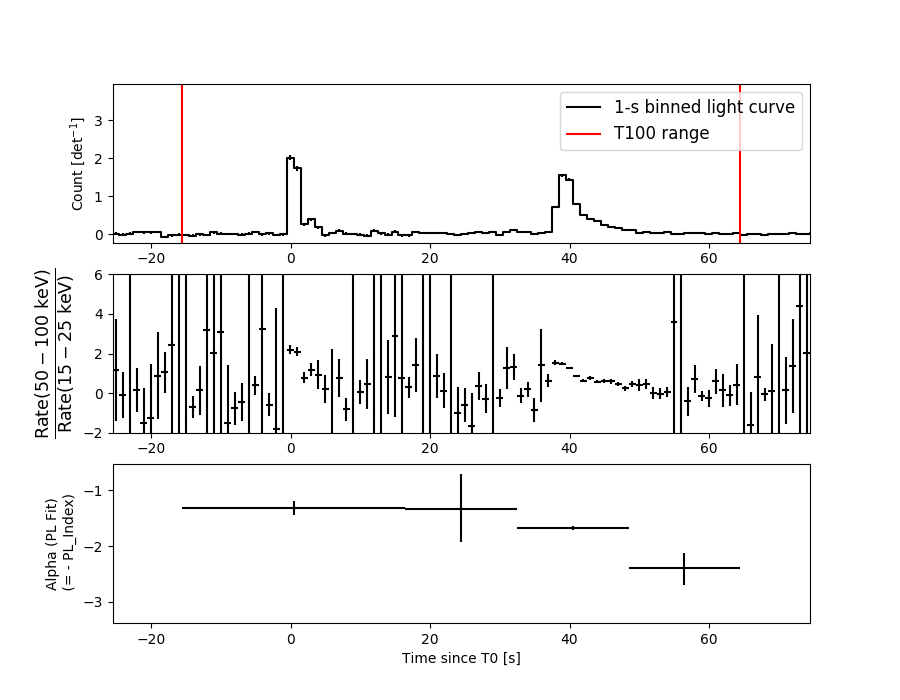
Lightcurves
Notes:
- 1) The mask-weighted light curves are using the flight position.
- 2) Multiple plots of different time binning/intervals are shown to cover all scenarios of short/long GRBs, rate/image triggers, and real/false positives.
- 3) For all the mask-weighted lightcurves, the y-axis units are counts/sec/det where a det is 0.4 x 0.4 = 0.16 sq cm.
- 4) The verticle lines correspond to following: green dotted lines are T50 interval, black dotted lines are T90 interval, blue solid line(s) is a spacecraft slew start time, and orange solid line(s) is a spacecraft slew end time.
- 5) Time of each bin is in the middle of the bin.
1 s binning
From T0-310 s to T0+310 s

From T100_start - 20 s to T100_end + 30 s

Full time interval
64 ms binning
Full time interval
From T100_start to T100_end

From T0-5 sec to T0+5 sec
16 ms binning
From T100_start-5 s to T100_start+5 s

Blue+Cyan dotted lines: Time interval of the scaled map
From 0.000000 to 0.256000
8 ms binning
From T100_start-3 s to T100_start+3 s

Blue+Cyan dotted lines: Time interval of the scaled map
From 0.000000 to 0.256000
2 ms binning
From T100_start-1 s to T100_start+1 s
Blue+Cyan dotted lines: Time interval of the scaled map
From 0.000000 to 0.256000
SN=5 or 10 sec. binning (whichever binning is satisfied first)

SN=5 or 10 sec. binning (T < 200 sec)

Quad-rate summed light curves (from T0-300s to T0+1000s)

Spectral Evolution
Spectra
Notes:
- 1) The fitting includes the systematic errors.
- 2) When the burst includes telescope slew time periods, the fitting uses an average response file made from multiple 5-s response files through out the slew time plus single time preiod for the non-slew times, and weighted by the total counts in the corresponding time period using addrmf. An average response file is needed becuase a spectral fit using the pre-slew DRM will introduce some errors in both a spectral shape and a normalization if the PHA file contains a lot of the slew/post-slew time interval.
- 3) For fits to more complicated models (e.g. a power-law over a cutoff power-law), the BAT team has decided to require a chi-square improvement of more than 6 for each extra dof.
Time averaged spectrum fit using the average DRM
Power-law model

Time interval is from  -15.528 sec. to   64.472 sec.

Spectral model in power-law:
------------------------------------------------------------
Parameters  : value       lower 90%   higher 90%
Photon index: 1.52763     ( -0.063741   0.0638722 )
Norm@50keV  : 1.09966E-02    ( -0.000393015   0.000392946 )
------------------------------------------------------------
#Fit statistic : Chi-Squared =          62.80 using 59 PHA bins.
# Reduced chi-squared =          1.102 for     57 degrees of freedom
# Null hypothesis probability =   2.782439e-01

Photon flux (15-150 keV)    in 80 sec: 1.38330 ( -0.05361  0.05377 ) ph/cm2/s
Energy fluence (15-150 keV)             : 8.3104e-06 ( -3.12794e-07  3.13227e-07 ) ergs/cm2
Cutoff power-law model

Time interval is from  -15.528 sec. to   64.472 sec.
Spectral model in the cutoff power-law:
------------------------------------------------------------
Parameters  : value       lower 90%   higher 90%
Photon index: 1.07523     ( -0.275825   0.259889 )
Epeak [keV] : 111.630      ( -23.0752 73.9955 )
Norm@50keV  : 1.78340E-02    ( -0.0042207   0.00591566 )
------------------------------------------------------------
#Fit statistic : Chi-Squared =          53.60 using 59 PHA bins.
# Reduced chi-squared =         0.9572 for     56 degrees of freedom
# Null hypothesis probability =   5.661448e-01

Photon flux (15-150 keV)    in 80 sec: 1.34493 ( -0.0574  0.05767 ) ph/cm2/s
Energy fluence (15-150 keV)             : 8.10736e-06 ( -3.36484e-07  3.35702e-07 ) ergs/cm2
Band function

Time interval is from  -15.528 sec. to   64.472 sec.


Spectral model in the Band function:
------------------------------------------------------------
Parameters  : value       lower 90%   higher 90%
alpha       :    (     )
beta        :     (     )
Epeak [keV] :       (   )
Norm@50keV   :     (     )
------------------------------------------------------------

Photon flux (15-150 keV)    in  sec:  (    ) ph/cm2/s
Energy fluence (15-150 keV)             : 0 ( 0  0 ) ergs/cm2
Single BB

Spectral model blackbody:
------------------------------------------------------------
Parameters  : value    Lower 90%  Upper 90%
kT [keV]    : 16.5358  (  )
R^2/D10^2   : 0.109812  (   )
(R is the radius in km and D10 is the distance to the source in units of 10 kpc)
------------------------------------------------------------
#Fit statistic : Chi-Squared =         195.15 using 59 PHA bins.
# Reduced chi-squared =         3.4237 for     57 degrees of freedom
# Null hypothesis probability =   5.162189e-17

Energy  Fluence     90% Error
[keV]   [erg/cm2]   [erg/cm2]
15- 25  4.928e-07   3.720e-08
25- 50  2.132e-06   9.920e-08
50-150  4.124e-06   2.596e-07
15-150  6.748e-06   2.708e-07
Thermal bremsstrahlung (OTTB)

Spectral model: thermal bremsstrahlung
------------------------------------------------------------
Parameters  : value         Lower 90%    Upper 90%
kT [keV]    : 200.000       (-18.9996      -200)
Norm        : 5.66616       (-0.201694     0.201694)
------------------------------------------------------------
#Fit statistic : Chi-Squared =          56.67 using 59 PHA bins.
# Reduced chi-squared =         0.9943 for     57 degrees of freedom
# Null hypothesis probability =   4.873132e-01

Energy  Fluence     90% Error
[keV]   [erg/cm2]   [erg/cm2]
15- 25  1.129e-06   4.720e-08
25- 50  2.172e-06   8.320e-08
50-150  4.763e-06   1.872e-07
15-150  8.063e-06   3.164e-07
Double BB

Spectral model: bbodyrad<1> + bbodyrad<2>
------------------------------------------------------------
Parameters  : value         Lower 90%    Upper 90%
kT1 [keV]   : 6.88937        (-1.01996      1.13595)
R1^2/D10^2  : 1.36640        (-0.549454      1.07823)
kT2 [keV]   : 24.7113        (-2.44015      3.31642)
R2^2/D10^2  : 2.17393E-02    (-0.00833098   0.0108194)
------------------------------------------------------------
#Fit statistic : Chi-Squared =          55.04 using 59 PHA bins.
# Reduced chi-squared =          1.001 for     55 degrees of freedom
# Null hypothesis probability =   4.731574e-01

Energy  Fluence     90% Error
[keV]   [erg/cm2]   [erg/cm2]
15- 25  1.005e-06   1.594e-07
25- 50  2.135e-06   2.028e-07
50-150  4.918e-06   4.940e-07
15-150  8.058e-06   6.880e-07
Peak spectrum fit
Power-law model

Time interval is from   39.972 sec. to   40.972 sec.

Spectral model in power-law:
------------------------------------------------------------
Parameters  : value       lower 90%   higher 90%
Photon index: 1.65234     ( -0.0676115   0.0681368 )
Norm@50keV  : 7.14941E-02    ( -0.00292308   0.00291766 )
------------------------------------------------------------
#Fit statistic : Chi-Squared =          58.06 using 59 PHA bins.
# Reduced chi-squared =          1.019 for     57 degrees of freedom
# Null hypothesis probability =   4.358590e-01

Photon flux (15-150 keV)    in 1 sec: 9.34293 ( -0.39051  0.39112 ) ph/cm2/s
Energy fluence (15-150 keV)             : 6.6486e-07 ( -2.84749e-08  2.85498e-08 ) ergs/cm2
Cutoff power-law model

Time interval is from   39.972 sec. to   40.972 sec.
Spectral model in the cutoff power-law:
------------------------------------------------------------
Parameters  : value       lower 90%   higher 90%
Photon index: 0.944906     ( -0.323856   0.300518 )
Epeak [keV] : 75.3723      ( -9.9638 20.0236 )
Norm@50keV  : 0.161494    ( -0.0464146   0.0716631 )
------------------------------------------------------------
#Fit statistic : Chi-Squared =          40.38 using 59 PHA bins.
# Reduced chi-squared =         0.7211 for     56 degrees of freedom
# Null hypothesis probability =   9.425012e-01

Photon flux (15-150 keV)    in 1 sec: 9.04432 ( -0.40785  0.40847 ) ph/cm2/s
Energy fluence (15-150 keV)             : 6.37808e-07 ( -3.10856e-08  3.10132e-08 ) ergs/cm2
Band function

Time interval is from   39.972 sec. to   40.972 sec.


Spectral model in the Band function:
------------------------------------------------------------
Parameters  : value       lower 90%   higher 90%
alpha       :    (     )
beta        :     (     )
Epeak [keV] :       (   )
Norm@50keV   :     (     )
------------------------------------------------------------

Photon flux (15-150 keV)    in  sec:  (    ) ph/cm2/s
Energy fluence (15-150 keV)             : 0 ( 0  0 ) ergs/cm2
Single BB
Spectral model blackbody:
------------------------------------------------------------
Parameters  : value    Lower 90%  Upper 90%
kT [keV]    : 13.9921  (  )
R^2/D10^2   : 1.33873  (   )
(R is the radius in km and D10 is the distance to the source in units of 10 kpc)
------------------------------------------------------------
#Fit statistic : Chi-Squared =         136.37 using 59 PHA bins.
# Reduced chi-squared =         2.3925 for     57 degrees of freedom
# Null hypothesis probability =   1.874208e-08

Energy  Fluence     90% Error
[keV]   [erg/cm2]   [erg/cm2]
15- 25  5.537e-08   4.140e-09
25- 50  2.058e-07   9.800e-09
50-150  2.652e-07   2.160e-08
15-150  5.264e-07   2.335e-08
Thermal bremsstrahlung (OTTB)

Spectral model: thermal bremsstrahlung
------------------------------------------------------------
Parameters  : value         Lower 90%    Upper 90%
kT [keV]    : 153.836       (-26.9432      31.4818)
Norm        : 38.5534       (-1.77648     2.09442)
------------------------------------------------------------
#Fit statistic : Chi-Squared =          43.51 using 59 PHA bins.
# Reduced chi-squared =         0.7633 for     57 degrees of freedom
# Null hypothesis probability =   9.058754e-01

Energy  Fluence     90% Error
[keV]   [erg/cm2]   [erg/cm2]
15- 25  9.880e-08   6.675e-09
25- 50  1.838e-07   1.355e-08
50-150  3.666e-07   9.610e-08
15-150  6.492e-07   1.082e-07
Double BB

Spectral model: bbodyrad<1> + bbodyrad<2>
------------------------------------------------------------
Parameters  : value         Lower 90%    Upper 90%
kT1 [keV]   : 8.75460        (-1.27717      1.21148)
R1^2/D10^2  : 4.92603        (-1.52824      2.85259)
kT2 [keV]   : 28.2476        (-5.31485      9.03763)
R2^2/D10^2  : 6.83254E-02    (-0.0433044   0.0895725)
------------------------------------------------------------
#Fit statistic : Chi-Squared =          40.93 using 59 PHA bins.
# Reduced chi-squared =         0.7441 for     55 degrees of freedom
# Null hypothesis probability =   9.210545e-01

Energy  Fluence     90% Error
[keV]   [erg/cm2]   [erg/cm2]
15- 25  8.126e-08   9.885e-09
25- 50  2.005e-07   2.115e-08
50-150  3.577e-07   1.069e-07
15-150  6.394e-07   1.220e-07
Pre-slew spectrum (Pre-slew PHA with pre-slew DRM)
Power-law model

Spectral model in power-law:
------------------------------------------------------------
Parameters  : value       lower 90%   higher 90%
Photon index: 1.34824     ( -0.11153   0.110565 )
Norm@50keV  : 1.46162E-02    ( -0.000988332   0.000987547 )
------------------------------------------------------------
#Fit statistic : Chi-Squared =          62.79 using 59 PHA bins.
# Reduced chi-squared =          1.102 for     57 degrees of freedom
# Null hypothesis probability =   2.787002e-01

Photon flux (15-150 keV)    in 24.7 sec: 1.76019 ( -0.129433  0.130015 ) ph/cm2/s
Energy fluence (15-150 keV)             : 3.52741e-06 ( -2.44386e-07  2.44653e-07 ) ergs/cm2
Cutoff power-law model

Spectral model in the cutoff power-law:
------------------------------------------------------------
Parameters  : value       lower 90%   higher 90%
Photon index: 0.486353     ( -0.555466   0.492051 )
Epeak [keV] : 102.074      ( -19.3083 57.2529 )
Norm@50keV  : 3.50164E-02    ( -0.0134579   0.0247678 )
------------------------------------------------------------
#Fit statistic : Chi-Squared =          53.13 using 59 PHA bins.
# Reduced chi-squared =         0.9488 for     56 degrees of freedom
# Null hypothesis probability =   5.841048e-01

Photon flux (15-150 keV)    in 24.7 sec: 1.68938 ( -0.13484  0.13545 ) ph/cm2/s
Energy fluence (15-150 keV)             : 3.44427e-06 ( -2.53669e-07  2.52928e-07 ) ergs/cm2
Band function

Spectral model in the Band function:
------------------------------------------------------------
Parameters  : value       lower 90%   higher 90%
alpha       :    (     )
beta        :     (     )
Epeak [keV] :       (   )
Norm@50keV   :     (     )
------------------------------------------------------------

Photon flux (15-150 keV)    in  sec:  (    ) ph/cm2/s
Energy fluence (15-150 keV)             : 0 ( 0  0 ) ergs/cm2
S(25-50 keV) vs. S(50-100 keV) plot

S(25-50 keV)  = 2.08e-06
S(50-100 keV) = 2.89e-06
T90 vs. Hardness ratio plot
T90                                   = 64 sec.
Hardness ratio (energy fluence ratio) = 1.38942
Color vs. Color plot
Count Ratio  (25-50 keV) / (15-25 keV) = 1.52793
Count Ratio (50-100 keV) / (15-25 keV) = 1.23905
Mask shadow pattern

IMX = 1.412432995485279E+00, IMY = 2.658084607445688E-01
TIME vs. PHA plot around the trigger time

Blue+Cyan dotted lines: Time interval of the scaled map
From 0.000000 to 0.256000
TIME vs. DetID plot around the trigger time
Blue+Cyan dotted lines: Time interval of the scaled map
From 0.000000 to 0.256000
100 us light curve (15-350 keV)
Blue+Cyan dotted lines: Time interval of the scaled map
From 0.000000 to 0.256000
Spacecraft aspect plot

Bright source in the pre-burst/pre-slew/post-slew images
Pre-burst image of 15-350 keV band
Time interval of the image:
-239.528000 -15.528000

# RAcent  DECcent POSerr Theta    Phi  PeakCts   SNR AngSep     Name
#  [deg]    [deg]    ['] [deg]  [deg]                   [']
254.2860  35.3400   10.1  39.5 -126.4  -0.5619  -1.1    8.4	Her X-1
299.5225  35.1340    7.5  55.8 -171.9   1.5522   1.5    5.2	Cyg X-1
308.1024  40.7979    6.5  53.8  177.6   1.6185   1.9    9.3	Cyg X-3
236.0431  30.1645    3.9  39.9 -101.0   2.9036   3.0 ------	UNKNOWN
212.9096  25.5452    3.1  42.5  -69.2   3.8316   3.8 ------	UNKNOWN
205.9654  23.6280    3.1  44.8  -60.2   4.5335   3.7 ------	UNKNOWN
Pre-slew background subtracted image of 15-350 keV band
Time interval of the image:
-15.528000 9.172600

# RAcent  DECcent POSerr Theta    Phi  PeakCts   SNR AngSep     Name
#  [deg]    [deg]    ['] [deg]  [deg]                   [']
254.4036  35.4460    4.9  39.4 -126.6  -0.3241  -2.4    6.8	Her X-1
299.6902  35.2388   43.3  55.8 -172.1  -0.0689  -0.3    5.4	Cyg X-1
308.0151  40.8947   94.1  53.7  177.6   0.0296   0.1    5.5	Cyg X-3
  9.5026  68.4967    2.5  42.3  121.7   1.1069   4.7 ------	UNKNOWN
163.7746  22.4607    0.5  55.2  -10.7   5.1846  22.8 ------	UNKNOWN
285.4934  34.6954    2.3  51.0 -158.8   0.8333   5.0 ------	UNKNOWN
183.3639  29.5875    2.8  42.7  -29.8   0.4268   4.1 ------	UNKNOWN
208.6797  31.5645    2.3  36.7  -63.0   0.6748   5.1 ------	UNKNOWN
252.2406  29.3507    2.0  44.5 -120.9   1.6155   5.6 ------	UNKNOWN
Post-slew image of 15-350 keV band
Time interval of the image:
77.572600 714.772590

# RAcent  DECcent POSerr Theta    Phi  PeakCts   SNR AngSep     Name
#  [deg]    [deg]    ['] [deg]  [deg]                   [']
123.8424  19.4812    3.3  37.3   68.1   3.6513   3.5 ------	UNKNOWN
137.6255  68.3019    4.0  48.6  142.4   5.8572   2.9 ------	UNKNOWN
225.0062  61.6276    2.7  56.8 -175.2  10.0643   4.3 ------	UNKNOWN
219.8558  54.0524    2.8  52.3 -167.0   5.5185   4.1 ------	UNKNOWN
192.6018  29.7139    3.0  26.8 -136.9   1.7090   3.8 ------	UNKNOWN
Plot creation:
Sat Jan 20 09:18:11 EST 2018