Estimated redshift from machine learning (Ukwatta et al. 2016) - may take a few minute to calcaulte
Image
Pre-slew 15.0-350.0 keV image (Event data)
#   RAcent    DECcent   POSerr    Theta     Phi              Peak Cts       SNR   Name
  186.1956    32.5041   0.0219    22.1925  -142.9479         0.5974585      8.777 TRIG_00791922

Foreground time interval of the image:
 -1.392  29.853 (delta_t =  31.245 [sec])
Background time interval of the image:
-239.648  -1.392 (delta_t = 238.256 [sec])
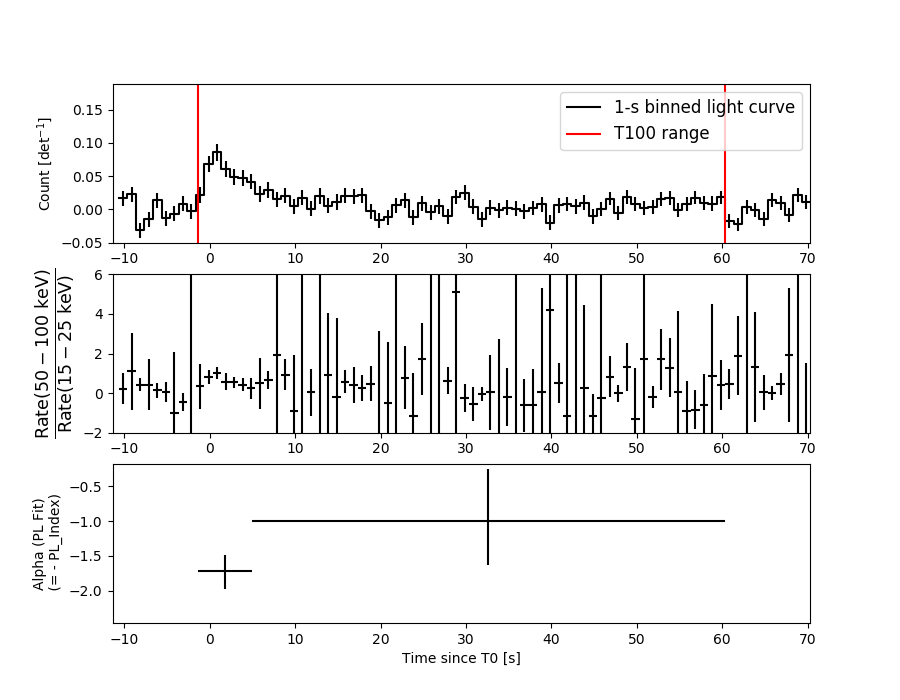
Lightcurves
Notes:
- 1) The mask-weighted light curves are using the flight position.
- 2) Multiple plots of different time binning/intervals are shown to cover all scenarios of short/long GRBs, rate/image triggers, and real/false positives.
- 3) For all the mask-weighted lightcurves, the y-axis units are counts/sec/det where a det is 0.4 x 0.4 = 0.16 sq cm.
- 4) The verticle lines correspond to following: green dotted lines are T50 interval, black dotted lines are T90 interval, blue solid line(s) is a spacecraft slew start time, and orange solid line(s) is a spacecraft slew end time.
- 5) Time of each bin is in the middle of the bin.
1 s binning
From T0-310 s to T0+310 s
From T100_start - 20 s to T100_end + 30 s

Full time interval

64 ms binning
Full time interval
From T100_start to T100_end
From T0-5 sec to T0+5 sec

16 ms binning
From T100_start-5 s to T100_start+5 s

Blue+Cyan dotted lines: Time interval of the scaled map
From 0.000000 to 2.048000
8 ms binning
From T100_start-3 s to T100_start+3 s
Blue+Cyan dotted lines: Time interval of the scaled map
From 0.000000 to 2.048000
2 ms binning
From T100_start-1 s to T100_start+1 s
Blue+Cyan dotted lines: Time interval of the scaled map
From 0.000000 to 2.048000
SN=5 or 10 sec. binning (whichever binning is satisfied first)

SN=5 or 10 sec. binning (T < 200 sec)
Quad-rate summed light curves (from T0-300s to T0+1000s)

Spectral Evolution
Spectra
Notes:
- 1) The fitting includes the systematic errors.
- 2) When the burst includes telescope slew time periods, the fitting uses an average response file made from multiple 5-s response files through out the slew time plus single time preiod for the non-slew times, and weighted by the total counts in the corresponding time period using addrmf. An average response file is needed becuase a spectral fit using the pre-slew DRM will introduce some errors in both a spectral shape and a normalization if the PHA file contains a lot of the slew/post-slew time interval.
- 3) For fits to more complicated models (e.g. a power-law over a cutoff power-law), the BAT team has decided to require a chi-square improvement of more than 6 for each extra dof.
Time averaged spectrum fit using the average DRM
Power-law model

Time interval is from   -1.392 sec. to   60.288 sec.

Spectral model in power-law:
------------------------------------------------------------
Parameters  : value       lower 90%   higher 90%
Photon index: 1.37018     ( -0.341157   0.336467 )
Norm@50keV  : 7.93244E-04    ( -0.000151231   0.000150262 )
------------------------------------------------------------
#Fit statistic : Chi-Squared =          46.67 using 59 PHA bins.
# Reduced chi-squared =         0.8188 for     57 degrees of freedom
# Null hypothesis probability =   8.338743e-01

Photon flux (15-150 keV)    in 61.68 sec: 9.59704E-02 ( -0.0183218  0.0183666 ) ph/cm2/s
Energy fluence (15-150 keV)             : 4.758e-07 ( -1.00841e-07  1.02608e-07 ) ergs/cm2
Cutoff power-law model

Time interval is from   -1.392 sec. to   60.288 sec.
Spectral model in the cutoff power-law:
------------------------------------------------------------
Parameters  : value       lower 90%   higher 90%
Photon index: 1.36709     ( -1.1979   2.25384 )
Epeak [keV] : 1.00000E+04      ( -10000 -10000 )
Norm@50keV  : 7.96223E-04    ( -0.000152188   -0.000796237 )
------------------------------------------------------------
#Fit statistic : Chi-Squared =          46.67 using 59 PHA bins.
# Reduced chi-squared =         0.8334 for     56 degrees of freedom
# Null hypothesis probability =   8.083616e-01

Photon flux (15-150 keV)    in 61.68 sec: 9.62769E-02 ( -0.0194978  0.0186551 ) ph/cm2/s
Energy fluence (15-150 keV)             : 4.79164e-07 ( -1.18831e-07  1.09048e-07 ) ergs/cm2
Band function

Time interval is from   -1.392 sec. to   60.288 sec.


Spectral model in the Band function:
------------------------------------------------------------
Parameters  : value       lower 90%   higher 90%
alpha       :    (     )
beta        :     (     )
Epeak [keV] :       (   )
Norm@50keV   :     (     )
------------------------------------------------------------

Photon flux (15-150 keV)    in  sec:  (    ) ph/cm2/s
Energy fluence (15-150 keV)             : 0 ( 0  0 ) ergs/cm2
Single BB

Spectral model blackbody:
------------------------------------------------------------
Parameters  : value    Lower 90%  Upper 90%
kT [keV]    : 15.9091  (-4.21671  6.12841)
R^2/D10^2   : 8.84892E-03  (-0.00584796   0.0168506)
(R is the radius in km and D10 is the distance to the source in units of 10 kpc)
------------------------------------------------------------
#Fit statistic : Chi-Squared =          55.90 using 59 PHA bins.
# Reduced chi-squared =         0.9807 for     57 degrees of freedom
# Null hypothesis probability =   5.165034e-01

Energy  Fluence     90% Error
[keV]   [erg/cm2]   [erg/cm2]
15- 25  2.860e-08   1.280e-08
25- 50  1.198e-07   4.410e-08
50-150  2.114e-07   8.755e-08
15-150  3.597e-07   1.152e-07
Thermal bremsstrahlung (OTTB)

Spectral model: thermal bremsstrahlung
------------------------------------------------------------
Parameters  : value         Lower 90%    Upper 90%
kT [keV]    : 199.363       (-88.8046      -199.363)
Norm        : 0.395105       (-0.0744278     0.0744278)
------------------------------------------------------------
#Fit statistic : Chi-Squared =          47.69 using 59 PHA bins.
# Reduced chi-squared =         0.8368 for     57 degrees of freedom
# Null hypothesis probability =   8.052832e-01

Energy  Fluence     90% Error
[keV]   [erg/cm2]   [erg/cm2]
15- 25  6.068e-08   3.599e-08
25- 50  1.167e-07   6.652e-08
50-150  2.560e-07   1.464e-07
15-150  4.334e-07   2.471e-07
Double BB

Spectral model: bbodyrad<1> + bbodyrad<2>
------------------------------------------------------------
Parameters  : value         Lower 90%    Upper 90%
kT1 [keV]   : 7.75043        (-3.08603      4.19721)
R1^2/D10^2  : 7.60332E-02        (-0.05664      0.106103)
kT2 [keV]   : 37.4096        (-32.7474      -37.4104)
R2^2/D10^2  : 4.37649E-04    (-0.000426504   0.00272888)
------------------------------------------------------------
#Fit statistic : Chi-Squared =          45.91 using 59 PHA bins.
# Reduced chi-squared =         0.8347 for     55 degrees of freedom
# Null hypothesis probability =   8.037216e-01

Energy  Fluence     90% Error
[keV]   [erg/cm2]   [erg/cm2]
15- 25  5.482e-08   3.210e-08
25- 50  1.164e-07   6.350e-08
50-150  3.192e-07   1.807e-07
15-150  4.905e-07   2.435e-07
Peak spectrum fit
Power-law model

Time interval is from   -0.268 sec. to    0.732 sec.

Spectral model in power-law:
------------------------------------------------------------
Parameters  : value       lower 90%   higher 90%
Photon index: 1.66139     ( -0.379502   0.410463 )
Norm@50keV  : 6.19099E-03    ( -0.0014466   0.00136125 )
------------------------------------------------------------
#Fit statistic : Chi-Squared =          55.46 using 59 PHA bins.
# Reduced chi-squared =         0.9731 for     57 degrees of freedom
# Null hypothesis probability =   5.328589e-01

Photon flux (15-150 keV)    in 1 sec: 0.811483 ( -0.160399  0.160438 ) ph/cm2/s
Energy fluence (15-150 keV)             : 5.75215e-08 ( -1.38739e-08  1.41786e-08 ) ergs/cm2
Cutoff power-law model

Time interval is from   -0.268 sec. to    0.732 sec.
Spectral model in the cutoff power-law:
------------------------------------------------------------
Parameters  : value       lower 90%   higher 90%
Photon index: 2.90508     ( -1.54296   0.236041 )
Epeak [keV] : 272.887      (   )
Norm@50keV  : 1.57224E-03    (     )
------------------------------------------------------------
#Fit statistic : Chi-Squared =          53.70 using 59 PHA bins.
# Reduced chi-squared =         0.9589 for     56 degrees of freedom
# Null hypothesis probability =   5.624730e-01

Photon flux (15-150 keV)    in 1 sec: 0.811505 ( -0.159797  0.16036 ) ph/cm2/s
Energy fluence (15-150 keV)             : 3.89969e-08 ( 0  0 ) ergs/cm2
Band function

Time interval is from   -0.268 sec. to    0.732 sec.


Spectral model in the Band function:
------------------------------------------------------------
Parameters  : value       lower 90%   higher 90%
alpha       :    (     )
beta        :     (     )
Epeak [keV] :       (   )
Norm@50keV   :     (     )
------------------------------------------------------------

Photon flux (15-150 keV)    in  sec:  (    ) ph/cm2/s
Energy fluence (15-150 keV)             : 0 ( 0  0 ) ergs/cm2
Single BB

Spectral model blackbody:
------------------------------------------------------------
Parameters  : value    Lower 90%  Upper 90%
kT [keV]    : 12.3865  (-3.9245  6.25626)
R^2/D10^2   : 0.166375  (-0.123421   0.485117)
(R is the radius in km and D10 is the distance to the source in units of 10 kpc)
------------------------------------------------------------
#Fit statistic : Chi-Squared =          69.55 using 59 PHA bins.
# Reduced chi-squared =          1.220 for     57 degrees of freedom
# Null hypothesis probability =   1.229326e-01

Energy  Fluence     90% Error
[keV]   [erg/cm2]   [erg/cm2]
15- 25  5.410e-09   2.694e-09
25- 50  1.766e-08   6.722e-09
50-150  1.663e-08   8.901e-09
15-150  3.970e-08   1.499e-08
Thermal bremsstrahlung (OTTB)

Spectral model: thermal bremsstrahlung
------------------------------------------------------------
Parameters  : value         Lower 90%    Upper 90%
kT [keV]    : 194.126       (-112.602      -180.768)
Norm        : 3.26382       (-0.663124     0.935871)
------------------------------------------------------------
#Fit statistic : Chi-Squared =          56.82 using 59 PHA bins.
# Reduced chi-squared =         0.9969 for     57 degrees of freedom
# Null hypothesis probability =   4.816651e-01

Energy  Fluence     90% Error
[keV]   [erg/cm2]   [erg/cm2]
15- 25  8.155e-09   4.853e-09
25- 50  1.564e-08   8.840e-09
50-150  3.400e-08   1.941e-08
15-150  5.779e-08   3.293e-08
Double BB

Spectral model: bbodyrad<1> + bbodyrad<2>
------------------------------------------------------------
Parameters  : value         Lower 90%    Upper 90%
kT1 [keV]   : 5.08289        (-2.55447      3.73299)
R1^2/D10^2  : 3.60513        (-3.06477      110.681)
kT2 [keV]   : 29.8435        (-13.2462      -30.0745)
R2^2/D10^2  : 6.98222E-03    (-0.00639604   0.0255222)
------------------------------------------------------------
#Fit statistic : Chi-Squared =          55.35 using 59 PHA bins.
# Reduced chi-squared =          1.006 for     55 degrees of freedom
# Null hypothesis probability =   4.612994e-01

Energy  Fluence     90% Error
[keV]   [erg/cm2]   [erg/cm2]
15- 25  1.033e-08   5.800e-09
25- 50  1.237e-08   6.560e-09
50-150  3.815e-08   2.335e-08
15-150  6.086e-08   3.313e-08
Pre-slew spectrum (Pre-slew PHA with pre-slew DRM)
Power-law model

Spectral model in power-law:
------------------------------------------------------------
Parameters  : value       lower 90%   higher 90%
Photon index: 1.60816     ( -0.337608   0.351458 )
Norm@50keV  : 1.19869E-03    ( -0.000236807   0.000227991 )
------------------------------------------------------------
#Fit statistic : Chi-Squared =          53.06 using 59 PHA bins.
# Reduced chi-squared =         0.9308 for     57 degrees of freedom
# Null hypothesis probability =   6.237553e-01

Photon flux (15-150 keV)    in 31.24 sec: 0.154429 ( -0.0272831  0.0273069 ) ph/cm2/s
Energy fluence (15-150 keV)             : 3.49863e-07 ( -7.34759e-08  7.51669e-08 ) ergs/cm2
Cutoff power-law model

Spectral model in the cutoff power-law:
------------------------------------------------------------
Parameters  : value       lower 90%   higher 90%
Photon index: 1.60870     ( -0.455616   0.337322 )
Epeak [keV] : 1.00000E+04      ( -10000 -10000 )
Norm@50keV  : 1.20040E-03    (     )
------------------------------------------------------------
#Fit statistic : Chi-Squared =          53.06 using 59 PHA bins.
# Reduced chi-squared =         0.9476 for     56 degrees of freedom
# Null hypothesis probability =   5.867315e-01

Photon flux (15-150 keV)    in 31.24 sec: 0.154497 ( -0.027091  0.027181 ) ph/cm2/s
Energy fluence (15-150 keV)             : 3.49207e-07 ( -7.28423e-08  3.93437e-08 ) ergs/cm2
Band function

Spectral model in the Band function:
------------------------------------------------------------
Parameters  : value       lower 90%   higher 90%
alpha       :    (     )
beta        :     (     )
Epeak [keV] :       (   )
Norm@50keV   :     (     )
------------------------------------------------------------

Photon flux (15-150 keV)    in  sec:  (    ) ph/cm2/s
Energy fluence (15-150 keV)             : 0 ( 0  0 ) ergs/cm2
S(25-50 keV) vs. S(50-100 keV) plot
S(25-50 keV)  = 1.10e-07
S(50-100 keV) = 1.70e-07
T90 vs. Hardness ratio plot

T90                                   = 58.4640000462532 sec.
Hardness ratio (energy fluence ratio) = 1.54545
Color vs. Color plot
Count Ratio  (25-50 keV) / (15-25 keV) = 1.91609
Count Ratio (50-100 keV) / (15-25 keV) = 1.2964
Mask shadow pattern

IMX = -3.255722515098822E-01, IMY = 2.458006249442089E-01
TIME vs. PHA plot around the trigger time
Blue+Cyan dotted lines: Time interval of the scaled map
From 0.000000 to 2.048000
TIME vs. DetID plot around the trigger time

Blue+Cyan dotted lines: Time interval of the scaled map
From 0.000000 to 2.048000
100 us light curve (15-350 keV)

Blue+Cyan dotted lines: Time interval of the scaled map
From 0.000000 to 2.048000
Spacecraft aspect plot

Bright source in the pre-burst/pre-slew/post-slew images
Pre-burst image of 15-350 keV band
Time interval of the image:
-239.648000 -1.392000

# RAcent  DECcent POSerr Theta    Phi  PeakCts   SNR AngSep     Name
#  [deg]    [deg]    ['] [deg]  [deg]                   [']
156.5257  75.9608    2.4  53.6  156.6   5.3277   4.8 ------	UNKNOWN
144.9724   8.6225    2.7  22.8   34.3   0.9113   4.2 ------	UNKNOWN
151.8129 -23.6272    3.1  47.5   -6.3   1.4010   3.7 ------	UNKNOWN
Pre-slew background subtracted image of 15-350 keV band
Time interval of the image:
-1.392000 29.852600

# RAcent  DECcent POSerr Theta    Phi  PeakCts   SNR AngSep     Name
#  [deg]    [deg]    ['] [deg]  [deg]                   [']
186.1958  32.5040    1.3  22.2 -142.9   0.5976   8.8 ------	UNKNOWN
214.5790  24.4665    2.1  46.4 -124.2   1.4931   5.4 ------	UNKNOWN
Post-slew image of 15-350 keV band
Time interval of the image:
74.052630 962.487700

# RAcent  DECcent POSerr Theta    Phi  PeakCts   SNR AngSep     Name
#  [deg]    [deg]    ['] [deg]  [deg]                   [']
254.3152  35.1906    9.7  55.5 -151.3  -4.6559  -1.2   11.5	Her X-1
209.3152  21.8208    2.7  23.1 -106.5   2.9985   4.2 ------	UNKNOWN
167.7206 -21.3994    3.0  56.7  -17.6  10.1136   3.8 ------	UNKNOWN
234.0441  17.8621    3.7  45.3 -121.4   8.8702   3.1 ------	UNKNOWN
Plot creation:
Sat Jan 20 09:16:36 EST 2018