Estimated redshift from machine learning (Ukwatta et al. 2016) - may take a few minute to calcaulte
Image
Pre-slew 15.0-350.0 keV image (Event data)
#   RAcent    DECcent   POSerr    Theta     Phi              Peak Cts       SNR   Name
  167.4225   -12.5991   0.0123    44.4511    -2.1899         3.9484566     15.664 TRIG_00794972

Foreground time interval of the image:
-42.228  73.101 (delta_t = 115.329 [sec])
Background time interval of the image:
-239.000 -42.228 (delta_t = 196.772 [sec])
Lightcurves
Notes:
- 1) The mask-weighted light curves are using the flight position.
- 2) Multiple plots of different time binning/intervals are shown to cover all scenarios of short/long GRBs, rate/image triggers, and real/false positives.
- 3) For all the mask-weighted lightcurves, the y-axis units are counts/sec/det where a det is 0.4 x 0.4 = 0.16 sq cm.
- 4) The verticle lines correspond to following: green dotted lines are T50 interval, black dotted lines are T90 interval, blue solid line(s) is a spacecraft slew start time, and orange solid line(s) is a spacecraft slew end time.
- 5) Time of each bin is in the middle of the bin.
1 s binning
From T0-310 s to T0+310 s
From T100_start - 20 s to T100_end + 30 s
Full time interval
64 ms binning
Full time interval
From T100_start to T100_end
From T0-5 sec to T0+5 sec
16 ms binning
From T100_start-5 s to T100_start+5 s
Blue+Cyan dotted lines: Time interval of the scaled map
From 0.000000 to 64.000000
8 ms binning
From T100_start-3 s to T100_start+3 s

Blue+Cyan dotted lines: Time interval of the scaled map
From 0.000000 to 64.000000
2 ms binning
From T100_start-1 s to T100_start+1 s
Blue+Cyan dotted lines: Time interval of the scaled map
From 0.000000 to 64.000000
SN=5 or 10 sec. binning (whichever binning is satisfied first)
SN=5 or 10 sec. binning (T < 200 sec)

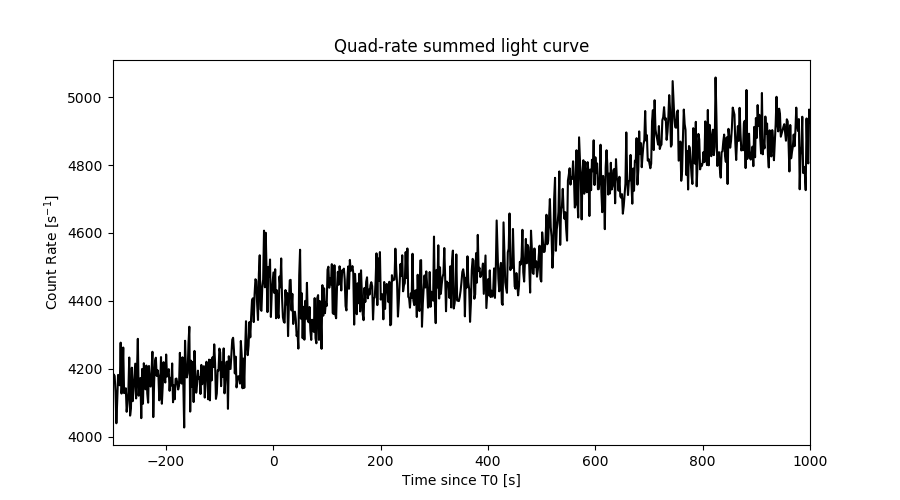
Quad-rate summed light curves (from T0-300s to T0+1000s)
Spectral Evolution

Spectra
Notes:
- 1) The fitting includes the systematic errors.
- 2) When the burst includes telescope slew time periods, the fitting uses an average response file made from multiple 5-s response files through out the slew time plus single time preiod for the non-slew times, and weighted by the total counts in the corresponding time period using addrmf. An average response file is needed becuase a spectral fit using the pre-slew DRM will introduce some errors in both a spectral shape and a normalization if the PHA file contains a lot of the slew/post-slew time interval.
- 3) For fits to more complicated models (e.g. a power-law over a cutoff power-law), the BAT team has decided to require a chi-square improvement of more than 6 for each extra dof.
Time averaged spectrum fit using the average DRM
Power-law model

Time interval is from  -42.228 sec. to  197.796 sec.

Spectral model in power-law:
------------------------------------------------------------
Parameters  : value       lower 90%   higher 90%
Photon index: 1.37006     ( -0.135959   0.135456 )
Norm@50keV  : 1.51138E-03    ( -0.000113853   0.00011385 )
------------------------------------------------------------
#Fit statistic : Chi-Squared =          61.42 using 59 PHA bins.
# Reduced chi-squared =          1.078 for     57 degrees of freedom
# Null hypothesis probability =   3.207276e-01

Photon flux (15-150 keV)    in 240 sec: 0.182849 ( -0.01479  0.014869 ) ph/cm2/s
Energy fluence (15-150 keV)             : 3.52754e-06 ( -2.83166e-07  2.84266e-07 ) ergs/cm2
Cutoff power-law model

Time interval is from  -42.228 sec. to  197.796 sec.
Spectral model in the cutoff power-law:
------------------------------------------------------------
Parameters  : value       lower 90%   higher 90%
Photon index: 1.21901     ( -0.56451   0.271354 )
Epeak [keV] : 295.335      ( -295.266 -295.266 )
Norm@50keV  : 1.76685E-03    ( -0.000356463   0.00132738 )
------------------------------------------------------------
#Fit statistic : Chi-Squared =          61.17 using 59 PHA bins.
# Reduced chi-squared =          1.092 for     56 degrees of freedom
# Null hypothesis probability =   2.957016e-01

Photon flux (15-150 keV)    in 240 sec: 0.181299 ( -0.015704  0.015517 ) ph/cm2/s
Energy fluence (15-150 keV)             : 3.50518e-06 ( -2.94538e-07  2.93578e-07 ) ergs/cm2
Band function
Time interval is from  -42.228 sec. to  197.796 sec.

Spectral model in the Band function:
------------------------------------------------------------
Parameters  : value       lower 90%   higher 90%
alpha       : -1.24073   ( -0.159806   0.608358 )
beta        : -9.37167    ( 9.37167   19.3717 )
Epeak [keV] : 335.112      ( -335.054 -335.054 )
Norm@50keV   : 1.72827E-03    ( -0.000130132   0.000428264 )
------------------------------------------------------------
#Fit statistic : Chi-Squared =          61.17 using 59 PHA bins.
# Reduced chi-squared =          1.112 for     55 degrees of freedom
# Null hypothesis probability =   2.639872e-01

Photon flux (15-150 keV)    in 240 sec: 0.195471 ( -0.027916  0.000304 ) ph/cm2/s
Energy fluence (15-150 keV)             : 3.84442e-06 ( -6.02729e-07  -5.23032e-08 ) ergs/cm2
Single BB

Spectral model blackbody:
------------------------------------------------------------
Parameters  : value    Lower 90%  Upper 90%
kT [keV]    : 19.1141  (-1.75367  1.98819)
R^2/D10^2   : 9.25457E-03  (-0.0026621   0.00362424)
(R is the radius in km and D10 is the distance to the source in units of 10 kpc)
------------------------------------------------------------
#Fit statistic : Chi-Squared =          96.81 using 59 PHA bins.
# Reduced chi-squared =          1.698 for     57 degrees of freedom
# Null hypothesis probability =   7.865154e-04

Energy  Fluence     90% Error
[keV]   [erg/cm2]   [erg/cm2]
15- 25  1.592e-07   2.446e-08
25- 50  7.687e-07   1.019e-07
50-150  2.066e-06   2.614e-07
15-150  2.994e-06   2.820e-07
Thermal bremsstrahlung (OTTB)

Spectral model: thermal bremsstrahlung
------------------------------------------------------------
Parameters  : value         Lower 90%    Upper 90%
kT [keV]    : 200.000       (-23.6675      -200)
Norm        : 0.766046       (-0.0581385     0.0581385)
------------------------------------------------------------
#Fit statistic : Chi-Squared =          68.42 using 59 PHA bins.
# Reduced chi-squared =          1.200 for     57 degrees of freedom
# Null hypothesis probability =   1.430431e-01

Energy  Fluence     90% Error
[keV]   [erg/cm2]   [erg/cm2]
15- 25  4.578e-07   3.924e-08
25- 50  8.806e-07   1.146e-07
50-150  1.931e-06   6.055e-07
15-150  3.270e-06   6.557e-07
Double BB

Spectral model: bbodyrad<1> + bbodyrad<2>
------------------------------------------------------------
Parameters  : value         Lower 90%    Upper 90%
kT1 [keV]   : 4.11516        (-1.0456      1.44804)
R1^2/D10^2  : 1.43862        (-1.07214      5.24021)
kT2 [keV]   : 23.3624        (-2.71719      3.605)
R2^2/D10^2  : 4.33804E-03    (-0.00170012   0.00234645)
------------------------------------------------------------
#Fit statistic : Chi-Squared =          56.03 using 59 PHA bins.
# Reduced chi-squared =          1.019 for     55 degrees of freedom
# Null hypothesis probability =   4.359848e-01

Energy  Fluence     90% Error
[keV]   [erg/cm2]   [erg/cm2]
15- 25  4.619e-07   2.080e-07
25- 50  7.001e-07   1.280e-07
50-150  2.281e-06   3.457e-07
15-150  3.443e-06   5.208e-07
Peak spectrum fit
Power-law model

Time interval is from   49.076 sec. to   50.076 sec.

Spectral model in power-law:
------------------------------------------------------------
Parameters  : value       lower 90%   higher 90%
Photon index: 1.98678     ( -0.589035   0.814732 )
Norm@50keV  : 6.39369E-03    ( -0.00278668   0.00227118 )
------------------------------------------------------------
#Fit statistic : Chi-Squared =          63.76 using 59 PHA bins.
# Reduced chi-squared =          1.119 for     57 degrees of freedom
# Null hypothesis probability =   2.509096e-01

Photon flux (15-150 keV)    in 1 sec: 0.953374 ( -0.276734  0.277036 ) ph/cm2/s
Energy fluence (15-150 keV)             : 5.89223e-08 ( -2.1058e-08  2.12289e-08 ) ergs/cm2
Cutoff power-law model

Time interval is from   49.076 sec. to   50.076 sec.
Spectral model in the cutoff power-law:
------------------------------------------------------------
Parameters  : value       lower 90%   higher 90%
Photon index: 4.81387     ( -0.589809   0.82393 )
Epeak [keV] : 581.991      ( -9808.18 -9999.36 )
Norm@50keV  : 3.47817E-04    ( -0.00034788   0.00461241 )
------------------------------------------------------------
#Fit statistic : Chi-Squared =          60.74 using 59 PHA bins.
# Reduced chi-squared =          1.085 for     56 degrees of freedom
# Null hypothesis probability =   3.090424e-01

Photon flux (15-150 keV)    in 1 sec: 0.497018 ( -0.274357  0.419467 ) ph/cm2/s
Energy fluence (15-150 keV)             : 5.44791e-08 ( 0  0 ) ergs/cm2
Band function

Time interval is from   49.076 sec. to   50.076 sec.

Spectral model in the Band function:
------------------------------------------------------------
Parameters  : value       lower 90%   higher 90%
alpha       : -1.98952   ( -0.688205   1.55242 )
beta        : -9.36557    ( 5.99492   9.36557 )
Epeak [keV] : 9999.36      ( -9998.7 -9999.36 )
Norm@50keV   : 6.38599E-03    ( -0.00183256   0.002794 )
------------------------------------------------------------
#Fit statistic : Chi-Squared =          63.76 using 59 PHA bins.
# Reduced chi-squared =          1.159 for     55 degrees of freedom
# Null hypothesis probability =   1.955945e-01

Photon flux (15-150 keV)    in 1 sec: 0.929911 ( -0.264655  0.310939 ) ph/cm2/s
Energy fluence (15-150 keV)             : 5.89223e-08 ( -2.1058e-08  2.12289e-08 ) ergs/cm2
Single BB

Spectral model blackbody:
------------------------------------------------------------
Parameters  : value    Lower 90%  Upper 90%
kT [keV]    : 3.41890  (-1.06316  2.17015)
R^2/D10^2   : 44.0821  (-44.0821   392.212)
(R is the radius in km and D10 is the distance to the source in units of 10 kpc)
------------------------------------------------------------
#Fit statistic : Chi-Squared =          74.01 using 59 PHA bins.
# Reduced chi-squared =          1.298 for     57 degrees of freedom
# Null hypothesis probability =   6.441314e-02

Energy  Fluence     90% Error
[keV]   [erg/cm2]   [erg/cm2]
15- 25  1.776e-08   1.061e-08
25- 50  3.998e-09   2.558e-09
50-150  1.738e-11   2.089e-11
15-150  2.177e-08   1.286e-08
Thermal bremsstrahlung (OTTB)

Spectral model: thermal bremsstrahlung
------------------------------------------------------------
Parameters  : value         Lower 90%    Upper 90%
kT [keV]    : 99.5075       (-60.8934      -99.8644)
Norm        : 4.08078       (-1.43716     2.31626)
------------------------------------------------------------
#Fit statistic : Chi-Squared =          64.85 using 59 PHA bins.
# Reduced chi-squared =          1.138 for     57 degrees of freedom
# Null hypothesis probability =   2.218624e-01

Energy  Fluence     90% Error
[keV]   [erg/cm2]   [erg/cm2]
15- 25  9.893e-09   5.875e-09
25- 50  1.775e-08   1.079e-08
50-150  3.191e-08   2.257e-08
15-150  5.954e-08   3.896e-08
Double BB

Spectral model: bbodyrad<1> + bbodyrad<2>
------------------------------------------------------------
Parameters  : value         Lower 90%    Upper 90%
kT1 [keV]   : 2.78213        (-0.991101      1.2287)
R1^2/D10^2  : 122.286        (-107.655      2696.9)
kT2 [keV]   : 21.0179        (-5.96106      10.7624)
R2^2/D10^2  : 2.59738E-02    (-0.0197776   0.0568499)
------------------------------------------------------------
#Fit statistic : Chi-Squared =          55.81 using 59 PHA bins.
# Reduced chi-squared =          1.015 for     55 degrees of freedom
# Null hypothesis probability =   4.443129e-01

Energy  Fluence     90% Error
[keV]   [erg/cm2]   [erg/cm2]
15- 25  1.626e-08   9.025e-09
25- 50  1.271e-08   7.185e-09
50-150  3.670e-08   2.415e-08
15-150  6.567e-08   3.740e-08
Pre-slew spectrum (Pre-slew PHA with pre-slew DRM)
Power-law model

Spectral model in power-law:
------------------------------------------------------------
Parameters  : value       lower 90%   higher 90%
Photon index: 1.35775     ( -0.148663   0.147638 )
Norm@50keV  : 2.31822E-03    ( -0.000197358   0.000197279 )
------------------------------------------------------------
#Fit statistic : Chi-Squared =          75.13 using 59 PHA bins.
# Reduced chi-squared =          1.318 for     57 degrees of freedom
# Null hypothesis probability =   5.412986e-02

Photon flux (15-150 keV)    in 115.3 sec: 0.279747 ( -0.0256615  0.0257401 ) ph/cm2/s
Energy fluence (15-150 keV)             : 2.60607e-06 ( -2.33433e-07  2.3403e-07 ) ergs/cm2
Cutoff power-law model

Spectral model in the cutoff power-law:
------------------------------------------------------------
Parameters  : value       lower 90%   higher 90%
Photon index: 0.880553     ( -0.691089   0.53694 )
Epeak [keV] : 135.216      ( -48.4459 -135.216 )
Norm@50keV  : 3.77484E-03    ( -0.00155455   0.00362113 )
------------------------------------------------------------
#Fit statistic : Chi-Squared =          73.28 using 59 PHA bins.
# Reduced chi-squared =          1.309 for     56 degrees of freedom
# Null hypothesis probability =   6.039434e-02

Photon flux (15-150 keV)    in 115.3 sec: 0.272586 ( -0.027217  0.027232 ) ph/cm2/s
Energy fluence (15-150 keV)             : 2.56186e-06 ( -2.43248e-07  2.42349e-07 ) ergs/cm2
Band function

Spectral model in the Band function:
------------------------------------------------------------
Parameters  : value       lower 90%   higher 90%
alpha       : -0.880456   ( -0.595621   0.583171 )
beta        : -10.0000    ( 10   0 )
Epeak [keV] : 135.171      ( -48.4273 -135.171 )
Norm@50keV   : 3.77508E-03    ( -0.00155969   0.00362197 )
------------------------------------------------------------
#Fit statistic : Chi-Squared =          73.28 using 59 PHA bins.
# Reduced chi-squared =          1.332 for     55 degrees of freedom
# Null hypothesis probability =   5.024768e-02

Photon flux (15-150 keV)    in 115.3 sec: 0.272670 ( -0.023124  0.024398 ) ph/cm2/s
Energy fluence (15-150 keV)             : 2.65784e-06 ( -3.14099e-07  1.5827e-07 ) ergs/cm2
S(25-50 keV) vs. S(50-100 keV) plot

S(25-50 keV)  = 8.16e-07
S(50-100 keV) = 1.26e-06
T90 vs. Hardness ratio plot
T90                                   = 190.471999943256 sec.
Hardness ratio (energy fluence ratio) = 1.54412
Color vs. Color plot
Count Ratio  (25-50 keV) / (15-25 keV) = 1.14278
Count Ratio (50-100 keV) / (15-25 keV) = 1.26202
Mask shadow pattern

IMX = 9.803048729764120E-01, IMY = 3.748571516028201E-02
TIME vs. PHA plot around the trigger time
Blue+Cyan dotted lines: Time interval of the scaled map
From 0.000000 to 64.000000
TIME vs. DetID plot around the trigger time

Blue+Cyan dotted lines: Time interval of the scaled map
From 0.000000 to 64.000000
100 us light curve (15-350 keV)
Blue+Cyan dotted lines: Time interval of the scaled map
From 0.000000 to 64.000000
Spacecraft aspect plot

Bright source in the pre-burst/pre-slew/post-slew images
Pre-burst image of 15-350 keV band
Time interval of the image:
-239.000000 -42.228000

# RAcent  DECcent POSerr Theta    Phi  PeakCts   SNR AngSep     Name
#  [deg]    [deg]    ['] [deg]  [deg]                   [']
138.0279  20.7088    2.6  41.5   64.5   3.5680   4.4 ------	UNKNOWN
258.7585  61.0913    2.8  57.9 -170.8   5.1627   4.2 ------	UNKNOWN
187.4881 -20.2437    3.2  49.6  -29.7   1.7769   3.6 ------	UNKNOWN
223.2529  14.4592    2.6  39.8 -101.4   3.5731   4.4 ------	UNKNOWN
Pre-slew background subtracted image of 15-350 keV band
Time interval of the image:
-42.228000 73.100600

# RAcent  DECcent POSerr Theta    Phi  PeakCts   SNR AngSep     Name
#  [deg]    [deg]    ['] [deg]  [deg]                   [']
195.8344  49.1288    2.4  22.2  178.1   0.7017   4.8 ------	UNKNOWN
167.4225 -12.5991    0.7  44.5   -2.2   3.9479  15.7 ------	UNKNOWN
Post-slew image of 15-350 keV band
Time interval of the image:
133.900600 390.200600

# RAcent  DECcent POSerr Theta    Phi  PeakCts   SNR AngSep     Name
#  [deg]    [deg]    ['] [deg]  [deg]                   [']
135.3492 -40.5724    5.0  39.6   18.4   0.8255   2.3    8.2	Vela X-1
170.1509 -60.5431   13.8  48.0  -22.6   0.3984   0.8    6.8	Cen X-3
186.6001 -62.7536    1.7  52.0  -31.8   4.9656   6.9    1.8	GX 301-2
133.9219  -7.2120    3.5  33.4   75.3   1.5117   3.3 ------	UNKNOWN
189.7934  21.2591    2.9  40.4 -167.6   1.4684   4.1 ------	UNKNOWN
187.2408   3.1709    2.1  25.2 -148.3   1.4257   5.5 ------	UNKNOWN
156.8158 -62.7379    2.3  50.7  -14.5   2.5040   5.0 ------	UNKNOWN
183.1800 -63.0180    2.5  51.6  -29.8   3.0898   4.6 ------	UNKNOWN
207.6761 -21.4346    4.1  39.3  -92.3   2.8049   2.8 ------	UNKNOWN
Plot creation:
Wed Feb  7 15:54:38 EST 2018