Estimated redshift from machine learning (Ukwatta et al. 2016) - may take a few minute to calcaulte
Image
Pre-slew 15.0-350.0 keV image (Event data)

#   RAcent    DECcent   POSerr    Theta     Phi              Peak Cts       SNR   Name
  139.3868   -30.5229   0.0085    31.4838    25.8353         4.7420407     22.817 TRIG_00796100

Foreground time interval of the image:
-70.756  36.749 (delta_t = 107.505 [sec])
Background time interval of the image:
-239.352 -70.756 (delta_t = 168.596 [sec])
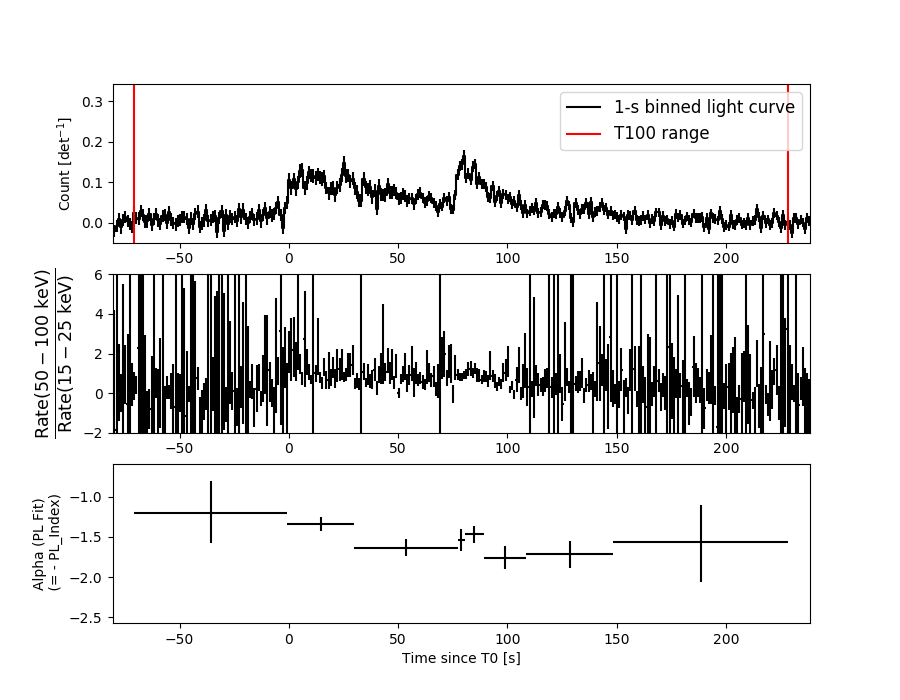
Lightcurves
Notes:
- 1) The mask-weighted light curves are using the flight position.
- 2) Multiple plots of different time binning/intervals are shown to cover all scenarios of short/long GRBs, rate/image triggers, and real/false positives.
- 3) For all the mask-weighted lightcurves, the y-axis units are counts/sec/det where a det is 0.4 x 0.4 = 0.16 sq cm.
- 4) The verticle lines correspond to following: green dotted lines are T50 interval, black dotted lines are T90 interval, blue solid line(s) is a spacecraft slew start time, and orange solid line(s) is a spacecraft slew end time.
- 5) Time of each bin is in the middle of the bin.
1 s binning
From T0-310 s to T0+310 s

From T100_start - 20 s to T100_end + 30 s

Full time interval

64 ms binning
Full time interval

From T100_start to T100_end

From T0-5 sec to T0+5 sec

16 ms binning
From T100_start-5 s to T100_start+5 s

Blue+Cyan dotted lines: Time interval of the scaled map
From 0.000000 to 4.096000
8 ms binning
From T100_start-3 s to T100_start+3 s

Blue+Cyan dotted lines: Time interval of the scaled map
From 0.000000 to 4.096000
2 ms binning
From T100_start-1 s to T100_start+1 s

Blue+Cyan dotted lines: Time interval of the scaled map
From 0.000000 to 4.096000
SN=5 or 10 sec. binning (whichever binning is satisfied first)
SN=5 or 10 sec. binning (T < 200 sec)

Quad-rate summed light curves (from T0-300s to T0+1000s)

Spectral Evolution
Spectra
Notes:
- 1) The fitting includes the systematic errors.
- 2) When the burst includes telescope slew time periods, the fitting uses an average response file made from multiple 5-s response files through out the slew time plus single time preiod for the non-slew times, and weighted by the total counts in the corresponding time period using addrmf. An average response file is needed becuase a spectral fit using the pre-slew DRM will introduce some errors in both a spectral shape and a normalization if the PHA file contains a lot of the slew/post-slew time interval.
- 3) For fits to more complicated models (e.g. a power-law over a cutoff power-law), the BAT team has decided to require a chi-square improvement of more than 6 for each extra dof.
Time averaged spectrum fit using the average DRM
Power-law model

Time interval is from  -70.756 sec. to  228.436 sec.

Spectral model in power-law:
------------------------------------------------------------
Parameters  : value       lower 90%   higher 90%
Photon index: 1.54110     ( -0.0672311   0.0673306 )
Norm@50keV  : 2.57653E-03    ( -9.18242e-05   9.16898e-05 )
------------------------------------------------------------
#Fit statistic : Chi-Squared =          58.44 using 59 PHA bins.
# Reduced chi-squared =          1.025 for     57 degrees of freedom
# Null hypothesis probability =   4.221448e-01

Photon flux (15-150 keV)    in 299.2 sec: 0.325349 ( -0.012267  0.01231 ) ph/cm2/s
Energy fluence (15-150 keV)             : 7.2676e-06 ( -2.78332e-07  2.79354e-07 ) ergs/cm2
Cutoff power-law model
Time interval is from  -70.756 sec. to  228.436 sec.
Spectral model in the cutoff power-law:
------------------------------------------------------------
Parameters  : value       lower 90%   higher 90%
Photon index: 1.48523     ( -0.279627   0.102274 )
Epeak [keV] : 469.016      ( -482.532 -482.532 )
Norm@50keV  : 2.74269E-03    ( -0.000434642   0.000893344 )
------------------------------------------------------------
#Fit statistic : Chi-Squared =          58.31 using 59 PHA bins.
# Reduced chi-squared =          1.041 for     56 degrees of freedom
# Null hypothesis probability =   3.905639e-01

Photon flux (15-150 keV)    in 299.2 sec: 0.324141 ( -0.013374  0.006715 ) ph/cm2/s
Energy fluence (15-150 keV)             : 7.23439e-06 ( -3.0218e-07  2.8741e-07 ) ergs/cm2
Band function

Time interval is from  -70.756 sec. to  228.436 sec.


Spectral model in the Band function:
------------------------------------------------------------
Parameters  : value       lower 90%   higher 90%
alpha       :    (     )
beta        :     (     )
Epeak [keV] :       (   )
Norm@50keV   :     (     )
------------------------------------------------------------

Photon flux (15-150 keV)    in  sec:  (    ) ph/cm2/s
Energy fluence (15-150 keV)             : 0 ( 0  0 ) ergs/cm2
Single BB

Spectral model blackbody:
------------------------------------------------------------
Parameters  : value    Lower 90%  Upper 90%
kT [keV]    : 15.3843  (  )
R^2/D10^2   : 3.19834E-02  (   )
(R is the radius in km and D10 is the distance to the source in units of 10 kpc)
------------------------------------------------------------
#Fit statistic : Chi-Squared =         250.47 using 59 PHA bins.
# Reduced chi-squared =         4.3942 for     57 degrees of freedom
# Null hypothesis probability =   4.429202e-26

Energy  Fluence     90% Error
[keV]   [erg/cm2]   [erg/cm2]
15- 25  4.721e-07   3.411e-08
25- 50  1.919e-06   9.126e-08
50-150  3.126e-06   2.322e-07
15-150  5.517e-06   2.274e-07
Thermal bremsstrahlung (OTTB)

Spectral model: thermal bremsstrahlung
------------------------------------------------------------
Parameters  : value         Lower 90%    Upper 90%
kT [keV]    : 200.000       (-23.4971      -200)
Norm        : 1.31884       (-0.0464261     0.0464261)
------------------------------------------------------------
#Fit statistic : Chi-Squared =          61.38 using 59 PHA bins.
# Reduced chi-squared =          1.077 for     57 degrees of freedom
# Null hypothesis probability =   3.218949e-01

Energy  Fluence     90% Error
[keV]   [erg/cm2]   [erg/cm2]
15- 25  9.829e-07   4.084e-08
25- 50  1.891e-06   7.166e-08
50-150  4.147e-06   1.631e-07
15-150  7.020e-06   2.887e-07
Double BB

Spectral model: bbodyrad<1> + bbodyrad<2>
------------------------------------------------------------
Parameters  : value         Lower 90%    Upper 90%
kT1 [keV]   : 7.24367        (-0.844571      0.926078)
R1^2/D10^2  : 0.311642        (-0.103139      0.170153)
kT2 [keV]   : 28.6615        (-3.67103      5.38034)
R2^2/D10^2  : 2.94017E-03    (-0.00129382   0.00184419)
------------------------------------------------------------
#Fit statistic : Chi-Squared =          61.22 using 59 PHA bins.
# Reduced chi-squared =          1.113 for     55 degrees of freedom
# Null hypothesis probability =   2.625640e-01

Energy  Fluence     90% Error
[keV]   [erg/cm2]   [erg/cm2]
15- 25  9.295e-07   1.082e-07
25- 50  1.892e-06   1.535e-07
50-150  4.371e-06   5.715e-07
15-150  7.193e-06   6.612e-07
Peak spectrum fit
Power-law model
Time interval is from   79.516 sec. to   80.516 sec.

Spectral model in power-law:
------------------------------------------------------------
Parameters  : value       lower 90%   higher 90%
Photon index: 1.44024     ( -0.191837   0.194826 )
Norm@50keV  : 1.19317E-02    ( -0.0014136   0.00140137 )
------------------------------------------------------------
#Fit statistic : Chi-Squared =          47.84 using 59 PHA bins.
# Reduced chi-squared =         0.8393 for     57 degrees of freedom
# Null hypothesis probability =   8.010027e-01

Photon flux (15-150 keV)    in 1 sec: 1.46692 ( -0.16637  0.16643 ) ph/cm2/s
Energy fluence (15-150 keV)             : 1.14401e-07 ( -1.50985e-08  1.5302e-08 ) ergs/cm2
Cutoff power-law model

Time interval is from   79.516 sec. to   80.516 sec.
Spectral model in the cutoff power-law:
------------------------------------------------------------
Parameters  : value       lower 90%   higher 90%
Photon index: 0.992719     ( -0.94697   0.547402 )
Epeak [keV] : 108.198      ( -46.1001 -108.221 )
Norm@50keV  : 2.05166E-02    ( -0.00968408   0.0433367 )
------------------------------------------------------------
#Fit statistic : Chi-Squared =          46.90 using 59 PHA bins.
# Reduced chi-squared =         0.8375 for     56 degrees of freedom
# Null hypothesis probability =   8.017112e-01

Photon flux (15-150 keV)    in 1 sec: 1.44323 ( -0.17273  0.17175 ) ph/cm2/s
Energy fluence (15-150 keV)             : 1.09959e-07 ( -1.73443e-08  1.71452e-08 ) ergs/cm2
Band function

Time interval is from   79.516 sec. to   80.516 sec.


Spectral model in the Band function:
------------------------------------------------------------
Parameters  : value       lower 90%   higher 90%
alpha       :    (     )
beta        :     (     )
Epeak [keV] :       (   )
Norm@50keV   :     (     )
------------------------------------------------------------

Photon flux (15-150 keV)    in  sec:  (    ) ph/cm2/s
Energy fluence (15-150 keV)             : 0 ( 0  0 ) ergs/cm2
Single BB

Spectral model blackbody:
------------------------------------------------------------
Parameters  : value    Lower 90%  Upper 90%
kT [keV]    : 14.1482  (-1.85147  2.23199)
R^2/D10^2   : 0.208385  (-0.0834432   0.131754)
(R is the radius in km and D10 is the distance to the source in units of 10 kpc)
------------------------------------------------------------
#Fit statistic : Chi-Squared =          59.46 using 59 PHA bins.
# Reduced chi-squared =          1.043 for     57 degrees of freedom
# Null hypothesis probability =   3.861017e-01

Energy  Fluence     90% Error
[keV]   [erg/cm2]   [erg/cm2]
15- 25  8.802e-09   1.849e-09
25- 50  3.308e-08   4.900e-09
50-150  4.384e-08   1.023e-08
15-150  8.572e-08   1.306e-08
Thermal bremsstrahlung (OTTB)

Spectral model: thermal bremsstrahlung
------------------------------------------------------------
Parameters  : value         Lower 90%    Upper 90%
kT [keV]    : 200.000       (-65.6094      -200)
Norm        : 6.01559       (-0.678178     0.678178)
------------------------------------------------------------
#Fit statistic : Chi-Squared =          47.76 using 59 PHA bins.
# Reduced chi-squared =         0.8379 for     57 degrees of freedom
# Null hypothesis probability =   8.033626e-01

Energy  Fluence     90% Error
[keV]   [erg/cm2]   [erg/cm2]
15- 25  1.498e-08   7.842e-09
25- 50  2.882e-08   1.592e-08
50-150  6.320e-08   3.466e-08
15-150  1.070e-07   5.930e-08
Double BB

Spectral model: bbodyrad<1> + bbodyrad<2>
------------------------------------------------------------
Parameters  : value         Lower 90%    Upper 90%
kT1 [keV]   : 10.0329        (-5.25083      2.8227)
R1^2/D10^2  : 0.531999        (-0.285058      3.43255)
kT2 [keV]   : 45.0166        (-43.5714      -48.5267)
R2^2/D10^2  : 2.83551E-03    (-0.00212351   0.070873)
------------------------------------------------------------
#Fit statistic : Chi-Squared =          47.41 using 59 PHA bins.
# Reduced chi-squared =         0.8620 for     55 degrees of freedom
# Null hypothesis probability =   7.566814e-01

Energy  Fluence     90% Error
[keV]   [erg/cm2]   [erg/cm2]
15- 25  1.160e-08   4.525e-09
25- 50  3.206e-08   1.368e-08
50-150  6.688e-08   3.564e-08
15-150  1.105e-07   4.962e-08
Pre-slew spectrum (Pre-slew PHA with pre-slew DRM)
Power-law model

Spectral model in power-law:
------------------------------------------------------------
Parameters  : value       lower 90%   higher 90%
Photon index: 1.36300     ( -0.102985   0.102379 )
Norm@50keV  : 2.98773E-03    ( -0.000169184   0.000169119 )
------------------------------------------------------------
#Fit statistic : Chi-Squared =          84.19 using 59 PHA bins.
# Reduced chi-squared =          1.477 for     57 degrees of freedom
# Null hypothesis probability =   1.109833e-02

Photon flux (15-150 keV)    in 107.5 sec: 0.360911 ( -0.0214124  0.0214712 ) ph/cm2/s
Energy fluence (15-150 keV)             : 3.12787e-06 ( -1.93949e-07  1.95112e-07 ) ergs/cm2
Cutoff power-law model
Spectral model in the cutoff power-law:
------------------------------------------------------------
Parameters  : value       lower 90%   higher 90%
Photon index: 1.35961     ( -0.348557   0.150769 )
Epeak [keV] : 9997.80      ( -9997.77 -9997.77 )
Norm@50keV  : 2.99917E-03    ( -0.00016972   0.00160241 )
------------------------------------------------------------
#Fit statistic : Chi-Squared =          84.19 using 59 PHA bins.
# Reduced chi-squared =          1.503 for     56 degrees of freedom
# Null hypothesis probability =   8.769986e-03

Photon flux (15-150 keV)    in 107.5 sec: 0.360691 ( -0.022334  0.021425 ) ph/cm2/s
Energy fluence (15-150 keV)             : 3.13156e-06 ( -2.15097e-07  1.90329e-07 ) ergs/cm2
Band function
Spectral model in the Band function:
------------------------------------------------------------
Parameters  : value       lower 90%   higher 90%
alpha       :    (     )
beta        :     (     )
Epeak [keV] :       (   )
Norm@50keV   :     (     )
------------------------------------------------------------

Photon flux (15-150 keV)    in  sec:  (    ) ph/cm2/s
Energy fluence (15-150 keV)             : 0 ( 0  0 ) ergs/cm2
S(25-50 keV) vs. S(50-100 keV) plot

S(25-50 keV)  = 1.83e-06
S(50-100 keV) = 2.52e-06
T90 vs. Hardness ratio plot

T90                                   = 161.647999942303 sec.
Hardness ratio (energy fluence ratio) = 1.37705
Color vs. Color plot

Count Ratio  (25-50 keV) / (15-25 keV) = 1.35089
Count Ratio (50-100 keV) / (15-25 keV) = 1.00455
Mask shadow pattern
IMX = 5.512023442474684E-01, IMY = -2.668801861278758E-01
TIME vs. PHA plot around the trigger time

Blue+Cyan dotted lines: Time interval of the scaled map
From 0.000000 to 4.096000
TIME vs. DetID plot around the trigger time

Blue+Cyan dotted lines: Time interval of the scaled map
From 0.000000 to 4.096000
100 us light curve (15-350 keV)

Blue+Cyan dotted lines: Time interval of the scaled map
From 0.000000 to 4.096000
Spacecraft aspect plot
Bright source in the pre-burst/pre-slew/post-slew images
Pre-burst image of 15-350 keV band
Time interval of the image:
-239.352000 -70.756000

# RAcent  DECcent POSerr Theta    Phi  PeakCts   SNR AngSep     Name
#  [deg]    [deg]    ['] [deg]  [deg]                   [']
135.5297 -40.7496  171.0  39.7   13.9  -0.0179  -0.1   11.7	Vela X-1
170.3707 -60.6066    6.2  48.1  -26.9   0.6900   1.9    1.9	Cen X-3
186.5721 -62.8162    2.9  52.1  -35.9   2.8176   3.9    3.6	GX 301-2
156.6379  35.7167    2.2  49.3  143.6   4.6091   5.1 ------	UNKNOWN
188.1744   1.7534    2.6  25.1 -148.2   0.8783   4.4 ------	UNKNOWN
194.7405  -1.4848    2.3  29.3 -134.9   1.1028   5.1 ------	UNKNOWN
208.3997  28.3111    2.9  56.9 -161.3   4.1173   4.0 ------	UNKNOWN
204.9182 -39.1996    2.2  42.5  -69.2   3.8853   5.2 ------	UNKNOWN
Pre-slew background subtracted image of 15-350 keV band
Time interval of the image:
-70.756000 36.748590

# RAcent  DECcent POSerr Theta    Phi  PeakCts   SNR AngSep     Name
#  [deg]    [deg]    ['] [deg]  [deg]                   [']
135.5142 -40.4060   34.3  39.5   14.3  -0.0807  -0.3    8.9	Vela X-1
170.3076 -60.7217   10.6  48.2  -26.8  -0.3470  -1.1    5.9	Cen X-3
186.3357 -62.8258    3.9  52.1  -35.7  -1.9399  -3.0    9.4	GX 301-2
139.3868 -30.5229    0.5  31.5   25.8   4.7413  22.8 ------	UNKNOWN
189.5588  33.8823    2.2  51.0  178.9   2.3199   5.2 ------	UNKNOWN
143.9417 -56.2149    1.7  47.3   -7.4   1.8964   6.7 ------	UNKNOWN
Post-slew image of 15-350 keV band
Time interval of the image:
88.348620 482.687200

# RAcent  DECcent POSerr Theta    Phi  PeakCts   SNR AngSep     Name
#  [deg]    [deg]    ['] [deg]  [deg]                   [']
135.4597 -40.5459    2.3  10.5  -17.1   2.9467   5.0    3.2	Vela X-1
170.5676 -60.6211   13.6  36.5  -59.0   1.0258   0.8    7.4	Cen X-3
186.5890 -62.6561    3.0  43.9  -62.8  10.8899   3.8    7.1	GX 301-2
149.6478  20.8266    2.5  52.3  158.5  13.0599   4.7 ------	UNKNOWN
152.9892  22.7919    2.8  54.9  161.7  15.0217   4.1 ------	UNKNOWN
 79.3791 -48.6969    3.3  48.3   16.3   4.7672   3.5 ------	UNKNOWN
139.3360 -30.5277    2.2   0.0   69.1   3.1310   5.3 ------	UNKNOWN
157.3476  -5.6528    2.7  30.1 -175.9   2.8282   4.3 ------	UNKNOWN
164.1295 -49.6960    3.2  26.7  -70.8   2.9952   3.5 ------	UNKNOWN
 68.0953 -78.4186    2.2  56.4  -20.5  12.9734   5.2 ------	UNKNOWN
160.6256 -74.9883    2.6  45.7  -41.2   5.8428   4.5 ------	UNKNOWN
186.6108 -11.1897    3.3  47.7 -137.1   7.1134   3.5 ------	UNKNOWN
Plot creation:
Sat Jan 20 10:14:17 EST 2018