Estimated redshift from machine learning (Ukwatta et al. 2016) - may take a few minutes to calcaulte
Image
Pre-slew 15-350 keV image (Event data; bkg subtracted)

#   RAcent  DECcent POSerr  Theta    Phi     Peak Cts     SNR  Name
  134.8369 -55.2321 0.0443   24.9  -27.6       0.5235     4.3  TRIG_00796115
------------------------------------------

Foreground time interval of the image:
  0.000  66.000 (delta_t =  66.000 [sec])
Background time interval of the image:
-239.000   0.000 (delta_t = 239.000 [sec])
Lightcurves
Notes:
- 1) All plots contain as much data as has been downloaded to date.
- 2) The mask-weighted light curves are using the flight position.
- 3) Multiple plots of different time binning/intervals are shown to cover all scenarios of short/long GRBs, rate/image triggers, and real/false positives.
- 4) For all the mask-weighted lightcurves, the y-axis units are counts/sec/det where a det is 0.4 x 0.4 = 0.16 sq cm.
- 5) The verticle lines correspond to following: green dotted lines are T50 interval, black dotted lines are T90 interval, blue solid line(s) is a spacecraft slew start time, and orange solid line(s) is a spacecraft slew end time.
- 6) Time of each bin is in the middle of the bin.
1 s binning
From T0-310 s to T0+310 s

From T100_start - 20 s to T100_end + 30 s

Full time interval

64 ms binning
Full time interval

From T100_start to T100_end

From T0-5 sec to T0+5 sec

16 ms binning
From T100_start-5 s to T100_start+5 s

Blue+Cyan dotted lines: Time interval of the scaled map
From 0.000000 to 64.000000
8 ms binning
From T100_start-3 s to T100_start+3 s

Blue+Cyan dotted lines: Time interval of the scaled map
From 0.000000 to 64.000000
2 ms binning
From T100_start-1 s to T100_start+1 s

Blue+Cyan dotted lines: Time interval of the scaled map
From 0.000000 to 64.000000
SN=5 or 10 sec. binning (whichever binning is satisfied first)

SN=5 or 10 sec. binning (T < 200 sec)

Spectra
Notes:
- 1) The fitting includes the systematic errors.
- 2) For long bursts, a spectral fit of the pre-slew DRM will introduce some errors in both a spectral shape and a normalization if the PHA file contains a lot of the slew/post-slew time interval.
- 3) For fits to more complicated models (e.g. a power-law over a cutoff power-law), the BAT team has decided to require a chi-square improvement of more than 6 for each extra dof.
- 4) For short bursts (T90<1sec), the specrtum is also fit with Blackbody, OTTB, and Double Blackbody.
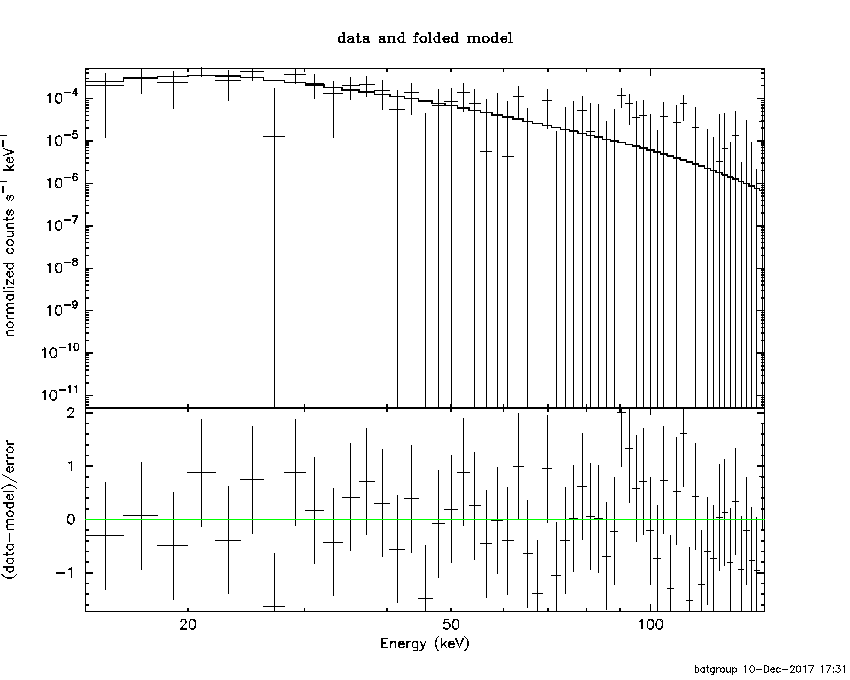
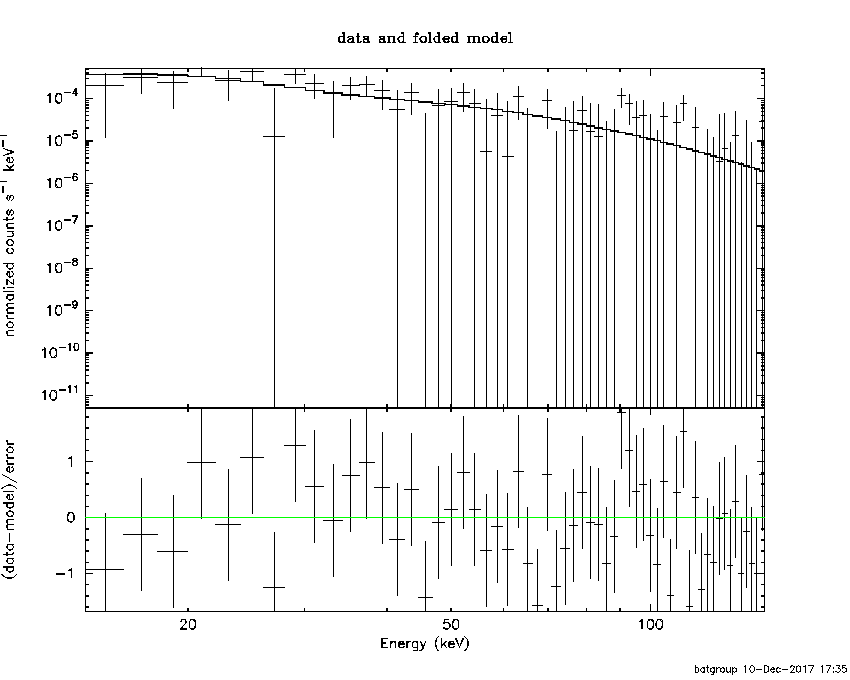
Time averaged spectrum fit using the pre-slew DRM
Power-law model

Time interval is from    0.000 sec. to   66.000 sec.

Spectral model in power-law:
------------------------------------------------------------
Parameters  : value       lower 90%   higher 90%
Photon index: 2.05021     ( -0.45145   0.524569 )
Norm@50keV  : 4.78484E-04    ( -0.000174958   0.000170791 )
------------------------------------------------------------
#Fit statistic : Chi-Squared =          40.66 using 59 PHA bins.
# Reduced chi-squared =         0.7133 for     57 degrees of freedom
# Null hypothesis probability =   9.498694e-01

Photon flux (15-150 keV)    in 66 sec: 7.34802E-02 ( -0.0195814  0.0195966 ) ph/cm2/s
Energy fluence (15-150 keV)             : 2.92132e-07 ( -9.49991e-08  1.02491e-07 ) ergs/cm2
Cutoff power-law model

Time interval is from    0.000 sec. to   66.000 sec.
Spectral model in the cutoff power-law:
------------------------------------------------------------
Parameters  : value       lower 90%   higher 90%
Photon index: -0.274435     ( -7.08838   2.50699 )
Epeak [keV] : 34.1589      ( -34.0798 -34.0798 )
Norm@50keV  : 1.49103E-02    ( -0.0177094   954.96 )
------------------------------------------------------------
#Fit statistic : Chi-Squared =          38.26 using 59 PHA bins.
# Reduced chi-squared =         0.6832 for     56 degrees of freedom
# Null hypothesis probability =   9.664469e-01

Photon flux (15-150 keV)    in 66 sec: 6.95162E-02 ( -0.0191273  0.019761 ) ph/cm2/s
Energy fluence (15-150 keV)             : 2.28202e-07 ( -7.32118e-08  1.17619e-07 ) ergs/cm2
Band function

Time interval is from    0.000 sec. to   66.000 sec.

Spectral model in the Band function:
------------------------------------------------------------
Parameters  : value       lower 90%   higher 90%
alpha       : 1.49324   ( -3.51418   -1.52635 )
beta        : -3.14715    ( 3.15752   1.25692 )
Epeak [keV] : 31.6420      ( -13.8862 28.0616 )
Norm@50keV   : 0.110275    ( -0.133568   18.9326 )
------------------------------------------------------------
#Fit statistic : Chi-Squared =          37.70 using 59 PHA bins.
# Reduced chi-squared =         0.6854 for     55 degrees of freedom
# Null hypothesis probability =   9.639052e-01

Photon flux (15-150 keV)    in 66 sec: 6.99286E-02 (    ) ph/cm2/s
Energy fluence (15-150 keV)             : 2.54091e-07 ( -2.53629e-07  -9.22046e-08 ) ergs/cm2
Single BB

Spectral model blackbody:
------------------------------------------------------------
Parameters  : value    Lower 90%  Upper 90%
kT [keV]    : 8.49627  (-1.90349  2.57429)
R^2/D10^2   : 6.86554E-02  (-0.0445439   0.115437)
(R is the radius in km and D10 is the distance to the source in units of 10 kpc)
------------------------------------------------------------
#Fit statistic : Chi-Squared =          38.30 using 59 PHA bins.
# Reduced chi-squared =         0.6720 for     57 degrees of freedom
# Null hypothesis probability =   9.729480e-01

Energy  Fluence     90% Error
[keV]   [erg/cm2]   [erg/cm2]
15- 25  6.163e-08   3.610e-08
25- 50  1.194e-07   6.917e-08
50-150  3.808e-08   2.939e-08
15-150  2.191e-07   1.114e-07
Thermal bremsstrahlung (OTTB)

Spectral model: thermal bremsstrahlung
------------------------------------------------------------
Parameters  : value         Lower 90%    Upper 90%
kT [keV]    : 51.7116       (-25.1163      81.2713)
Norm        : 0.418408       (-0.148861     0.247565)
------------------------------------------------------------
#Fit statistic : Chi-Squared =          39.18 using 59 PHA bins.
# Reduced chi-squared =         0.6873 for     57 degrees of freedom
# Null hypothesis probability =   9.655897e-01

Energy  Fluence     90% Error
[keV]   [erg/cm2]   [erg/cm2]
15- 25  6.803e-08   2.910e-08
25- 50  9.887e-08   4.940e-08
50-150  9.905e-08   7.420e-08
15-150  2.659e-07   1.487e-07
Double BB
------------------------------------------------------------
Parameters  : value         Lower 90%    Upper 90%
kT1 [keV]   : 24.7746        (-24.2643      -24.2643)
R1^2/D10^2  : 3.47284E-04        (-0.000359615      0.161396)
kT2 [keV]   : 7.56552        (-7.56619      3.06166)
R2^2/D10^2  : 9.52137E-02    (-0.09501   -0.09501)
------------------------------------------------------------
#Fit statistic : Chi-Squared =          38.07 using 59 PHA bins.
#Fit statistic : Chi-Squared =          37.65 using 59 PHA bins.
# Reduced chi-squared =         0.6921 for     55 degrees of freedom
# Reduced chi-squared =         0.6846 for     55 degrees of freedom
# Null hypothesis probability =   9.602046e-01
# Null hypothesis probability =   9.643478e-01

Energy  Fluence     90% Error
[keV]   [erg/cm2]   [erg/cm2]
15- 25  6.374e-08   1.831e-07
25- 50  1.149e-07   6.201e-07
50-150  5.500e-08   1.156e-06
15-150  2.336e-07   2.059e-06
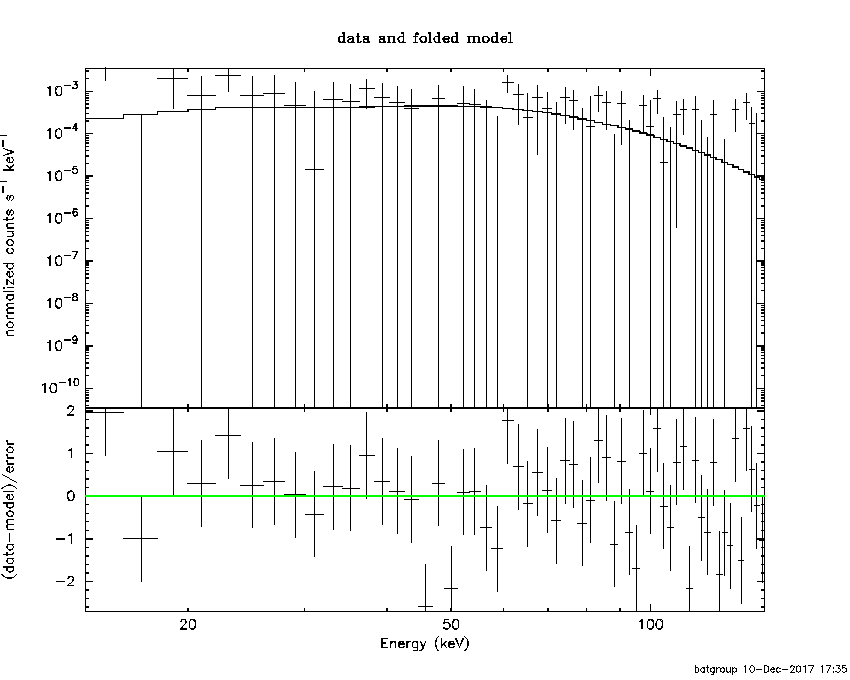
Peak spectrum fit
Power-law model

Time interval is from   17.000 sec. to   18.000 sec.

Spectral model in power-law:
------------------------------------------------------------
Parameters  : value       lower 90%   higher 90%
Photon index: 1.50744     ( -1.08661   1.27811 )
Norm@50keV  : 2.46421E-03    ( -0.0024642   0.00128834 )
------------------------------------------------------------
#Fit statistic : Chi-Squared =          62.29 using 59 PHA bins.
# Reduced chi-squared =          1.093 for     57 degrees of freedom
# Null hypothesis probability =   2.937257e-01

Photon flux (15-150 keV)    in 1 sec: 0.308251 ( -0.308251  0.157216 ) ph/cm2/s
Energy fluence (15-150 keV)             : 2.33489e-08 ( -1.35704e-08  1.43851e-08 ) ergs/cm2
Cutoff power-law model

Time interval is from   17.000 sec. to   18.000 sec.
Spectral model in the cutoff power-law:
------------------------------------------------------------
Parameters  : value       lower 90%   higher 90%
Photon index: 3.90442     ( -1.10024   1.28111 )
Epeak [keV] : 450.641      ( -9999.36 -9999.36 )
Norm@50keV  : 1.86341E-04    (     )
------------------------------------------------------------
#Fit statistic : Chi-Squared =          62.03 using 59 PHA bins.
# Reduced chi-squared =          1.108 for     56 degrees of freedom
# Null hypothesis probability =   2.699859e-01

Photon flux (15-150 keV)    in 1 sec: 0.309249 ( -0.309249  0.156113 ) ph/cm2/s
Energy fluence (15-150 keV)             : 2.33681e-08 ( -1.36238e-08  1.42526e-08 ) ergs/cm2
Band function

Time interval is from   17.000 sec. to   18.000 sec.

Spectral model in the Band function:
------------------------------------------------------------
Parameters  : value       lower 90%   higher 90%
alpha       : -1.51513   ( -2.00092   2.80595 )
beta        : -9.37110    ( 9.3711   9.3711 )
Epeak [keV] : 9999.36      ( -9983.79 -9999.36 )
Norm@50keV   : 2.46505E-03    ( -0.00135878   0.111574 )
------------------------------------------------------------
#Fit statistic : Chi-Squared =          62.29 using 59 PHA bins.
# Reduced chi-squared =          1.132 for     55 degrees of freedom
# Null hypothesis probability =   2.329436e-01

Photon flux (15-150 keV)    in 1 sec:  (    ) ph/cm2/s
Energy fluence (15-150 keV)             : 3.82043e-09 ( 0  0 ) ergs/cm2
Single BB
Spectral model blackbody:
------------------------------------------------------------
Parameters  : value    Lower 90%  Upper 90%
kT [keV]    : 21.9629  (-21.9717  33.2376)
R^2/D10^2   : 9.53424E-03  (-0.00952334   1.32752)
(R is the radius in km and D10 is the distance to the source in units of 10 kpc)
------------------------------------------------------------
#Fit statistic : Chi-Squared =          64.00 using 59 PHA bins.
# Reduced chi-squared =          1.123 for     57 degrees of freedom
# Null hypothesis probability =   2.443855e-01

Energy  Fluence     90% Error
[keV]   [erg/cm2]   [erg/cm2]
15- 25  8.518e-10   5.910e-10
25- 50  4.500e-09   2.987e-09
50-150  1.622e-08   1.223e-08
15-150  2.157e-08   1.503e-08
Thermal bremsstrahlung (OTTB)
Spectral model: thermal bremsstrahlung
------------------------------------------------------------
Parameters  : value         Lower 90%    Upper 90%
kT [keV]    : 199.363       (-199.363      -199.363)
Norm        : 1.24997       (-0.631539     1.20901)
------------------------------------------------------------
#Fit statistic : Chi-Squared =          62.44 using 59 PHA bins.
# Reduced chi-squared =          1.095 for     57 degrees of freedom
# Null hypothesis probability =   2.891168e-01

Energy  Fluence     90% Error
[keV]   [erg/cm2]   [erg/cm2]
15- 25  3.113e-09   2.045e-09
25- 50  5.987e-09   3.996e-09
50-150  1.313e-08   8.845e-09
15-150  2.223e-08   1.539e-08
Double BB
# Reduced chi-squared =          1.095 for     55 degrees of freedom
# Reduced chi-squared =          1.094 for     55 degrees of freedom
# Reduced chi-squared =          1.094 for     55 degrees of freedom
# Null hypothesis probability =   2.602180e-01
# Null hypothesis probability =   2.664828e-01
# Null hypothesis probability =   2.681824e-01
# Null hypothesis probability =   2.770727e-01
# Null hypothesis probability =   2.839418e-01
# Null hypothesis probability =   2.886483e-01
# Null hypothesis probability =   2.914540e-01
# Null hypothesis probability =   2.930821e-01
# Null hypothesis probability =   2.939724e-01
# Null hypothesis probability =   2.944502e-01

Energy  Fluence     90% Error
[keV]   [erg/cm2]   [erg/cm2]
15- 25  3.834e-09   2.580e-09
25- 50  4.731e-09   2.522e-09
50-150  1.690e-08   1.147e-08
15-150  2.547e-08   1.513e-08
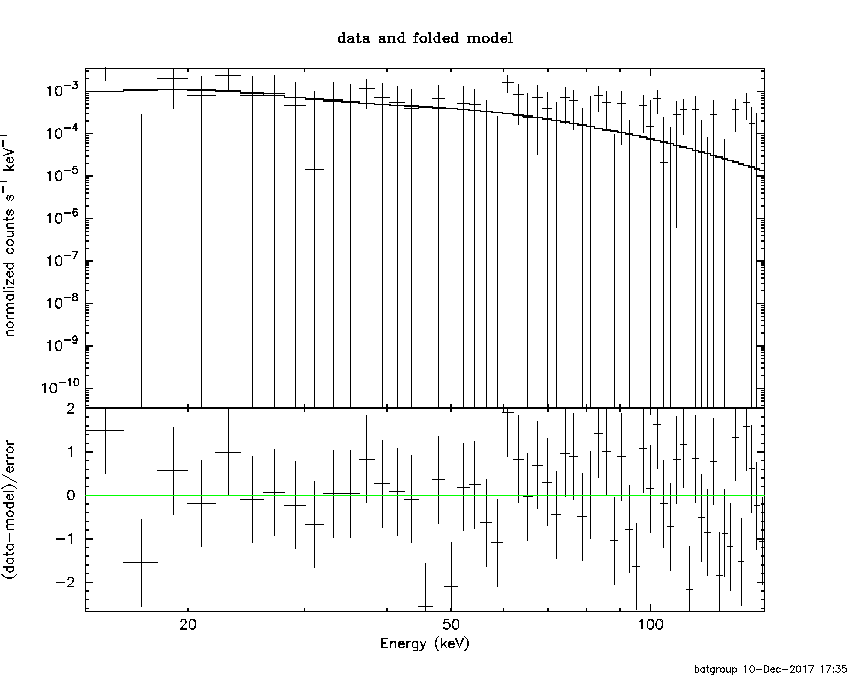
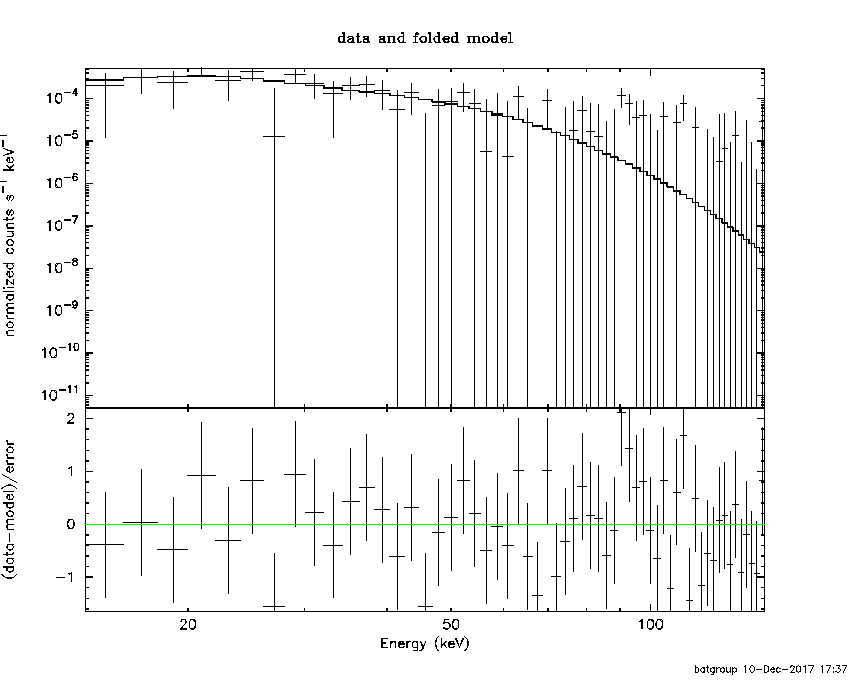
Pre-slew spectrum (Pre-slew PHA with pre-slew DRM)
Power-law model
Spectral model in power-law:
------------------------------------------------------------
Parameters  : value       lower 90%   higher 90%
Photon index: 2.05021     ( -0.45145   0.524569 )
Norm@50keV  : 4.78484E-04    ( -0.000174958   0.000170791 )
------------------------------------------------------------
#Fit statistic : Chi-Squared =          40.66 using 59 PHA bins.
# Reduced chi-squared =         0.7133 for     57 degrees of freedom
# Null hypothesis probability =   9.498694e-01

Photon flux (15-150 keV)    in 66 sec: 7.34802E-02 ( -0.0195814  0.0195966 ) ph/cm2/s
Energy fluence (15-150 keV)             : 2.92132e-07 ( -9.49991e-08  1.02491e-07 ) ergs/cm2
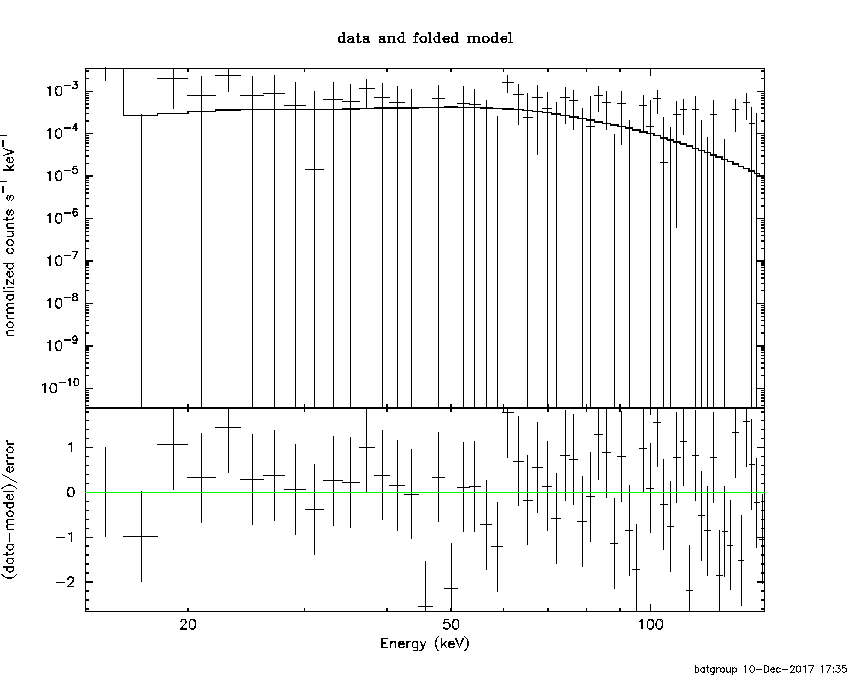
Cutoff power-law model
Spectral model in the cutoff power-law:
------------------------------------------------------------
Parameters  : value       lower 90%   higher 90%
Photon index: -0.274435     ( -7.08838   2.50699 )
Epeak [keV] : 34.1589      ( -34.0798 -34.0798 )
Norm@50keV  : 1.49103E-02    ( -0.0177094   954.96 )
------------------------------------------------------------
#Fit statistic : Chi-Squared =          38.26 using 59 PHA bins.
# Reduced chi-squared =         0.6832 for     56 degrees of freedom
# Null hypothesis probability =   9.664469e-01

Photon flux (15-150 keV)    in 66 sec: 6.95162E-02 ( -0.0191273  0.019761 ) ph/cm2/s
Energy fluence (15-150 keV)             : 2.28202e-07 ( -7.32118e-08  1.17619e-07 ) ergs/cm2
Band function

Spectral model in the Band function:
------------------------------------------------------------
Parameters  : value       lower 90%   higher 90%
alpha       : 2.79233   ( -3.35996   -1.32614 )
beta        : -3.18017    ( 3.13994   1.24133 )
Epeak [keV] : 30.6949      ( -14.1495 27.7964 )
Norm@50keV   : 0.894275    ( -0.890367   18.1672 )
------------------------------------------------------------
#Fit statistic : Chi-Squared =          37.67 using 59 PHA bins.
# Reduced chi-squared =         0.6849 for     55 degrees of freedom
# Null hypothesis probability =   9.641880e-01

Photon flux (15-150 keV)    in 66 sec: 6.99286E-02 (    ) ph/cm2/s
Energy fluence (15-150 keV)             : 2.54091e-07 ( -2.53629e-07  -9.22046e-08 ) ergs/cm2
S(25-50 keV) vs. S(50-100 keV) plot

S(25-50 keV)  = 8.92e-08
S(50-100 keV) = 8.62e-08
T90 vs. Hardness ratio plot

T90                                   = 63 sec.
Hardness ratio (energy fluence ratio) = 0.966368
Color vs. Color plot

Count Ratio  (25-50 keV) / (15-25 keV) = 1.12576
Count Ratio (50-100 keV) / (15-25 keV) = 0.43251
Mask shadow pattern

IMX = 4.116222879512755E-01, IMY = 2.149009300493741E-01
TIME vs. PHA plot around the trigger time
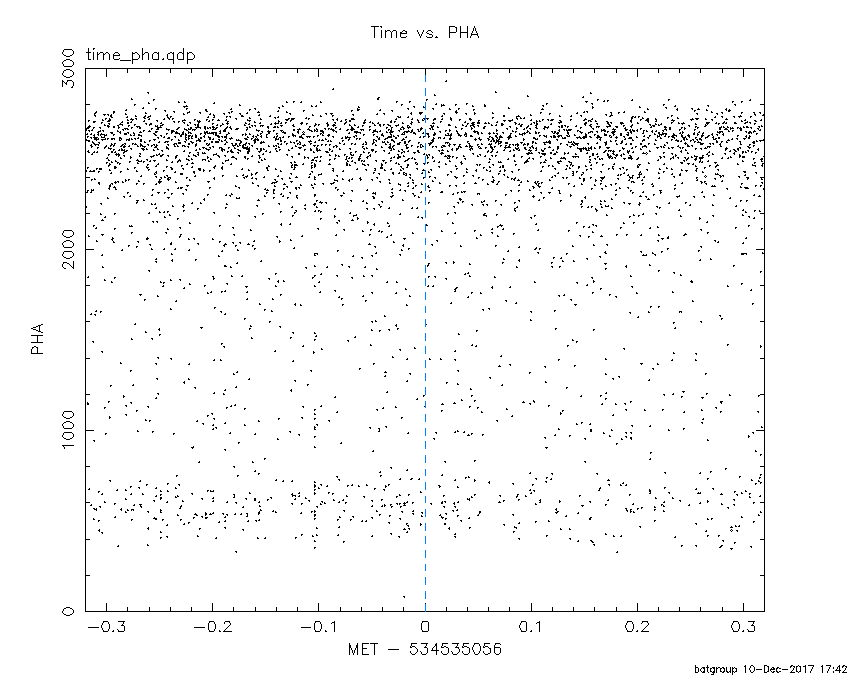
Blue+Cyan dotted lines: Time interval of the scaled map
From 0.000000 to 64.000000
TIME vs. DetID plot around the trigger time

Blue+Cyan dotted lines: Time interval of the scaled map
From 0.000000 to 64.000000
100 us light curve (15-350 keV)

Blue+Cyan dotted lines: Time interval of the scaled map
From 0.000000 to 64.000000
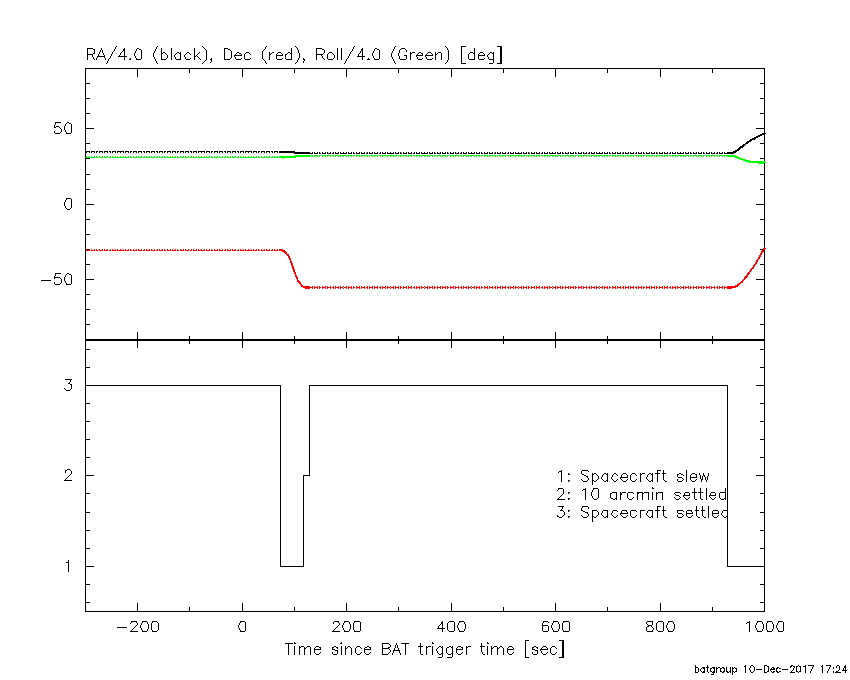
Spacecraft aspect plot
Bright source in the pre-burst/pre-slew/post-slew images
Pre-burst image of 15-350 keV band
Time interval of the image:
-239.000000 0.000000

# RAcent  DECcent POSerr Theta    Phi  PeakCts   SNR AngSep     Name
#  [deg]    [deg]    ['] [deg]  [deg]                   [']
135.4957 -40.5301    1.5  10.5  -17.4   1.6142   7.7    2.1	Vela X-1
170.3610 -60.6107   80.4  36.4  -58.9  -0.0607  -0.1    1.5	Cen X-3
186.5973 -62.7228    5.0  44.0  -62.7   2.6915   2.3    3.3	GX 301-2
174.7783 -23.1896    3.0  32.3 -128.1   1.1779   3.9 ------	UNKNOWN
Pre-slew background subtracted image of 15-350 keV band
Time interval of the image:
0.000000 66.000000

# RAcent  DECcent POSerr Theta    Phi  PeakCts   SNR AngSep     Name
#  [deg]    [deg]    ['] [deg]  [deg]                   [']
135.3220 -40.6263    5.8  10.6  -16.8  -0.2158  -2.0   10.3	Vela X-1
170.6422 -60.5802    5.9  36.5  -59.1   0.3980   1.9   10.0	Cen X-3
186.4714 -62.6819    8.2  43.9  -62.7   0.7370   1.4    7.4	GX 301-2
 89.5796 -65.3380    1.9  46.1   -7.4   1.0761   6.0 ------	UNKNOWN
167.6942 -22.8067    1.9  26.4 -133.8   0.8037   6.1 ------	UNKNOWN
Post-slew image of 15-350 keV band
Time interval of the image:
118.200600 699.610000
701.000000 839.840000
841.000000 898.850400
901.000000 929.900620

# RAcent  DECcent POSerr Theta    Phi  PeakCts   SNR AngSep     Name
#  [deg]    [deg]    ['] [deg]  [deg]                   [']
135.5080 -40.5481    0.9  14.7  143.8   6.7745  13.0    1.0	Vela X-1
170.3386 -60.5805    3.4  19.4  -97.8   2.3057   3.4    2.6	Cen X-3
186.6308 -62.7647    1.1  26.9  -91.0   9.4764  10.6    0.8	GX 301-2
189.2079 -23.8872    2.4  50.5 -143.9   9.3011   4.8 ------	UNKNOWN
234.0761 -69.4953    3.4  42.5  -69.1   8.0266   3.4 ------	UNKNOWN
288.6940 -74.0445    3.7  49.5  -47.5   8.1819   3.1 ------	UNKNOWN
Plot creation:
Sun Dec 10 17:44:37 EST 2017