Estimated redshift from machine learning (Ukwatta et al. 2016) - may take a few minute to calcaulte
Image
Pre-slew 15.0-350.0 keV image (Event data)
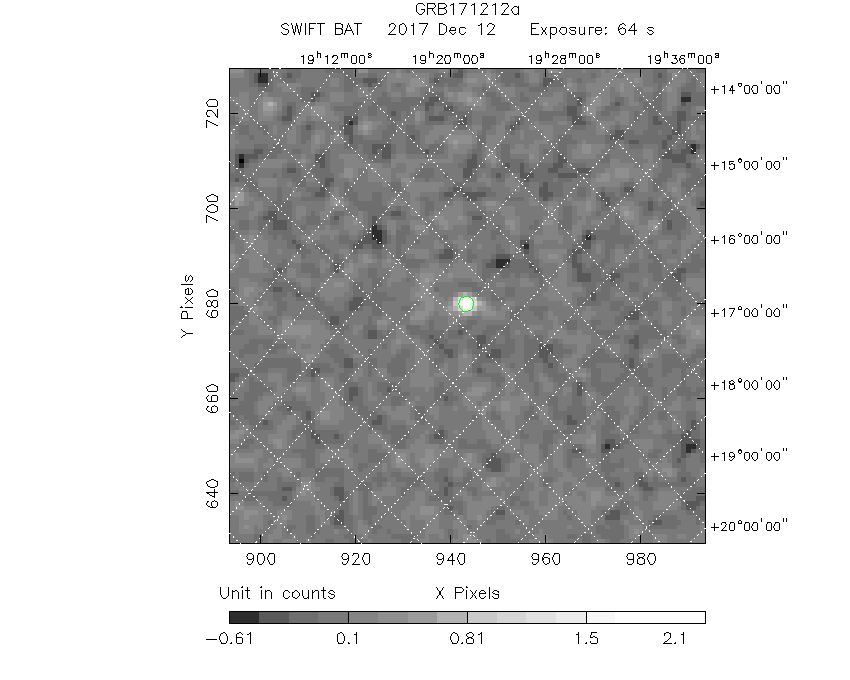
#   RAcent    DECcent   POSerr    Theta     Phi              Peak Cts       SNR   Name
  293.9219    20.5975   0.0132    24.1122  -107.3656         2.2499510     14.524 TRIG_00796778

Foreground time interval of the image:
-28.824  34.677 (delta_t =  63.501 [sec])
Background time interval of the image:
-618.323 -601.424 (delta_t =  16.899 [sec])
-239.824 -28.824 (delta_t = 211.000 [sec])
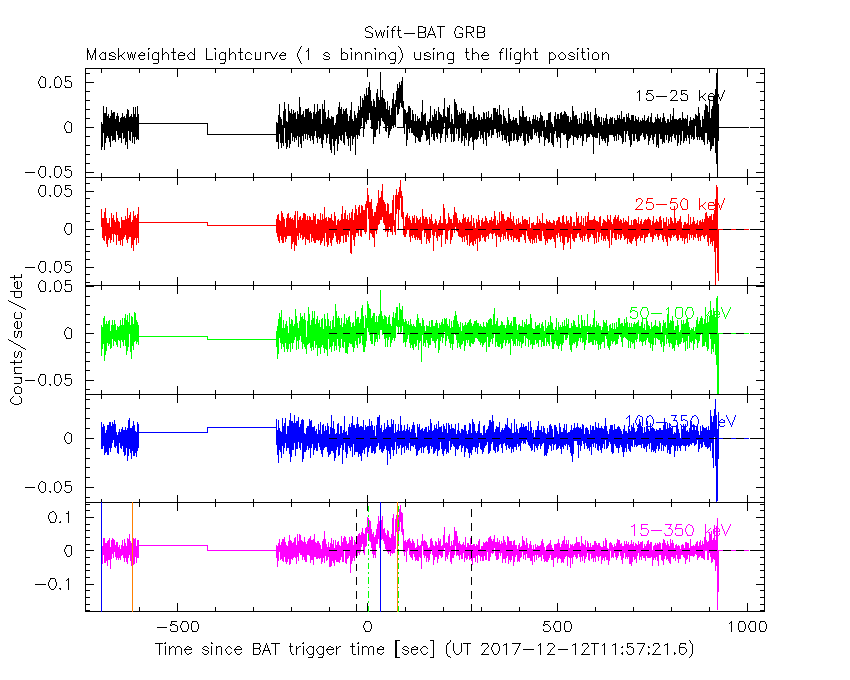
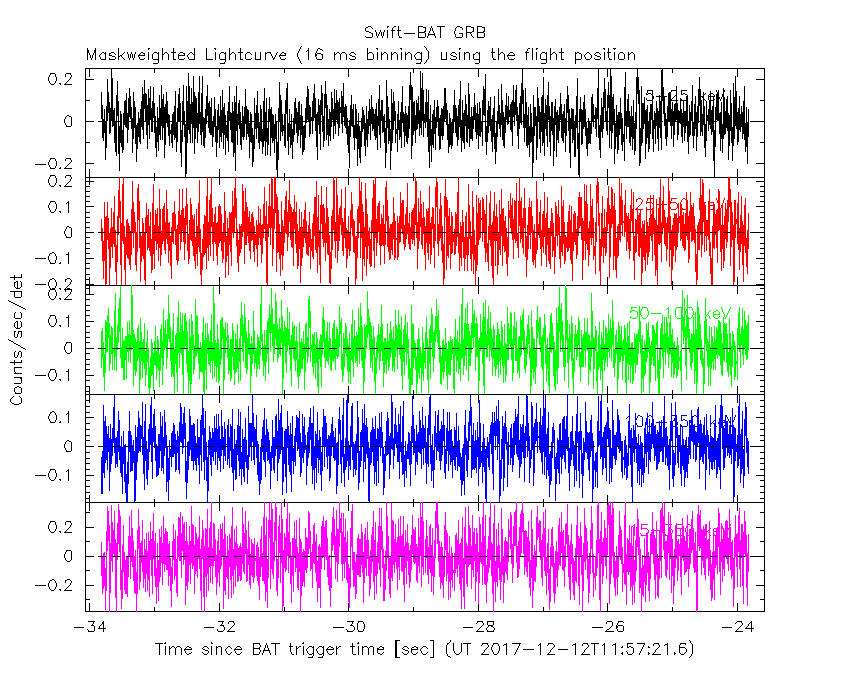
Lightcurves
Notes:
- 1) The mask-weighted light curves are using the flight position.
- 2) Multiple plots of different time binning/intervals are shown to cover all scenarios of short/long GRBs, rate/image triggers, and real/false positives.
- 3) For all the mask-weighted lightcurves, the y-axis units are counts/sec/det where a det is 0.4 x 0.4 = 0.16 sq cm.
- 4) The verticle lines correspond to following: green dotted lines are T50 interval, black dotted lines are T90 interval, blue solid line(s) is a spacecraft slew start time, and orange solid line(s) is a spacecraft slew end time.
- 5) Time of each bin is in the middle of the bin.
1 s binning
From T0-310 s to T0+310 s

From T100_start - 20 s to T100_end + 30 s

Full time interval
64 ms binning
Full time interval

From T100_start to T100_end

From T0-5 sec to T0+5 sec

16 ms binning
From T100_start-5 s to T100_start+5 s
Blue+Cyan dotted lines: Time interval of the scaled map
From 0.000000 to 4.096000
8 ms binning
From T100_start-3 s to T100_start+3 s

Blue+Cyan dotted lines: Time interval of the scaled map
From 0.000000 to 4.096000
2 ms binning
From T100_start-1 s to T100_start+1 s

Blue+Cyan dotted lines: Time interval of the scaled map
From 0.000000 to 4.096000
SN=5 or 10 sec. binning (whichever binning is satisfied first)

SN=5 or 10 sec. binning (T < 200 sec)

Quad-rate summed light curves (from T0-300s to T0+1000s)

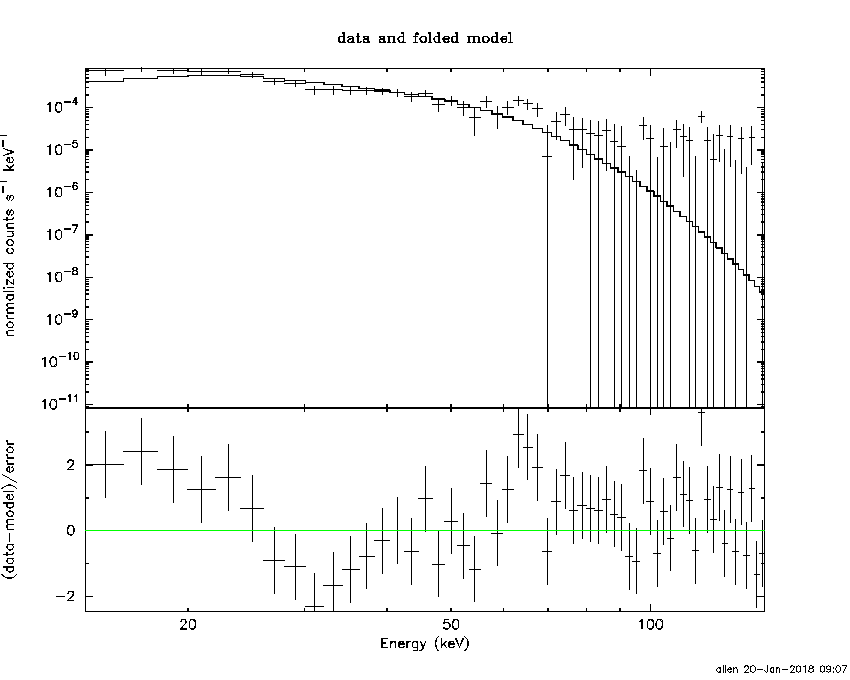
Spectral Evolution

Spectra
Notes:
- 1) The fitting includes the systematic errors.
- 2) When the burst includes telescope slew time periods, the fitting uses an average response file made from multiple 5-s response files through out the slew time plus single time preiod for the non-slew times, and weighted by the total counts in the corresponding time period using addrmf. An average response file is needed becuase a spectral fit using the pre-slew DRM will introduce some errors in both a spectral shape and a normalization if the PHA file contains a lot of the slew/post-slew time interval.
- 3) For fits to more complicated models (e.g. a power-law over a cutoff power-law), the BAT team has decided to require a chi-square improvement of more than 6 for each extra dof.
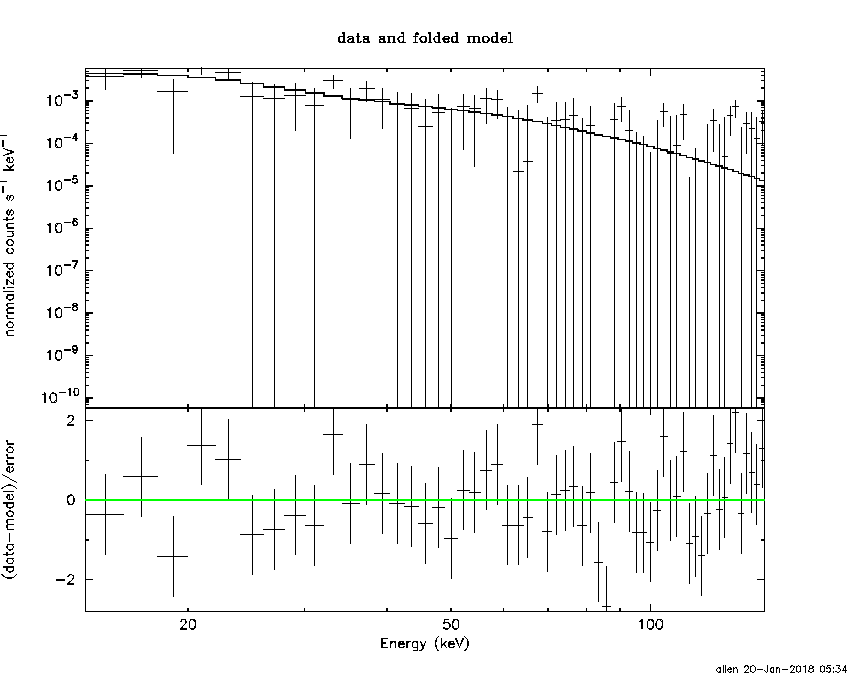
Time averaged spectrum fit using the average DRM
Power-law model

Time interval is from  -28.824 sec. to  371.176 sec.

Spectral model in power-law:
------------------------------------------------------------
Parameters  : value       lower 90%   higher 90%
Photon index: 2.20637     ( -0.13364   0.138784 )
Norm@50keV  : 8.87783E-04    ( -7.95136e-05   7.84258e-05 )
------------------------------------------------------------
#Fit statistic : Chi-Squared =          58.36 using 59 PHA bins.
# Reduced chi-squared =          1.024 for     57 degrees of freedom
# Null hypothesis probability =   4.250403e-01

Photon flux (15-150 keV)    in 400 sec: 0.147484 ( -0.009575  0.009584 ) ph/cm2/s
Energy fluence (15-150 keV)             : 3.34249e-06 ( -2.54042e-07  2.58569e-07 ) ergs/cm2
Cutoff power-law model

Time interval is from  -28.824 sec. to  371.176 sec.
Spectral model in the cutoff power-law:
------------------------------------------------------------
Parameters  : value       lower 90%   higher 90%
Photon index: 1.71967     ( -0.637311   0.283565 )
Epeak [keV] : 22.8673      ( -22.0394 12.9864 )
Norm@50keV  : 1.71830E-03    ( -0.000659424   0.0023513 )
------------------------------------------------------------
#Fit statistic : Chi-Squared =          56.11 using 59 PHA bins.
# Reduced chi-squared =          1.002 for     56 degrees of freedom
# Null hypothesis probability =   4.706460e-01

Photon flux (15-150 keV)    in 400 sec: 0.143756 ( -0.010399  0.010103 ) ph/cm2/s
Energy fluence (15-150 keV)             : 3.15566e-06 ( -3.08774e-07  3.26751e-07 ) ergs/cm2
Band function

Time interval is from  -28.824 sec. to  371.176 sec.


Spectral model in the Band function:
------------------------------------------------------------
Parameters  : value       lower 90%   higher 90%
alpha       :    (     )
beta        :     (     )
Epeak [keV] :       (   )
Norm@50keV   :     (     )
------------------------------------------------------------

Photon flux (15-150 keV)    in  sec:  (    ) ph/cm2/s
Energy fluence (15-150 keV)             : 0 ( 0  0 ) ergs/cm2
Single BB
Spectral model blackbody:
------------------------------------------------------------
Parameters  : value    Lower 90%  Upper 90%
kT [keV]    : 9.00649  (-0.691614  0.745465)
R^2/D10^2   : 9.64679E-02  (-0.0262901   0.0364711)
(R is the radius in km and D10 is the distance to the source in units of 10 kpc)
------------------------------------------------------------
#Fit statistic : Chi-Squared =          98.95 using 59 PHA bins.
# Reduced chi-squared =          1.736 for     57 degrees of freedom
# Null hypothesis probability =   4.805402e-04

Energy  Fluence     90% Error
[keV]   [erg/cm2]   [erg/cm2]
15- 25  6.096e-07   7.220e-08
25- 50  1.297e-06   1.054e-07
50-150  4.960e-07   9.686e-08
15-150  2.403e-06   1.822e-07
Thermal bremsstrahlung (OTTB)

Spectral model: thermal bremsstrahlung
------------------------------------------------------------
Parameters  : value         Lower 90%    Upper 90%
kT [keV]    : 48.1122       (-8.18999      11.1329)
Norm        : 0.837899       (-0.0973059     0.12023)
------------------------------------------------------------
#Fit statistic : Chi-Squared =          57.23 using 59 PHA bins.
# Reduced chi-squared =          1.004 for     57 degrees of freedom
# Null hypothesis probability =   4.665936e-01

Energy  Fluence     90% Error
[keV]   [erg/cm2]   [erg/cm2]
15- 25  8.120e-07   7.400e-08
25- 50  1.150e-06   8.380e-08
50-150  1.076e-06   2.106e-07
15-150  3.038e-06   2.400e-07
Double BB

Spectral model: bbodyrad<1> + bbodyrad<2>
------------------------------------------------------------
Parameters  : value         Lower 90%    Upper 90%
kT1 [keV]   : 4.40445        (-0.942402      1.14679)
R1^2/D10^2  : 1.14650        (-0.685092      2.24226)
kT2 [keV]   : 14.0848        (-2.25384      3.65939)
R2^2/D10^2  : 1.24725E-02    (-0.00794947   0.0145742)
------------------------------------------------------------
#Fit statistic : Chi-Squared =          56.62 using 59 PHA bins.
# Reduced chi-squared =          1.029 for     55 degrees of freedom
# Null hypothesis probability =   4.142744e-01

Energy  Fluence     90% Error
[keV]   [erg/cm2]   [erg/cm2]
15- 25  8.616e-07   3.028e-07
25- 50  1.089e-06   2.766e-07
50-150  1.031e-06   4.332e-07
15-150  2.982e-06   7.922e-07
Peak spectrum fit
Power-law model

Time interval is from   90.676 sec. to   91.676 sec.

Spectral model in power-law:
------------------------------------------------------------
Parameters  : value       lower 90%   higher 90%
Photon index: 2.25497     ( -0.457902   0.556328 )
Norm@50keV  : 4.06798E-03    ( -0.00155314   0.00150487 )
------------------------------------------------------------
#Fit statistic : Chi-Squared =          54.14 using 59 PHA bins.
# Reduced chi-squared =         0.9499 for     57 degrees of freedom
# Null hypothesis probability =   5.829448e-01

Photon flux (15-150 keV)    in 1 sec: 0.693615 ( -0.161341  0.161571 ) ph/cm2/s
Energy fluence (15-150 keV)             : 3.8578e-08 ( -1.17196e-08  1.26987e-08 ) ergs/cm2
Cutoff power-law model
Time interval is from   90.676 sec. to   91.676 sec.
Spectral model in the cutoff power-law:
------------------------------------------------------------
Parameters  : value       lower 90%   higher 90%
Photon index: 2.27433     ( -3.29903   1.2872 )
Epeak [keV] : 441.886      (   )
Norm@50keV  : 3.95143E-03    (     )
------------------------------------------------------------
#Fit statistic : Chi-Squared =          54.14 using 59 PHA bins.
# Reduced chi-squared =         0.9668 for     56 degrees of freedom
# Null hypothesis probability =   5.454594e-01

Photon flux (15-150 keV)    in 1 sec: 0.693616 ( -0.160902  0.162575 ) ph/cm2/s
Energy fluence (15-150 keV)             : 0 ( 0  0 ) ergs/cm2
Band function

Time interval is from   90.676 sec. to   91.676 sec.


Spectral model in the Band function:
------------------------------------------------------------
Parameters  : value       lower 90%   higher 90%
alpha       :    (     )
beta        :     (     )
Epeak [keV] :       (   )
Norm@50keV   :     (     )
------------------------------------------------------------

Photon flux (15-150 keV)    in  sec:  (    ) ph/cm2/s
Energy fluence (15-150 keV)             : 0 ( 0  0 ) ergs/cm2
Single BB

Spectral model blackbody:
------------------------------------------------------------
Parameters  : value    Lower 90%  Upper 90%
kT [keV]    : 7.53362  (-1.96273  2.49794)
R^2/D10^2   : 0.968315  (-0.656556   2.28795)
(R is the radius in km and D10 is the distance to the source in units of 10 kpc)
------------------------------------------------------------
#Fit statistic : Chi-Squared =          57.71 using 59 PHA bins.
# Reduced chi-squared =          1.013 for     57 degrees of freedom
# Null hypothesis probability =   4.486560e-01

Energy  Fluence     90% Error
[keV]   [erg/cm2]   [erg/cm2]
15- 25  9.469e-09   4.961e-09
25- 50  1.489e-08   7.155e-09
50-150  3.196e-09   2.211e-09
15-150  2.756e-08   1.383e-08
Thermal bremsstrahlung (OTTB)

Spectral model: thermal bremsstrahlung
------------------------------------------------------------
Parameters  : value         Lower 90%    Upper 90%
kT [keV]    : 39.7265       (-18.5808      49.686)
Norm        : 4.51647       (-1.64909     3.08128)
------------------------------------------------------------
#Fit statistic : Chi-Squared =          54.40 using 59 PHA bins.
# Reduced chi-squared =         0.9544 for     57 degrees of freedom
# Null hypothesis probability =   5.732093e-01

Energy  Fluence     90% Error
[keV]   [erg/cm2]   [erg/cm2]
15- 25  1.035e-08   3.599e-09
25- 50  1.357e-08   5.677e-09
50-150  1.042e-08   7.697e-09
15-150  3.434e-08   1.543e-08
Double BB

Spectral model: bbodyrad<1> + bbodyrad<2>
------------------------------------------------------------
Parameters  : value         Lower 90%    Upper 90%
kT1 [keV]   : 4.13036        (-3.46757      5.03103)
R1^2/D10^2  : 7.46553        (-6.68602      -7.46334)
kT2 [keV]   : 12.8143        (-5.38623      -12.8156)
R2^2/D10^2  : 8.16260E-02    (-0.0807708   0.923443)
------------------------------------------------------------
#Fit statistic : Chi-Squared =          54.39 using 59 PHA bins.
# Reduced chi-squared =         0.9889 for     55 degrees of freedom
# Null hypothesis probability =   4.979394e-01

Energy  Fluence     90% Error
[keV]   [erg/cm2]   [erg/cm2]
15- 25  1.076e-08   6.000e-09
25- 50  1.277e-08   6.870e-09
50-150  9.968e-09   6.315e-09
15-150  3.349e-08   1.653e-08
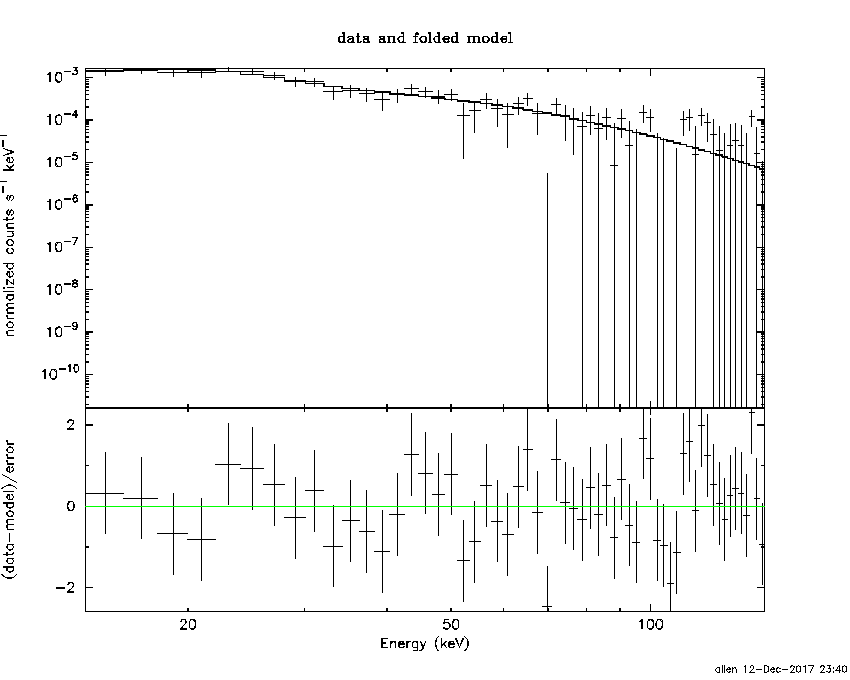
Pre-slew spectrum (Pre-slew PHA with pre-slew DRM)
Power-law model

Spectral model in power-law:
------------------------------------------------------------
Parameters  : value       lower 90%   higher 90%
Photon index: 2.07621     ( -0.17139   0.179392 )
Norm@50keV  : 2.12957E-03    ( -0.000247688   0.000242578 )
------------------------------------------------------------
#Fit statistic : Chi-Squared =          55.89 using 59 PHA bins.
# Reduced chi-squared =         0.9804 for     57 degrees of freedom
# Null hypothesis probability =   5.169575e-01

Photon flux (15-150 keV)    in 63.5 sec: 0.331155 ( -0.028307  0.0283173 ) ph/cm2/s
Energy fluence (15-150 keV)             : 1.25371e-06 ( -1.30781e-07  1.33652e-07 ) ergs/cm2
Cutoff power-law model

Spectral model in the cutoff power-law:
------------------------------------------------------------
Parameters  : value       lower 90%   higher 90%
Photon index: 1.94158     ( -0.748776   0.104199 )
Epeak [keV] : 17.7080      ( -14.5771 -15.8751 )
Norm@50keV  : 2.55420E-03    (     )
------------------------------------------------------------
#Fit statistic : Chi-Squared =          55.84 using 59 PHA bins.
# Reduced chi-squared =         0.9971 for     56 degrees of freedom
# Null hypothesis probability =   4.809807e-01

Photon flux (15-150 keV)    in 63.5 sec: 0.329624 ( -0.028628  0.029438 ) ph/cm2/s
Energy fluence (15-150 keV)             : 1.23852e-06 ( -1.69418e-07  1.46075e-07 ) ergs/cm2
Band function
Spectral model in the Band function:
------------------------------------------------------------
Parameters  : value       lower 90%   higher 90%
alpha       :    (     )
beta        :     (     )
Epeak [keV] :       (   )
Norm@50keV   :     (     )
------------------------------------------------------------

Photon flux (15-150 keV)    in  sec:  (    ) ph/cm2/s
Energy fluence (15-150 keV)             : 0 ( 0  0 ) ergs/cm2
S(25-50 keV) vs. S(50-100 keV) plot

S(25-50 keV)  = 1.06e-06
S(50-100 keV) = 9.20e-07
T90 vs. Hardness ratio plot

T90                                   = 304 sec.
Hardness ratio (energy fluence ratio) = 0.867925
Color vs. Color plot

Count Ratio  (25-50 keV) / (15-25 keV) = 0.892493
Count Ratio (50-100 keV) / (15-25 keV) = 0.381103
Mask shadow pattern

IMX = -1.335876544575510E-01, IMY = 4.271762430992510E-01
TIME vs. PHA plot around the trigger time
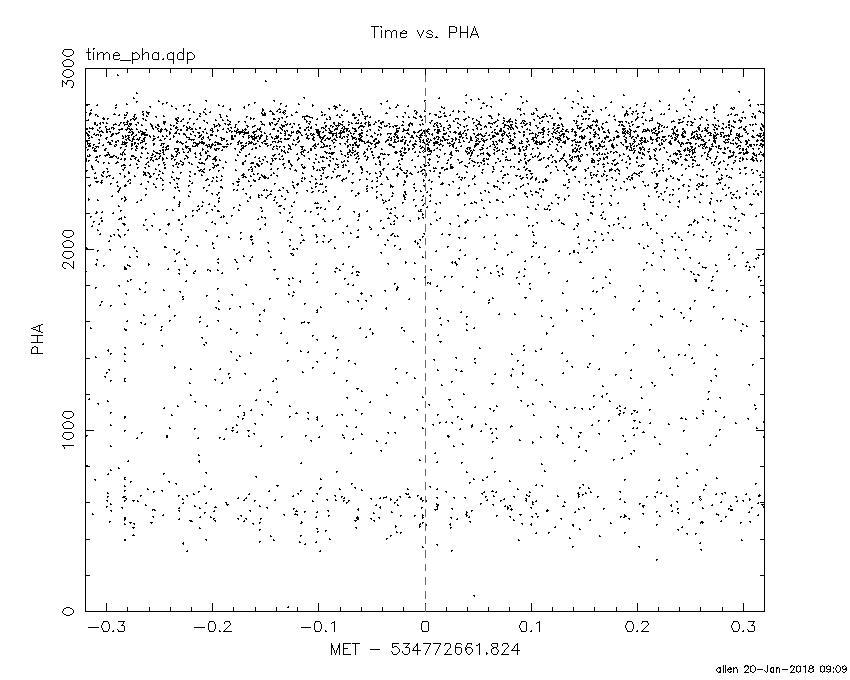
Blue+Cyan dotted lines: Time interval of the scaled map
From 0.000000 to 4.096000
TIME vs. DetID plot around the trigger time

Blue+Cyan dotted lines: Time interval of the scaled map
From 0.000000 to 4.096000
100 us light curve (15-350 keV)

Blue+Cyan dotted lines: Time interval of the scaled map
From 0.000000 to 4.096000
Spacecraft aspect plot

Bright source in the pre-burst/pre-slew/post-slew images
Pre-burst image of 15-350 keV band
Time interval of the image:
-618.323400 -601.424000
-239.824000 -28.824000

# RAcent  DECcent POSerr Theta    Phi  PeakCts   SNR AngSep     Name
#  [deg]    [deg]    ['] [deg]  [deg]                   [']
254.3011  35.3987    6.5  41.9  -41.6   0.8454   1.8    8.4	Her X-1
288.9530  11.0087    4.3  34.8 -107.2   1.2378   2.7    9.9	GRS 1915+105
299.5824  35.2120    1.0   9.2  -92.2   2.8125  12.1    0.7	Cyg X-1
308.0507  40.9101    2.1   0.6 -139.8   1.1828   5.4    3.7	Cyg X-3
326.1841  38.3255    4.7  14.2  135.6   0.5946   2.5    0.6	Cyg X-2
 15.3295  84.4397    3.2  46.5   45.6   3.2519   3.6 ------	UNKNOWN
357.5349  17.5377    2.6  48.4  142.9   4.6679   4.5 ------	UNKNOWN
201.5747  71.5567    2.8  55.8   17.1   5.4513   4.1 ------	UNKNOWN
341.6814  -6.4428    2.4  57.0  177.6   7.7005   4.8 ------	UNKNOWN
220.5873  51.0887    2.4  57.6   -9.5   5.3699   4.7 ------	UNKNOWN
281.4229  19.6176    2.5  31.5  -87.4   1.7896   4.6 ------	UNKNOWN
Pre-slew background subtracted image of 15-350 keV band
Time interval of the image:
-28.824000 34.676580

# RAcent  DECcent POSerr Theta    Phi  PeakCts   SNR AngSep     Name
#  [deg]    [deg]    ['] [deg]  [deg]                   [']
254.5490  35.3982   13.7  41.7  -41.7  -0.1909  -0.8    5.6	Her X-1
288.6918  10.8401    9.1  35.1 -106.9  -0.3090  -1.3    8.9	GRS 1915+105
299.5709  35.3917    5.2   9.0  -91.4  -0.2436  -2.2   11.4	Cyg X-1
308.2578  41.0536   40.0   0.5 -157.7  -0.0329  -0.3    9.0	Cyg X-3
326.1301  38.1374    9.2  14.2  136.4  -0.1460  -1.2   11.2	Cyg X-2
352.8231  67.3130    1.7  35.2   66.6   1.5339   6.7 ------	UNKNOWN
293.9219  20.5975    0.8  24.1 -107.4   2.2505  14.5 ------	UNKNOWN
Post-slew image of 15-350 keV band
Time interval of the image:
80.476620 841.876590

# RAcent  DECcent POSerr Theta    Phi  PeakCts   SNR AngSep     Name
#  [deg]    [deg]    ['] [deg]  [deg]                   [']
254.4915  35.3166    7.0  37.5   -7.2  -1.2535  -1.6    2.3	Her X-1
268.2575  -1.3904   10.9  33.4  -77.0   1.1707   1.1    7.6	SW J1753.5-0127
273.9762 -13.8898    6.3  39.7  -97.7   4.6577   1.8    9.0	GX 17+2
288.8318  10.8931    2.9  10.9 -101.4   2.6603   4.0    3.7	GRS 1915+105
299.6057  35.2162    1.1  15.5   68.9   5.6480  10.3    1.2	Cyg X-1
308.0305  40.9917    2.3  23.7   78.4   3.5100   5.0    4.3	Cyg X-3
326.0772  38.2219   12.3  32.8  101.6   1.0527   0.9    7.5	Cyg X-2
268.6624  68.5190    3.5  50.4   39.4  10.0053   3.2 ------	UNKNOWN
258.2353  48.6140    3.2  39.9   14.2   2.9104   3.5 ------	UNKNOWN
288.8194  -2.2234    2.5  23.4 -116.0   3.2218   4.7 ------	UNKNOWN
232.2246  26.1549    3.7  56.4  -20.5   7.6194   3.2 ------	UNKNOWN
243.8259  13.0945    4.8  48.3  -39.5   4.1968   2.4 ------	UNKNOWN
275.8384 -15.1979    3.7  40.0 -101.1   7.7406   3.1 ------	UNKNOWN
Plot creation:
Sat Jan 20 09:09:13 EST 2018