Estimated redshift from machine learning (Ukwatta et al. 2016) - may take a few minute to calcaulte
Image
Pre-slew 15.0-350.0 keV image (Event data)

#   RAcent    DECcent   POSerr    Theta     Phi              Peak Cts       SNR   Name
  203.0727    62.1649   0.0105    18.9583   -34.2114         0.7200210     18.359 TRIG_00802999

Foreground time interval of the image:
 -7.624   6.300 (delta_t =  13.924 [sec])
Background time interval of the image:
-110.043  -7.624 (delta_t = 102.419 [sec])
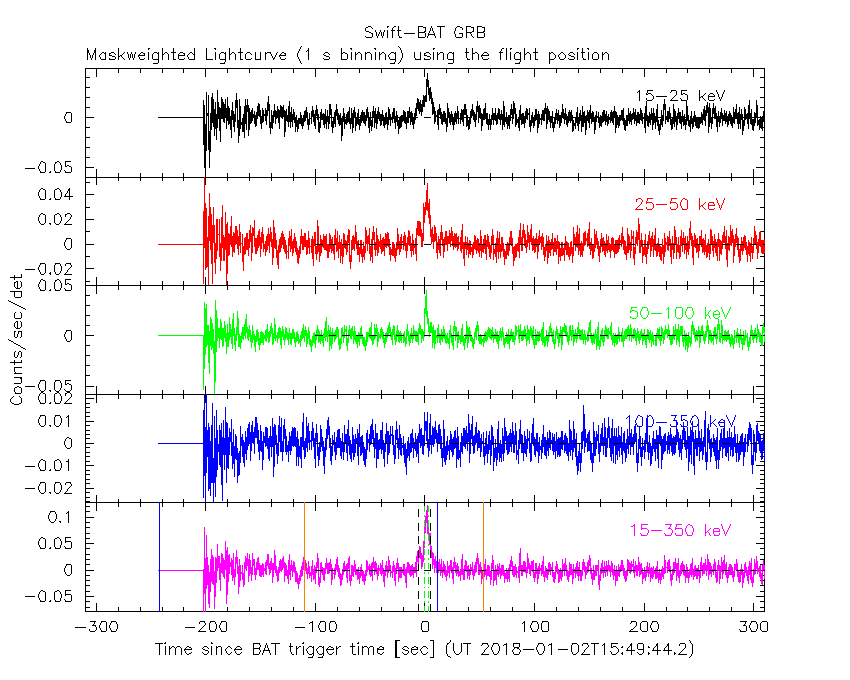
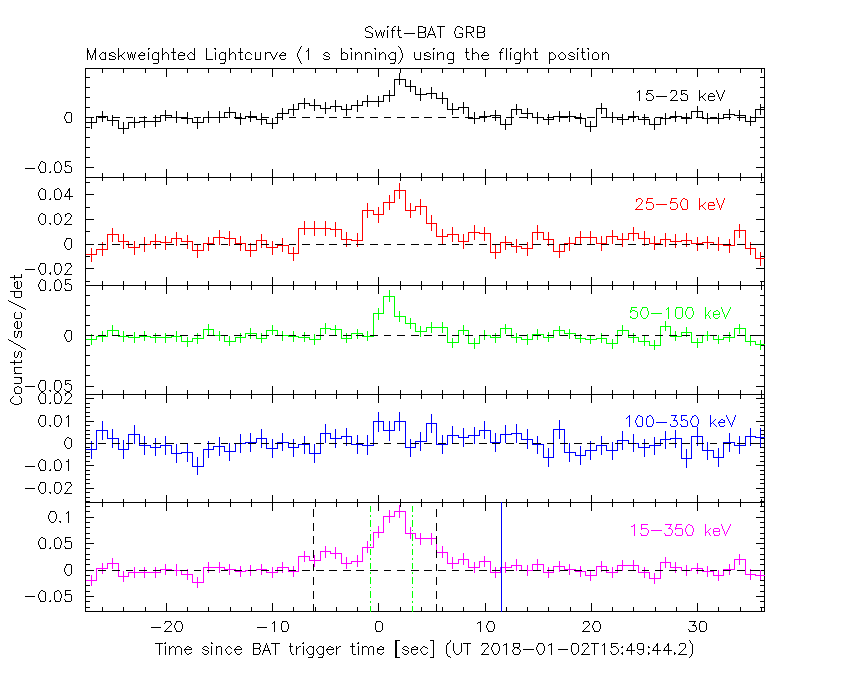
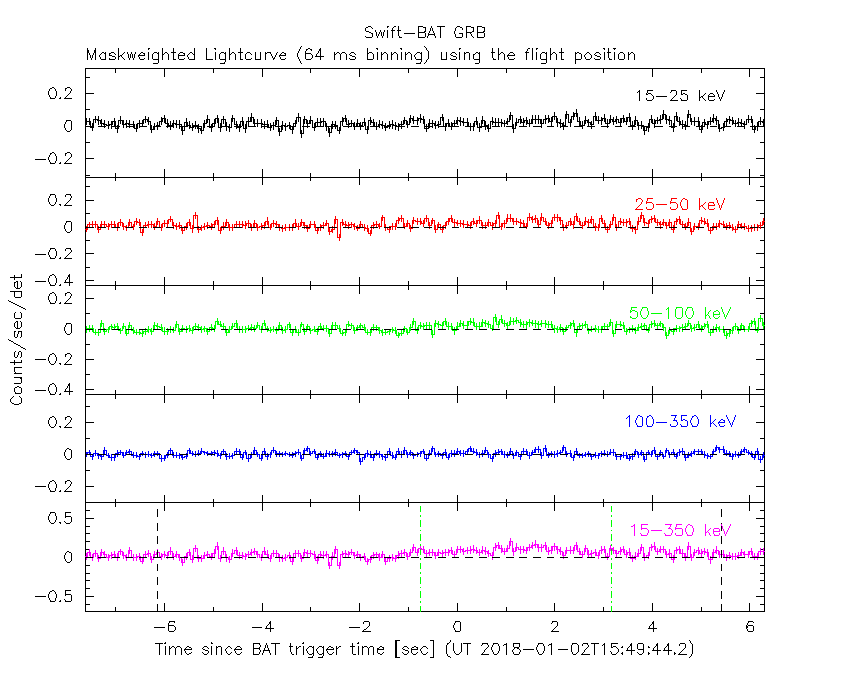
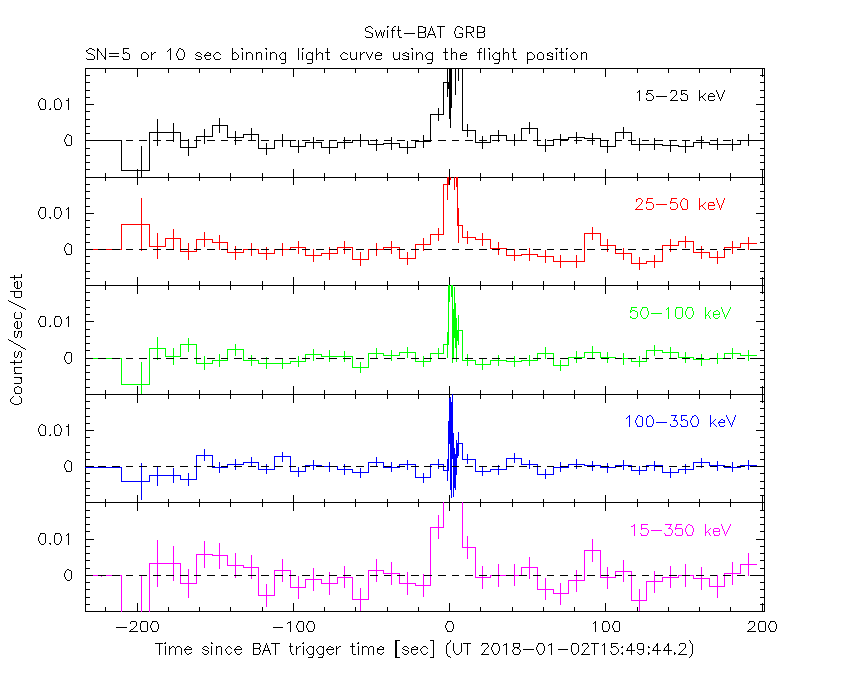
Lightcurves
Notes:
- 1) The mask-weighted light curves are using the flight position.
- 2) Multiple plots of different time binning/intervals are shown to cover all scenarios of short/long GRBs, rate/image triggers, and real/false positives.
- 3) For all the mask-weighted lightcurves, the y-axis units are counts/sec/det where a det is 0.4 x 0.4 = 0.16 sq cm.
- 4) The verticle lines correspond to following: green dotted lines are T50 interval, black dotted lines are T90 interval, blue solid line(s) is a spacecraft slew start time, and orange solid line(s) is a spacecraft slew end time.
- 5) Time of each bin is in the middle of the bin.
1 s binning
From T0-310 s to T0+310 s
From T100_start - 20 s to T100_end + 30 s
Full time interval

64 ms binning
Full time interval

From T100_start to T100_end
From T0-5 sec to T0+5 sec

16 ms binning
From T100_start-5 s to T100_start+5 s

Blue+Cyan dotted lines: Time interval of the scaled map
From 0.000000 to 1.024000
8 ms binning
From T100_start-3 s to T100_start+3 s

Blue+Cyan dotted lines: Time interval of the scaled map
From 0.000000 to 1.024000
2 ms binning
From T100_start-1 s to T100_start+1 s

Blue+Cyan dotted lines: Time interval of the scaled map
From 0.000000 to 1.024000
SN=5 or 10 sec. binning (whichever binning is satisfied first)

SN=5 or 10 sec. binning (T < 200 sec)
Quad-rate summed light curves (from T0-300s to T0+1000s)

Spectral Evolution

Spectra
Notes:
- 1) The fitting includes the systematic errors.
- 2) When the burst includes telescope slew time periods, the fitting uses an average response file made from multiple 5-s response files through out the slew time plus single time preiod for the non-slew times, and weighted by the total counts in the corresponding time period using addrmf. An average response file is needed becuase a spectral fit using the pre-slew DRM will introduce some errors in both a spectral shape and a normalization if the PHA file contains a lot of the slew/post-slew time interval.
- 3) For fits to more complicated models (e.g. a power-law over a cutoff power-law), the BAT team has decided to require a chi-square improvement of more than 6 for each extra dof.
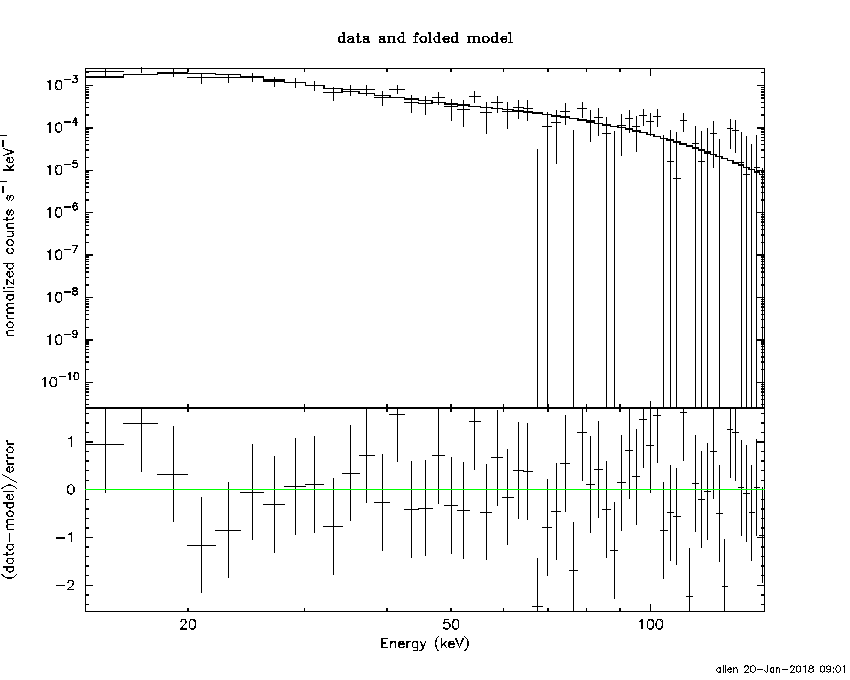
Time averaged spectrum fit using the average DRM
Power-law model

Time interval is from   -7.624 sec. to    6.300 sec.

Spectral model in power-law:
------------------------------------------------------------
Parameters  : value       lower 90%   higher 90%
Photon index: 2.02506     ( -0.182099   0.191832 )
Norm@50keV  : 2.70961E-03    ( -0.000334193   0.000325788 )
------------------------------------------------------------
#Fit statistic : Chi-Squared =          48.63 using 59 PHA bins.
# Reduced chi-squared =         0.8532 for     57 degrees of freedom
# Null hypothesis probability =   7.771831e-01

Photon flux (15-150 keV)    in 13.92 sec: 0.411228 ( -0.038234  0.038247 ) ph/cm2/s
Energy fluence (15-150 keV)             : 3.48401e-07 ( -3.93506e-08  4.02138e-08 ) ergs/cm2
Cutoff power-law model

Time interval is from   -7.624 sec. to    6.300 sec.
Spectral model in the cutoff power-law:
------------------------------------------------------------
Parameters  : value       lower 90%   higher 90%
Photon index: 1.99643     ( -0.736349   0.0207833 )
Epeak [keV] : 4.56510      ( -3.91837 -4.58097 )
Norm@50keV  : 2.82571E-03    ( -0.00144537   0.000537473 )
------------------------------------------------------------
#Fit statistic : Chi-Squared =          48.63 using 59 PHA bins.
# Reduced chi-squared =         0.8684 for     56 degrees of freedom
# Null hypothesis probability =   7.472946e-01

Photon flux (15-150 keV)    in 13.92 sec: 0.410879 ( -0.038083  0.039528 ) ph/cm2/s
Energy fluence (15-150 keV)             : 3.47279e-07 ( -4.29948e-08  4.24918e-08 ) ergs/cm2
Band function

Time interval is from   -7.624 sec. to    6.300 sec.


Spectral model in the Band function:
------------------------------------------------------------
Parameters  : value       lower 90%   higher 90%
alpha       :    (     )
beta        :     (     )
Epeak [keV] :       (   )
Norm@50keV   :     (     )
------------------------------------------------------------

Photon flux (15-150 keV)    in  sec:  (    ) ph/cm2/s
Energy fluence (15-150 keV)             : 0 ( 0  0 ) ergs/cm2
Single BB

Spectral model blackbody:
------------------------------------------------------------
Parameters  : value    Lower 90%  Upper 90%
kT [keV]    : 9.32478  (-1.03082  1.17844)
R^2/D10^2   : 0.242428  (-0.0896859   0.140368)
(R is the radius in km and D10 is the distance to the source in units of 10 kpc)
------------------------------------------------------------
#Fit statistic : Chi-Squared =          77.15 using 59 PHA bins.
# Reduced chi-squared =          1.353 for     57 degrees of freedom
# Null hypothesis probability =   3.898982e-02

Energy  Fluence     90% Error
[keV]   [erg/cm2]   [erg/cm2]
15- 25  5.812e-08   9.187e-09
25- 50  1.305e-07   1.615e-08
50-150  5.541e-08   1.602e-08
15-150  2.440e-07   2.979e-08
Thermal bremsstrahlung (OTTB)

Spectral model: thermal bremsstrahlung
------------------------------------------------------------
Parameters  : value         Lower 90%    Upper 90%
kT [keV]    : 65.0201       (-17.4222      28.032)
Norm        : 2.06042       (-0.314635     0.372637)
------------------------------------------------------------
#Fit statistic : Chi-Squared =          50.98 using 59 PHA bins.
# Reduced chi-squared =         0.8943 for     57 degrees of freedom
# Null hypothesis probability =   6.992335e-01

Energy  Fluence     90% Error
[keV]   [erg/cm2]   [erg/cm2]
15- 25  7.294e-08   9.306e-09
25- 50  1.137e-07   1.189e-08
50-150  1.380e-07   3.672e-08
15-150  3.247e-07   4.239e-08
Double BB
Spectral model: bbodyrad<1> + bbodyrad<2>
------------------------------------------------------------
Parameters  : value         Lower 90%    Upper 90%
kT1 [keV]   : 6.30051        (-1.67426      1.47343)
R1^2/D10^2  : 0.876107        (-0.460694      1.84784)
kT2 [keV]   : 25.3999        (-9.10099      22.178)
R2^2/D10^2  : 3.71056E-03    (-0.0031798   0.0171079)
------------------------------------------------------------
#Fit statistic : Chi-Squared =          50.80 using 59 PHA bins.
# Reduced chi-squared =         0.9236 for     55 degrees of freedom
# Null hypothesis probability =   6.358489e-01

Energy  Fluence     90% Error
[keV]   [erg/cm2]   [erg/cm2]
15- 25  7.452e-08   2.012e-08
25- 50  1.090e-07   3.703e-08
50-150  1.651e-07   8.900e-08
15-150  3.486e-07   1.271e-07
Peak spectrum fit
Power-law model
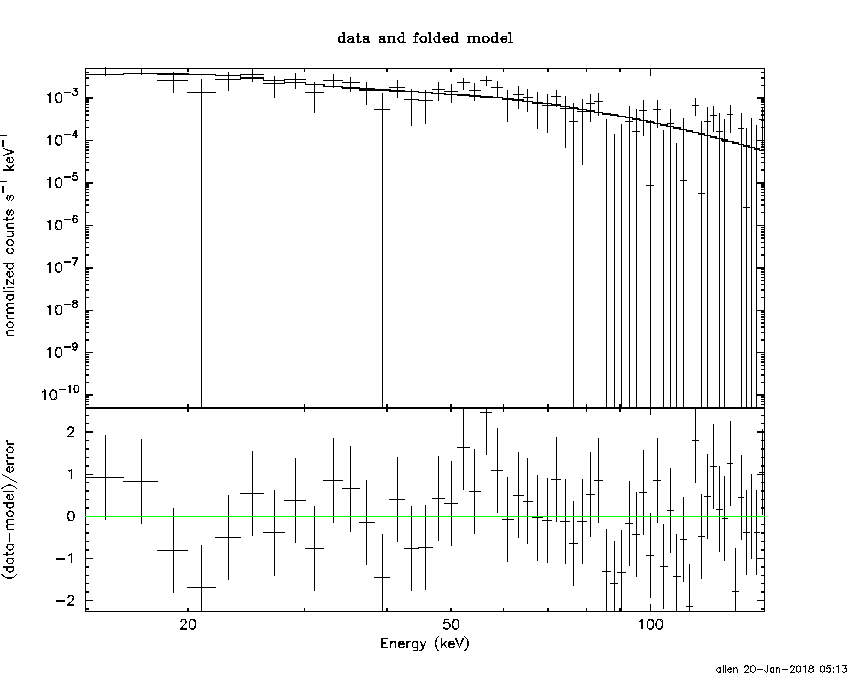
Time interval is from    0.800 sec. to    1.800 sec.

Spectral model in power-law:
------------------------------------------------------------
Parameters  : value       lower 90%   higher 90%
Photon index: 1.52103     ( -0.24401   0.252703 )
Norm@50keV  : 7.85258E-03    ( -0.00119235   0.00117432 )
------------------------------------------------------------
#Fit statistic : Chi-Squared =          52.24 using 59 PHA bins.
# Reduced chi-squared =         0.9164 for     57 degrees of freedom
# Null hypothesis probability =   6.540353e-01

Photon flux (15-150 keV)    in 1 sec: 0.985985 ( -0.140313  0.140395 ) ph/cm2/s
Energy fluence (15-150 keV)             : 7.4254e-08 ( -1.23042e-08  1.25161e-08 ) ergs/cm2
Cutoff power-law model
Time interval is from    0.800 sec. to    1.800 sec.
Spectral model in the cutoff power-law:
------------------------------------------------------------
Parameters  : value       lower 90%   higher 90%
Photon index: 0.812526     ( -1.36643   0.886143 )
Epeak [keV] : 83.2136      ( -27.9261 -83.1649 )
Norm@50keV  : 1.80085E-02    ( -0.0110458   0.0660071 )
------------------------------------------------------------
#Fit statistic : Chi-Squared =          51.00 using 59 PHA bins.
# Reduced chi-squared =         0.9107 for     56 degrees of freedom
# Null hypothesis probability =   6.641112e-01

Photon flux (15-150 keV)    in 1 sec: 0.958220 ( -0.148557  0.14708 ) ph/cm2/s
Energy fluence (15-150 keV)             : 7.06822e-08 ( -1.31753e-08  1.36241e-08 ) ergs/cm2
Band function

Time interval is from    0.800 sec. to    1.800 sec.


Spectral model in the Band function:
------------------------------------------------------------
Parameters  : value       lower 90%   higher 90%
alpha       :    (     )
beta        :     (     )
Epeak [keV] :       (   )
Norm@50keV   :     (     )
------------------------------------------------------------

Photon flux (15-150 keV)    in  sec:  (    ) ph/cm2/s
Energy fluence (15-150 keV)             : 0 ( 0  0 ) ergs/cm2
Single BB

Spectral model blackbody:
------------------------------------------------------------
Parameters  : value    Lower 90%  Upper 90%
kT [keV]    : 15.1122  (-2.24867  2.68275)
R^2/D10^2   : 0.112126  (-0.0489026   0.0842593)
(R is the radius in km and D10 is the distance to the source in units of 10 kpc)
------------------------------------------------------------
#Fit statistic : Chi-Squared =          56.88 using 59 PHA bins.
# Reduced chi-squared =         0.9980 for     57 degrees of freedom
# Null hypothesis probability =   4.794395e-01

Energy  Fluence     90% Error
[keV]   [erg/cm2]   [erg/cm2]
15- 25  5.355e-09   1.430e-09
25- 50  2.142e-08   5.010e-09
50-150  3.341e-08   9.235e-09
15-150  6.018e-08   1.275e-08
Thermal bremsstrahlung (OTTB)

Spectral model: thermal bremsstrahlung
------------------------------------------------------------
Parameters  : value         Lower 90%    Upper 90%
kT [keV]    : 199.363       (-94.5782      -199.363)
Norm        : 4.03576       (-0.568876     0.56934)
------------------------------------------------------------
#Fit statistic : Chi-Squared =          51.50 using 59 PHA bins.
# Reduced chi-squared =         0.9034 for     57 degrees of freedom
# Null hypothesis probability =   6.808398e-01

Energy  Fluence     90% Error
[keV]   [erg/cm2]   [erg/cm2]
15- 25  1.005e-08   5.755e-09
25- 50  1.933e-08   1.066e-08
50-150  4.240e-08   2.341e-08
15-150  7.178e-08   4.045e-08
Double BB

Spectral model: bbodyrad<1> + bbodyrad<2>
------------------------------------------------------------
Parameters  : value         Lower 90%    Upper 90%
kT1 [keV]   : 2.06118        (-1.16397      2.71046)
R1^2/D10^2  : 381.659        (-404.113      2.74387e+06)
kT2 [keV]   : 16.7626        (-2.69272      3.83367)
R2^2/D10^2  : 7.43224E-02    (-0.0398534   0.061532)
------------------------------------------------------------
#Fit statistic : Chi-Squared =          46.53 using 59 PHA bins.
# Reduced chi-squared =         0.8460 for     55 degrees of freedom
# Null hypothesis probability =   7.849161e-01

Energy  Fluence     90% Error
[keV]   [erg/cm2]   [erg/cm2]
15- 25  8.825e-09   3.512e-09
25- 50  1.882e-08   5.747e-09
50-150  3.730e-08   1.118e-08
15-150  6.494e-08   1.793e-08
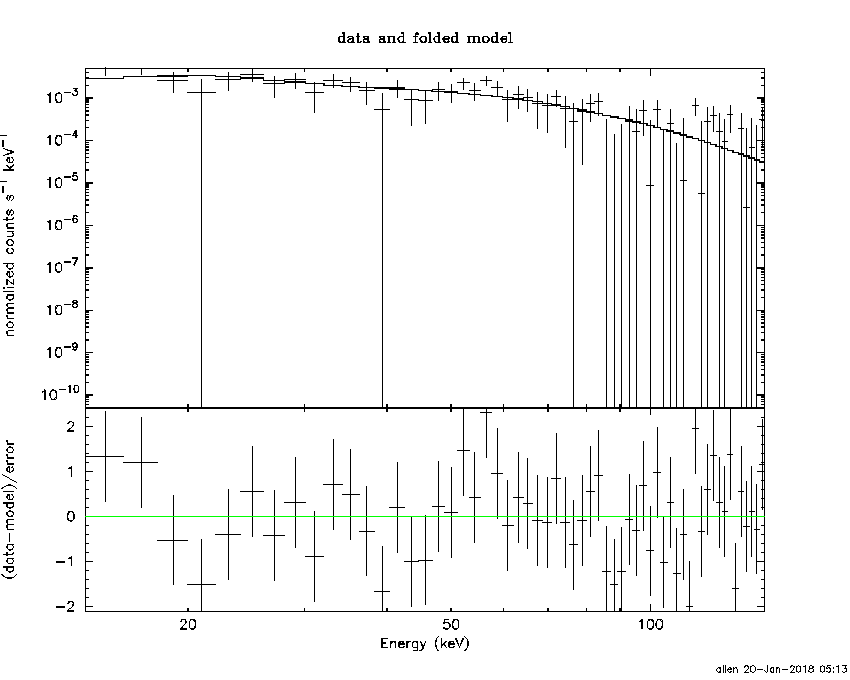
Pre-slew spectrum (Pre-slew PHA with pre-slew DRM)
Power-law model

Spectral model in power-law:
------------------------------------------------------------
Parameters  : value       lower 90%   higher 90%
Photon index: 2.02506     ( -0.182099   0.191832 )
Norm@50keV  : 2.70961E-03    ( -0.000334193   0.000325788 )
------------------------------------------------------------
#Fit statistic : Chi-Squared =          48.63 using 59 PHA bins.
# Reduced chi-squared =         0.8532 for     57 degrees of freedom
# Null hypothesis probability =   7.771831e-01

Photon flux (15-150 keV)    in 13.92 sec: 0.411196 ( -0.0382298  0.0382431 ) ph/cm2/s
Energy fluence (15-150 keV)             : 3.48335e-07 ( -3.94038e-08  4.02179e-08 ) ergs/cm2
Cutoff power-law model

Spectral model in the cutoff power-law:
------------------------------------------------------------
Parameters  : value       lower 90%   higher 90%
Photon index: 1.99688     ( -0.736624   0.0234122 )
Epeak [keV] : 5.10672      ( -4.49623 -5.07599 )
Norm@50keV  : 2.80655E-03    ( -0.00158081   0.000574884 )
------------------------------------------------------------
#Fit statistic : Chi-Squared =          48.63 using 59 PHA bins.
# Reduced chi-squared =         0.8683 for     56 degrees of freedom
# Null hypothesis probability =   7.473414e-01

Photon flux (15-150 keV)    in 13.92 sec: 0.411071 ( -0.040309  0.038134 ) ph/cm2/s
Energy fluence (15-150 keV)             : 3.50923e-07 ( -5.0698e-08  3.75576e-08 ) ergs/cm2
Band function

Spectral model in the Band function:
------------------------------------------------------------
Parameters  : value       lower 90%   higher 90%
alpha       :    (     )
beta        :     (     )
Epeak [keV] :       (   )
Norm@50keV   :     (     )
------------------------------------------------------------

Photon flux (15-150 keV)    in  sec:  (    ) ph/cm2/s
Energy fluence (15-150 keV)             : 0 ( 0  0 ) ergs/cm2
S(25-50 keV) vs. S(50-100 keV) plot
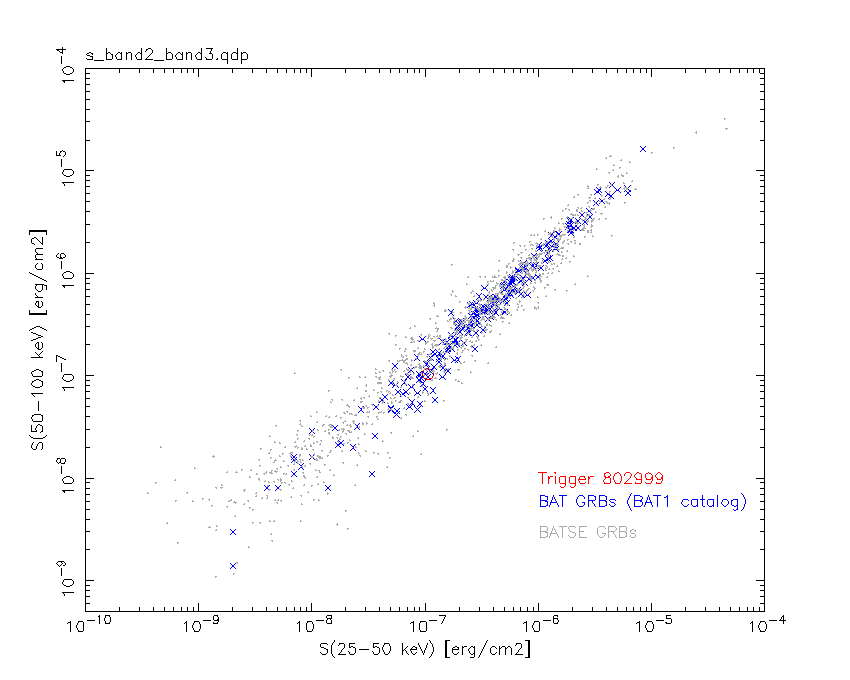
S(25-50 keV)  = 1.06e-07
S(50-100 keV) = 1.04e-07
T90 vs. Hardness ratio plot

T90                                   = 11.5599999427795 sec.
Hardness ratio (energy fluence ratio) = 0.981132
Color vs. Color plot
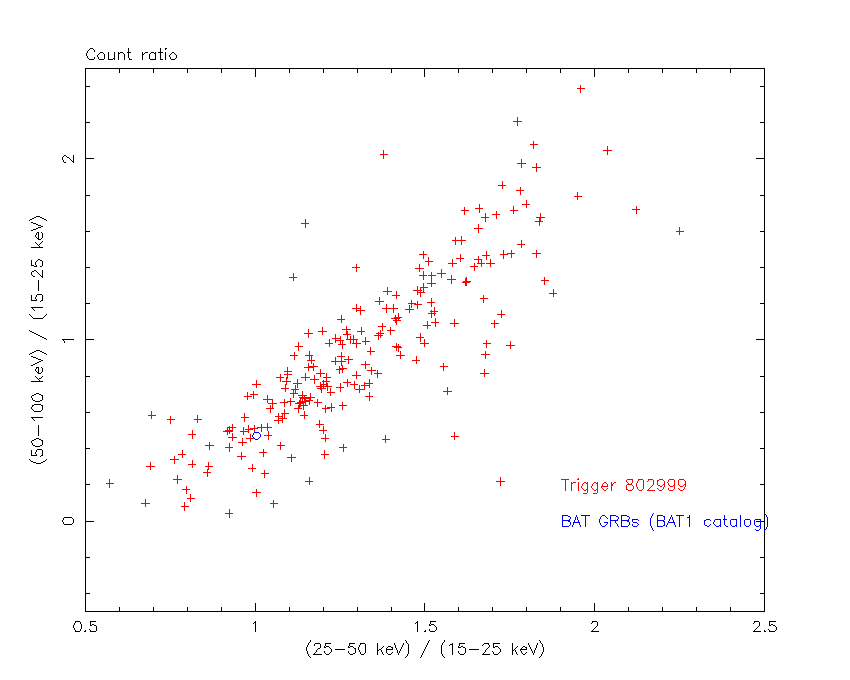
Count Ratio  (25-50 keV) / (15-25 keV) = 1.00406
Count Ratio (50-100 keV) / (15-25 keV) = 0.471313
Mask shadow pattern

IMX = 2.840744469097226E-01, IMY = 1.931394477765271E-01
TIME vs. PHA plot around the trigger time

Blue+Cyan dotted lines: Time interval of the scaled map
From 0.000000 to 1.024000
TIME vs. DetID plot around the trigger time

Blue+Cyan dotted lines: Time interval of the scaled map
From 0.000000 to 1.024000
100 us light curve (15-350 keV)

Blue+Cyan dotted lines: Time interval of the scaled map
From 0.000000 to 1.024000
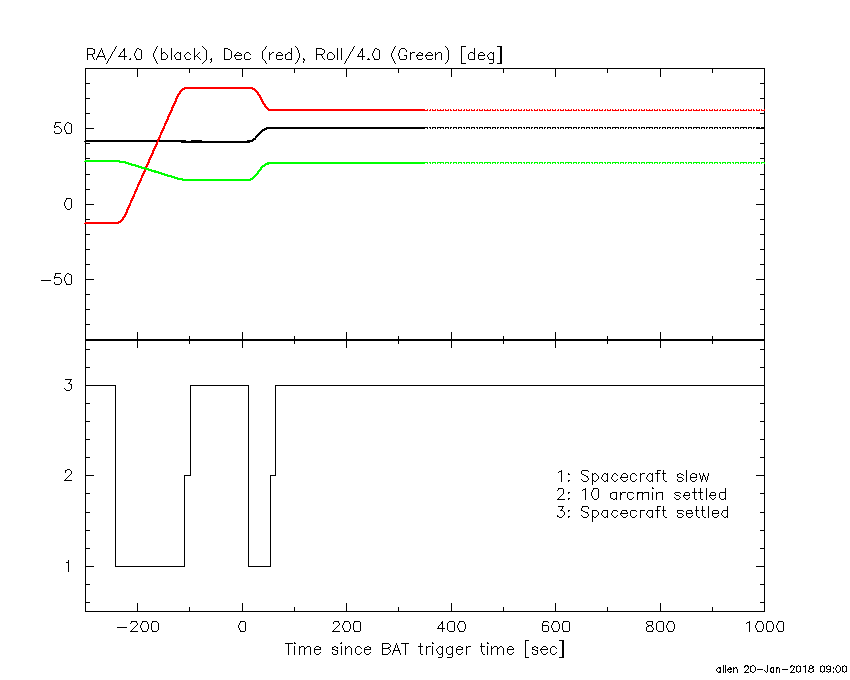
Spacecraft aspect plot
Bright source in the pre-burst/pre-slew/post-slew images
Pre-burst image of 15-350 keV band
Time interval of the image:
-110.043410 -7.624000

# RAcent  DECcent POSerr Theta    Phi  PeakCts   SNR AngSep     Name
#  [deg]    [deg]    ['] [deg]  [deg]                   [']
108.6720  43.7855    2.4  40.4   95.4   2.2722   4.8 ------	UNKNOWN
178.9957  21.4178    2.5  55.9   11.0   2.8836   4.5 ------	UNKNOWN
 40.9138  61.4276    0.4  37.5  165.5   5.4119  31.8 ------	UNKNOWN
 22.1058  60.2250    2.6  41.0  179.1   0.8581   4.4 ------	UNKNOWN
188.7344  50.7580    2.9  27.6   -6.2   0.4859   4.0 ------	UNKNOWN
303.4946  54.9941    2.9  45.4 -121.4   2.1298   4.0 ------	UNKNOWN
Pre-slew background subtracted image of 15-350 keV band
Time interval of the image:
-7.624000 6.300000

# RAcent  DECcent POSerr Theta    Phi  PeakCts   SNR AngSep     Name
#  [deg]    [deg]    ['] [deg]  [deg]                   [']
203.0727  62.1650    0.6  19.0  -34.2   0.7200  18.4 ------	UNKNOWN
Post-slew image of 15-350 keV band
Time interval of the image:
53.756590 962.518300

# RAcent  DECcent POSerr Theta    Phi  PeakCts   SNR AngSep     Name
#  [deg]    [deg]    ['] [deg]  [deg]                   [']
141.9733  53.7327    2.6  32.2   84.2   4.3054   4.5 ------	UNKNOWN
180.1553  25.3807    3.3  39.8   14.1   2.7561   3.5 ------	UNKNOWN
352.5341  58.6482    3.1  56.9  179.1  14.8431   3.7 ------	UNKNOWN
Plot creation:
Sat Jan 20 09:02:59 EST 2018