Special notes of this burst
Image
Pre-slew 15.0-350.0 keV image (Event data)
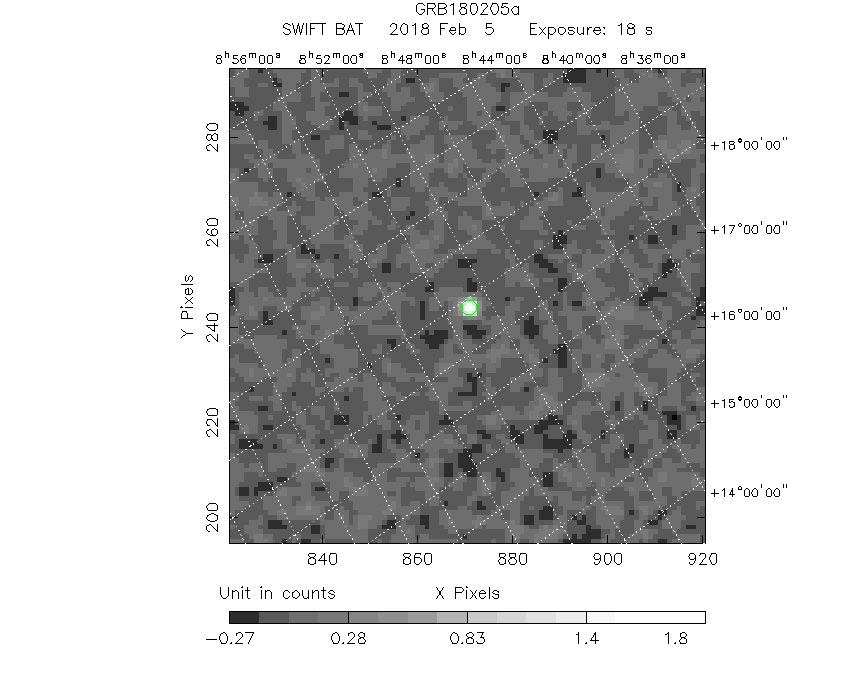
#   RAcent    DECcent   POSerr    Theta     Phi              Peak Cts       SNR   Name
  126.8193    11.5362   0.0072    26.0457    87.8532         1.9887556     26.694 TRIG_00808625

Foreground time interval of the image:
 -7.044  10.868 (delta_t =  17.912 [sec])
Background time interval of the image:
-239.760  -7.044 (delta_t = 232.716 [sec])
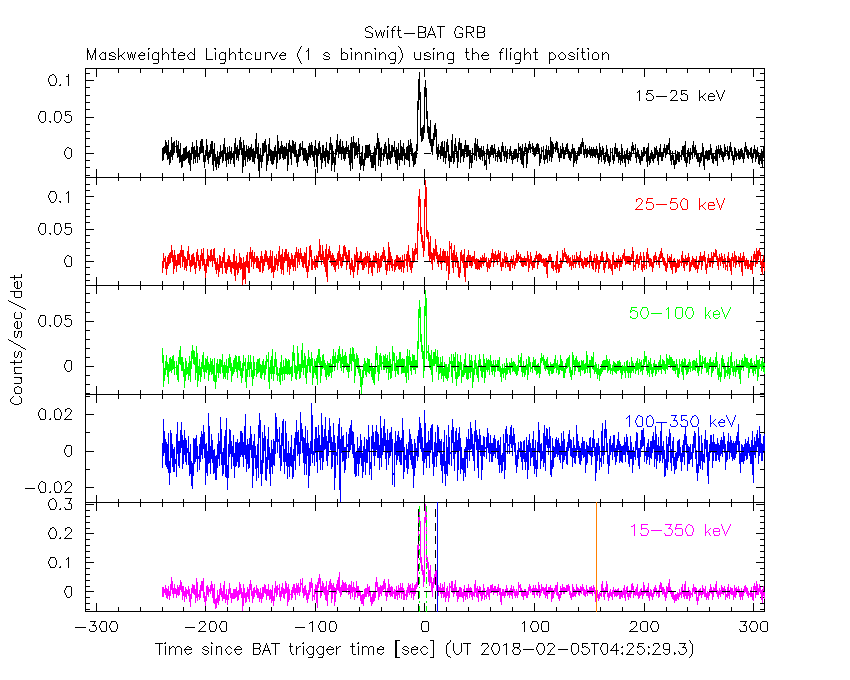
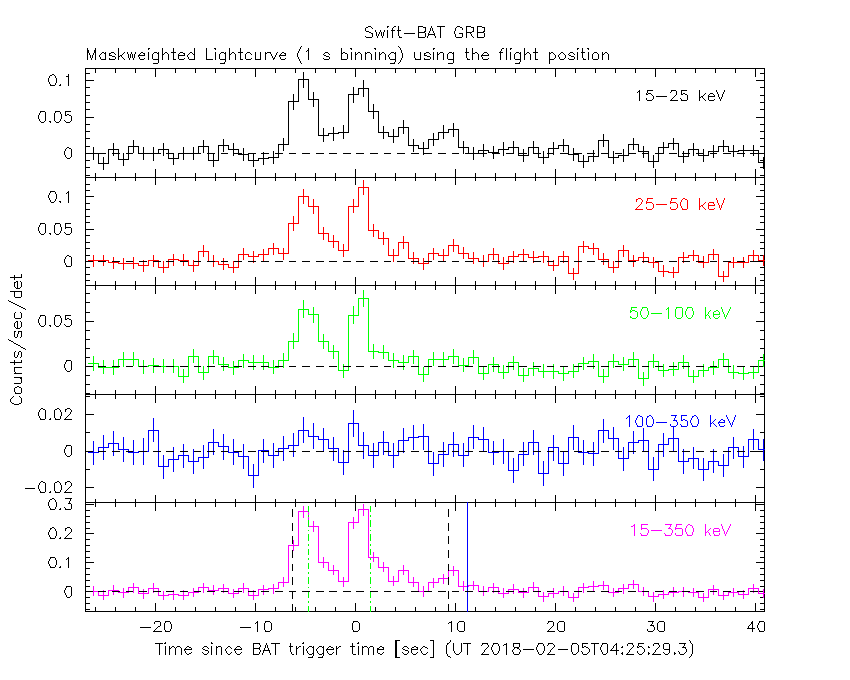
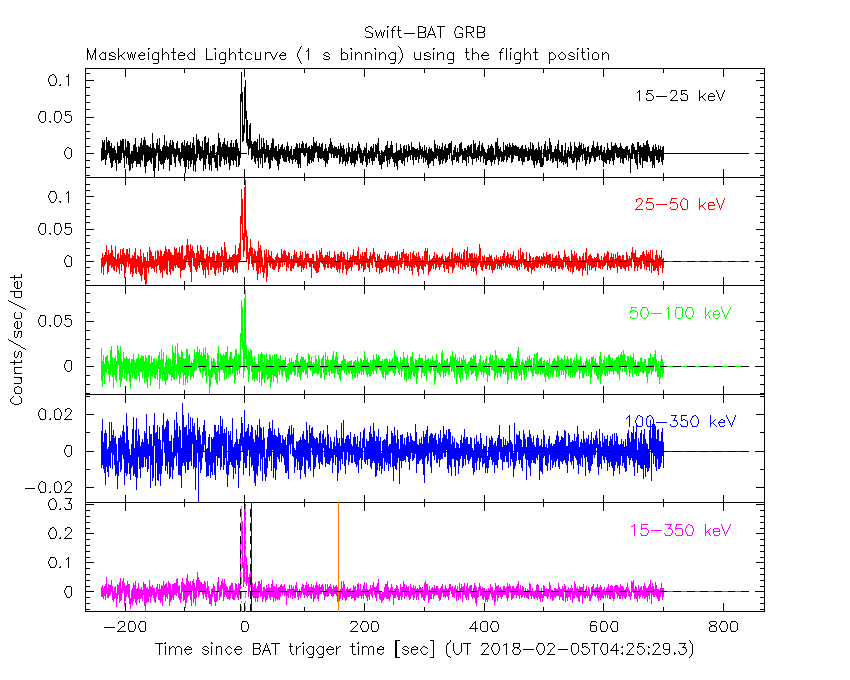
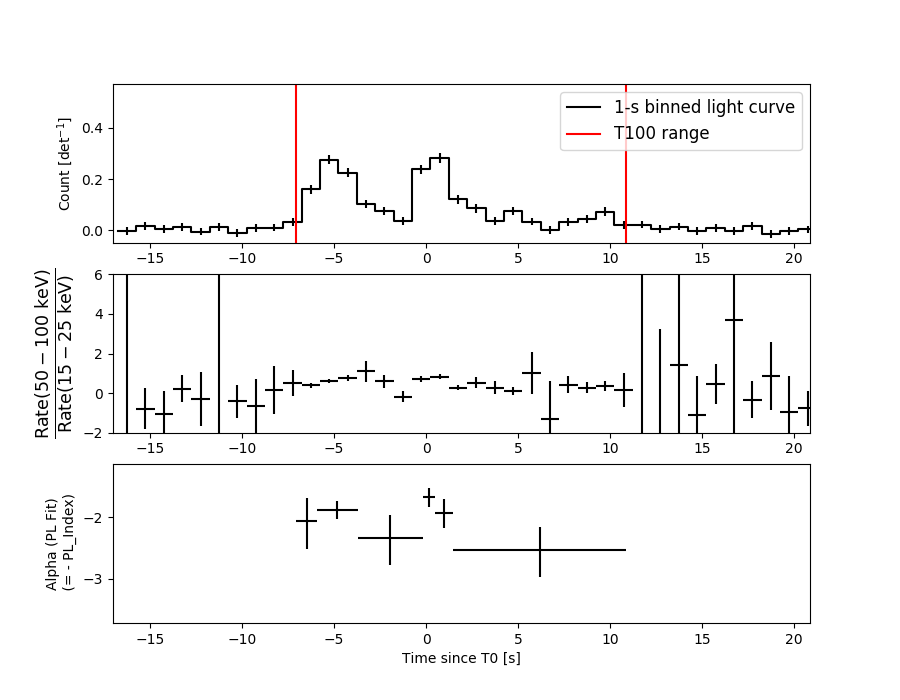
Lightcurves
Notes:
- 1) The mask-weighted light curves are using the flight position.
- 2) Multiple plots of different time binning/intervals are shown to cover all scenarios of short/long GRBs, rate/image triggers, and real/false positives.
- 3) For all the mask-weighted lightcurves, the y-axis units are counts/sec/det where a det is 0.4 x 0.4 = 0.16 sq cm.
- 4) The verticle lines correspond to following: green dotted lines are T50 interval, black dotted lines are T90 interval, blue solid line(s) is a spacecraft slew start time, and orange solid line(s) is a spacecraft slew end time.
- 5) Time of each bin is in the middle of the bin.
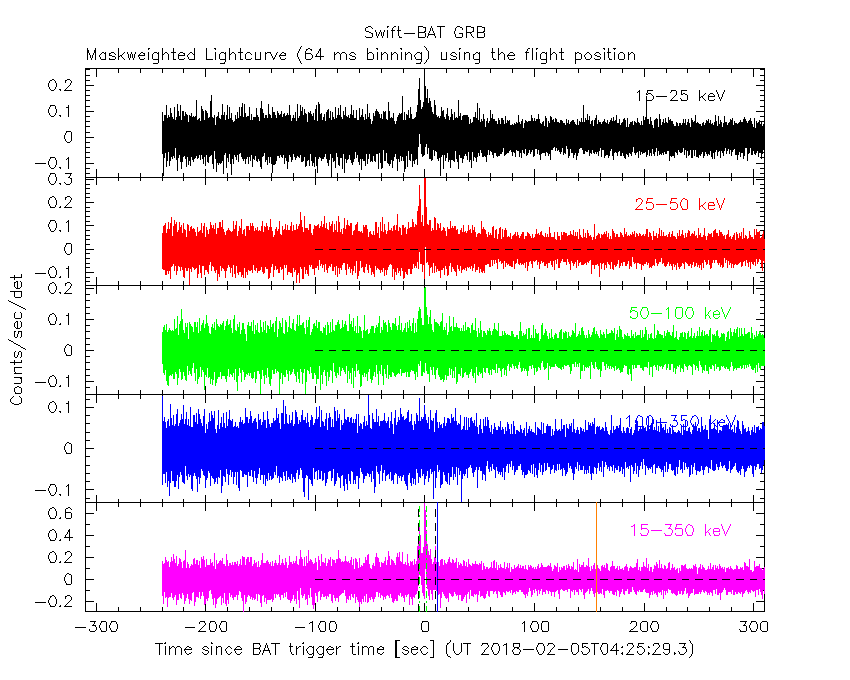
1 s binning
From T0-310 s to T0+310 s
From T100_start - 20 s to T100_end + 30 s
Full time interval
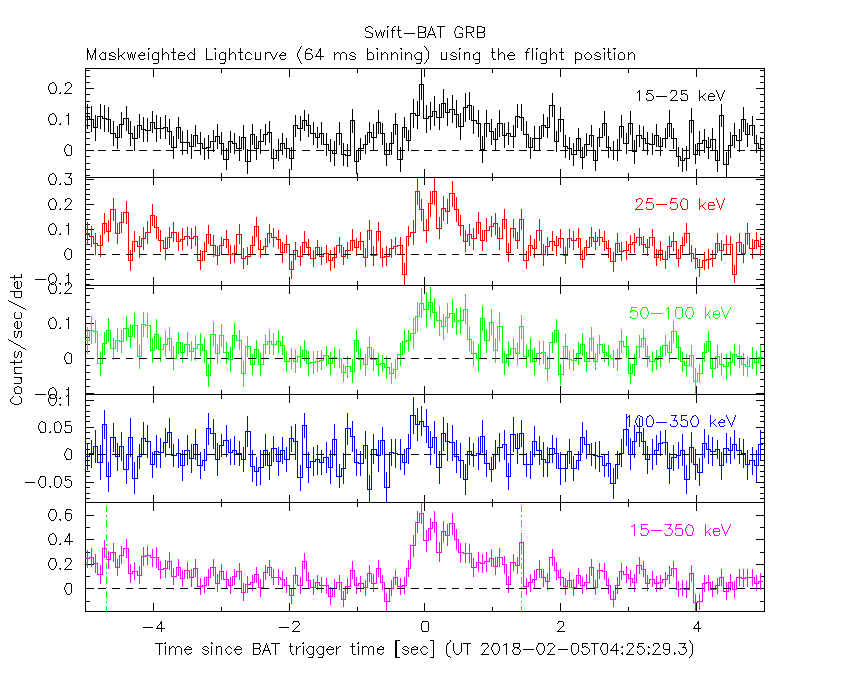
64 ms binning
Full time interval
From T100_start to T100_end
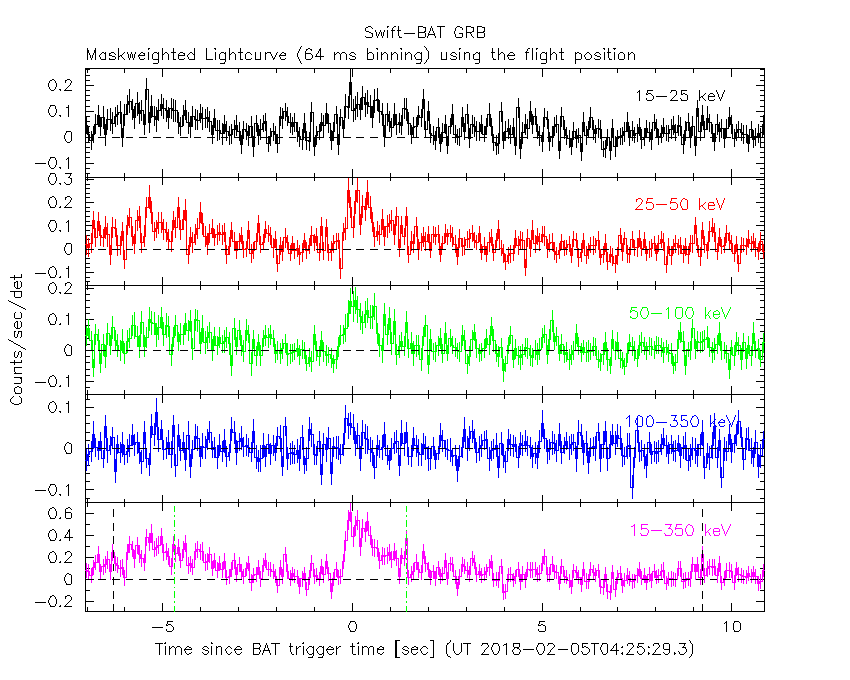
From T0-5 sec to T0+5 sec
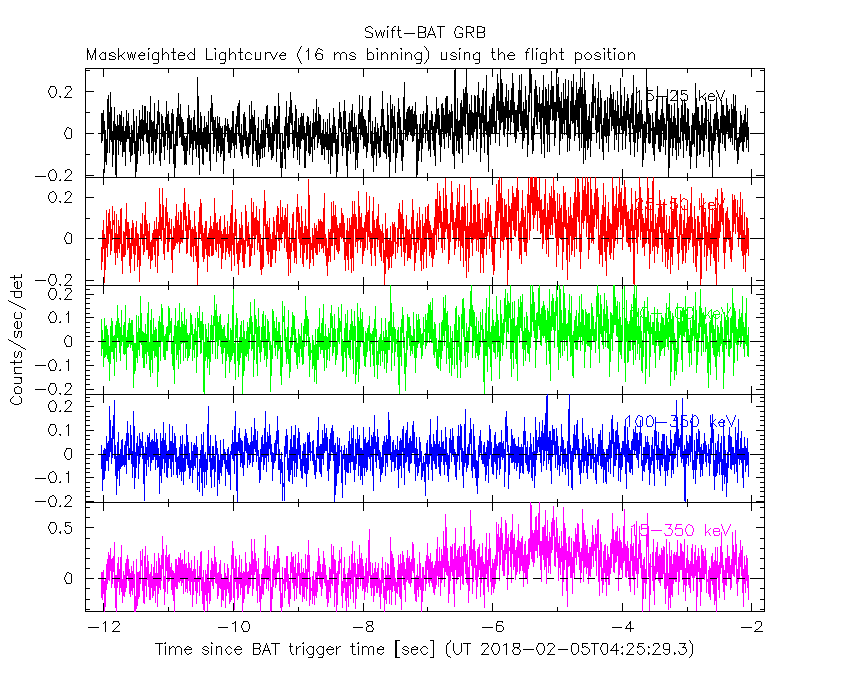
16 ms binning
From T100_start-5 s to T100_start+5 s
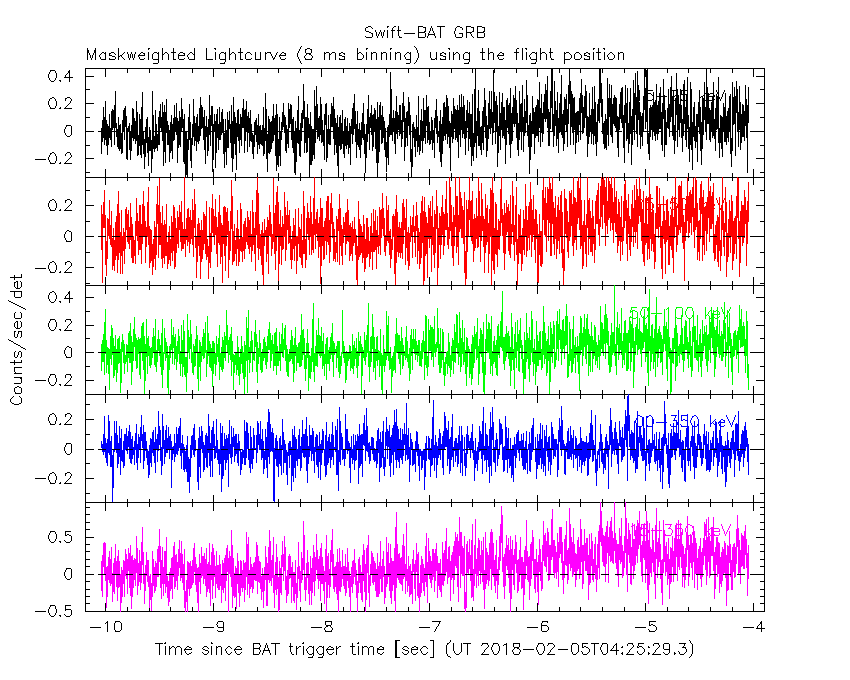
8 ms binning
From T100_start-3 s to T100_start+3 s
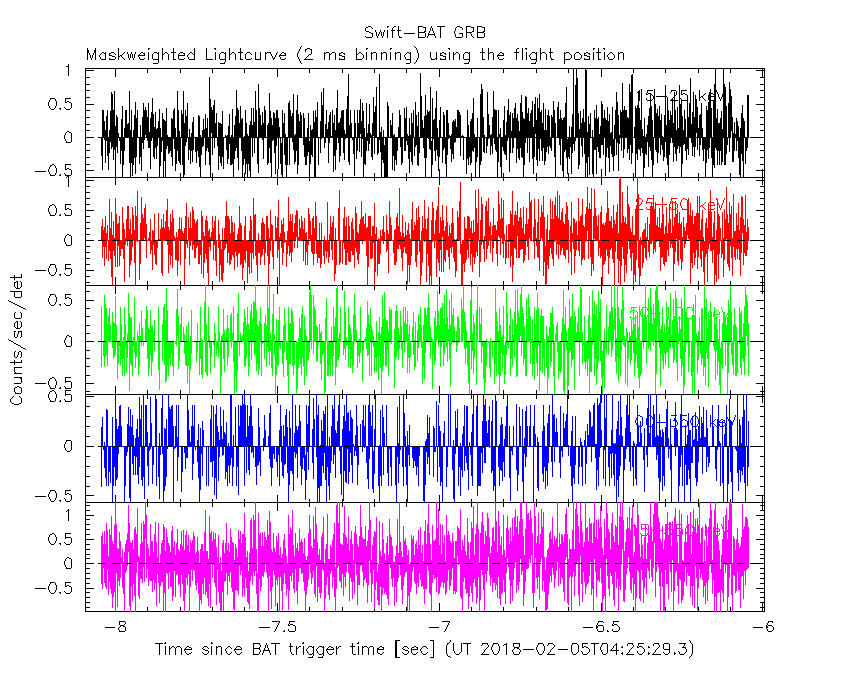
2 ms binning
From T100_start-1 s to T100_start+1 s
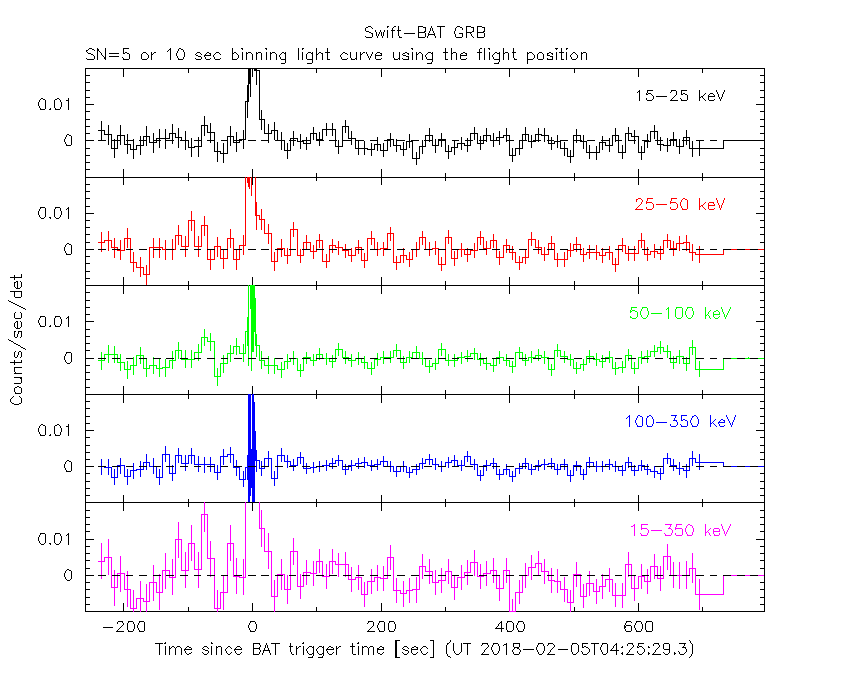
SN=5 or 10 sec. binning (whichever binning is satisfied first)
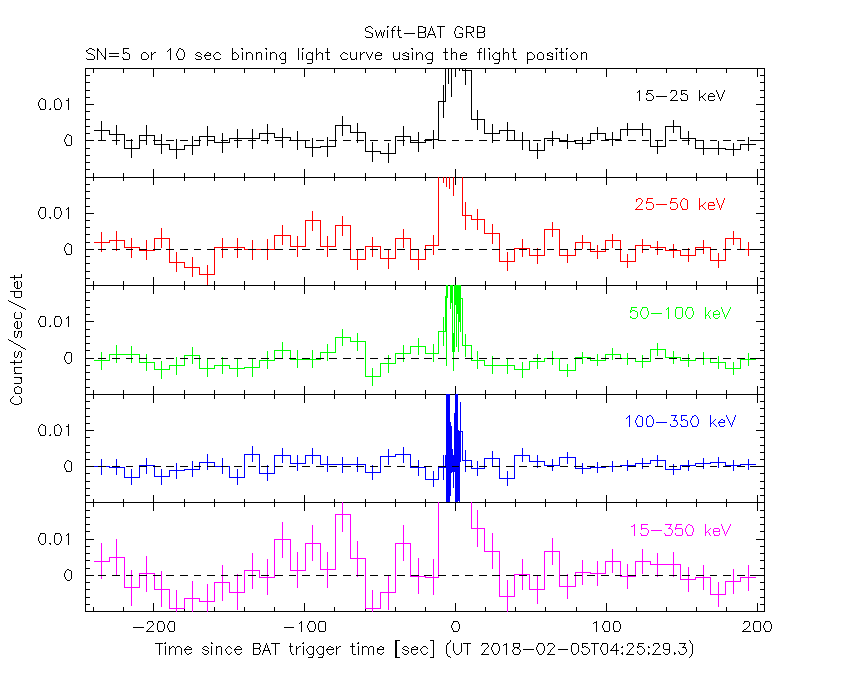
SN=5 or 10 sec. binning (T < 200 sec)
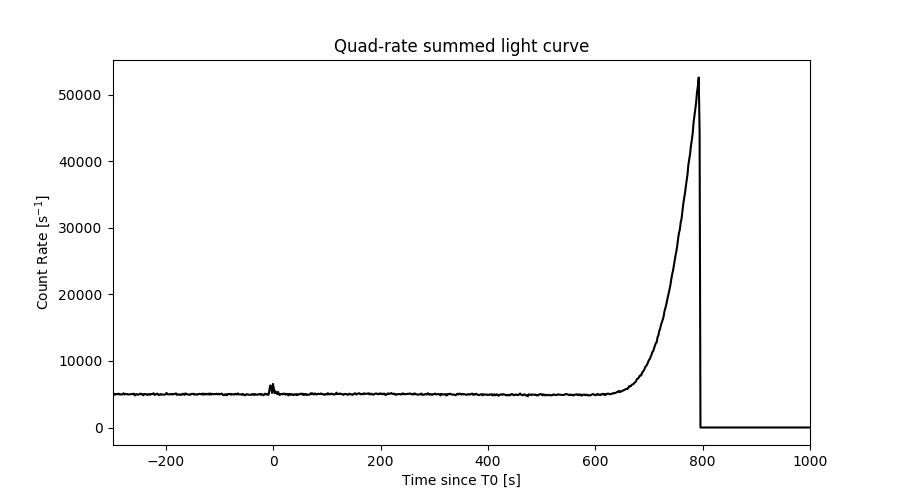
Quad-rate summed light curves (from T0-300s to T0+1000s)
Spectral Evolution
Spectra
Notes:
- 1) The fitting includes the systematic errors.
- 2) When the burst includes telescope slew time periods, the fitting uses an average response file made from multiple 5-s response files through out the slew time plus single time preiod for the non-slew times, and weighted by the total counts in the corresponding time period using addrmf. An average response file is needed becuase a spectral fit using the pre-slew DRM will introduce some errors in both a spectral shape and a normalization if the PHA file contains a lot of the slew/post-slew time interval.
- 3) For fits to more complicated models (e.g. a power-law over a cutoff power-law), the BAT team has decided to require a chi-square improvement of more than 6 for each extra dof.
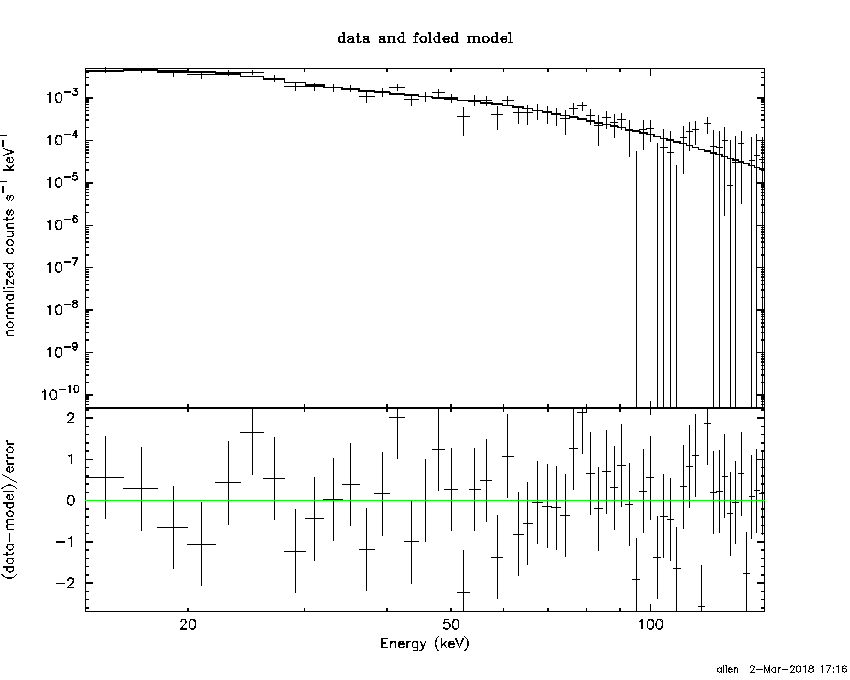
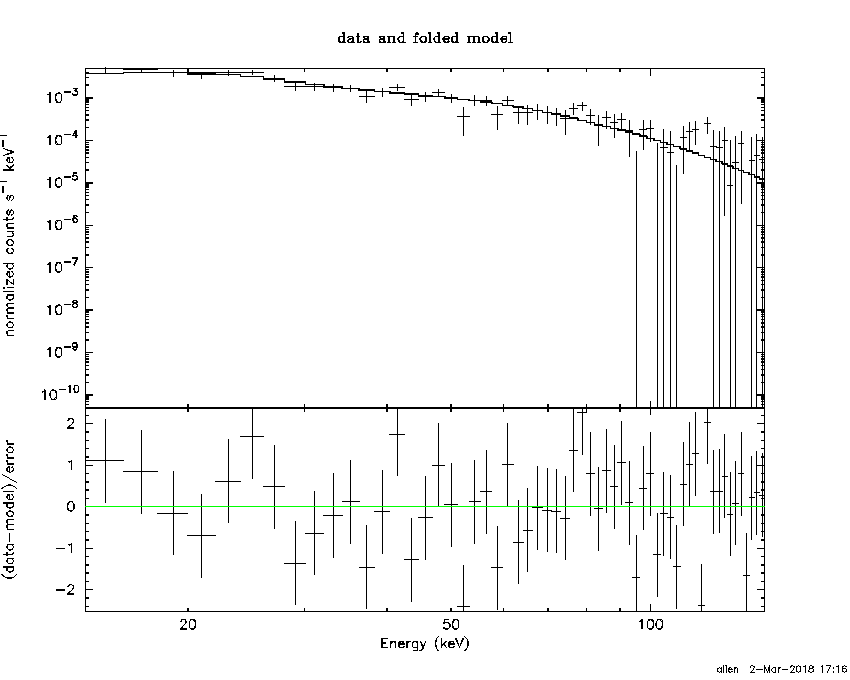
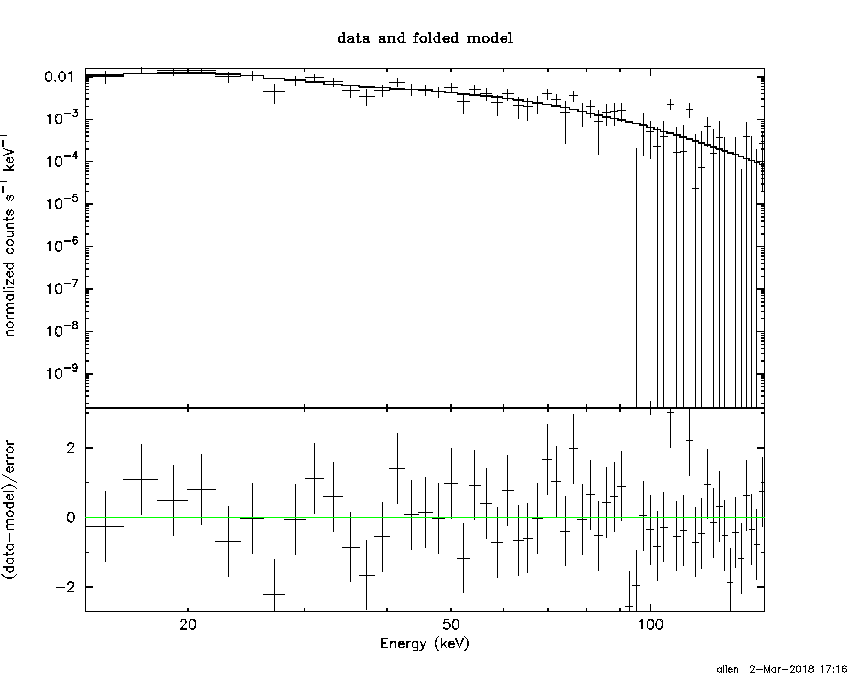
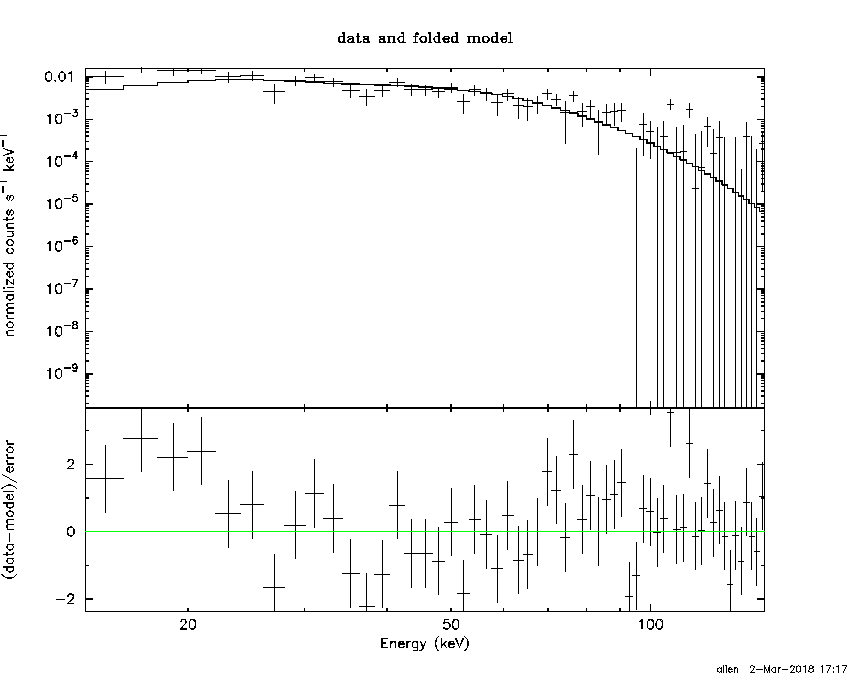
Time averaged spectrum fit using the average DRM
Power-law model

Time interval is from   -7.044 sec. to   10.868 sec.

Spectral model in power-law:
------------------------------------------------------------
Parameters  : value       lower 90%   higher 90%
Photon index: 2.03639     ( -0.124096   0.128216 )
Norm@50keV  : 6.16328E-03    ( -0.000483306   0.000475738 )
------------------------------------------------------------
#Fit statistic : Chi-Squared =          58.36 using 59 PHA bins.
# Reduced chi-squared =          1.024 for     57 degrees of freedom
# Null hypothesis probability =   4.250441e-01

Photon flux (15-150 keV)    in 17.91 sec: 0.940380 ( -0.060763  0.06085 ) ph/cm2/s
Energy fluence (15-150 keV)             : 1.02039e-06 ( -7.40736e-08  7.48928e-08 ) ergs/cm2
Cutoff power-law model

Time interval is from   -7.044 sec. to   10.868 sec.
Spectral model in the cutoff power-law:
------------------------------------------------------------
Parameters  : value       lower 90%   higher 90%
Photon index: 1.82652     ( -0.508529   0.281602 )
Epeak [keV] : 36.5453      (   )
Norm@50keV  : 8.04746E-03    (     )
------------------------------------------------------------
#Fit statistic : Chi-Squared =          57.77 using 59 PHA bins.
# Reduced chi-squared =          1.032 for     56 degrees of freedom
# Null hypothesis probability =   4.095863e-01

Photon flux (15-150 keV)    in 17.91 sec: 0.929891 ( -0.064852  0.064653 ) ph/cm2/s
Energy fluence (15-150 keV)             : 0 ( 0  0 ) ergs/cm2
Band function
Time interval is from   -7.044 sec. to   10.868 sec.

Spectral model in the Band function:
------------------------------------------------------------
Parameters  : value       lower 90%   higher 90%
alpha       : -1.82656   ( 1.86284   0.459143 )
beta        : -10.0000    ( 10   3.55271e-15 )
Epeak [keV] : 36.5409      ( -17.8963 -36.5409 )
Norm@50keV   : 8.04491E-03    ( -0.00199264   0.00716308 )
------------------------------------------------------------
#Fit statistic : Chi-Squared =          57.77 using 59 PHA bins.
# Reduced chi-squared =          1.050 for     55 degrees of freedom
# Null hypothesis probability =   3.732165e-01

Photon flux (15-150 keV)    in 17.91 sec: 0.932766 ( -0.061721  0.05804 ) ph/cm2/s
Energy fluence (15-150 keV)             : 4.59723e-07 ( 0  0 ) ergs/cm2
Single BB
Spectral model blackbody:
------------------------------------------------------------
Parameters  : value    Lower 90%  Upper 90%
kT [keV]    : 10.2237  (  )
R^2/D10^2   : 0.382396  (   )
(R is the radius in km and D10 is the distance to the source in units of 10 kpc)
------------------------------------------------------------
#Fit statistic : Chi-Squared =         120.38 using 59 PHA bins.
# Reduced chi-squared =         2.1119 for     57 degrees of freedom
# Null hypothesis probability =   1.966086e-06

Energy  Fluence     90% Error
[keV]   [erg/cm2]   [erg/cm2]
15- 25  1.468e-07   1.676e-08
25- 50  3.766e-07   2.678e-08
50-150  2.095e-07   3.634e-08
15-150  7.329e-07   5.534e-08
Thermal bremsstrahlung (OTTB)
Spectral model: thermal bremsstrahlung
------------------------------------------------------------
Parameters  : value         Lower 90%    Upper 90%
kT [keV]    : 67.4885       (-12.4904      17.1493)
Norm        : 4.60531       (-0.493393     0.570241)
------------------------------------------------------------
#Fit statistic : Chi-Squared =          60.54 using 59 PHA bins.
# Reduced chi-squared =          1.062 for     57 degrees of freedom
# Null hypothesis probability =   3.491950e-01

Energy  Fluence     90% Error
[keV]   [erg/cm2]   [erg/cm2]
15- 25  2.107e-07   2.095e-08
25- 50  3.320e-07   2.176e-08
50-150  4.148e-07   6.295e-08
15-150  9.575e-07   8.131e-08
Double BB
Spectral model: bbodyrad<1> + bbodyrad<2>
------------------------------------------------------------
Parameters  : value         Lower 90%    Upper 90%
kT1 [keV]   : 5.45121        (-1.04116      1.12317)
R1^2/D10^2  : 3.14132        (-1.5713      4.28378)
kT2 [keV]   : 19.3243        (-3.45797      5.3044)
R2^2/D10^2  : 2.46365E-02    (-0.0151187   0.0306056)
------------------------------------------------------------
#Fit statistic : Chi-Squared =          59.50 using 59 PHA bins.
# Reduced chi-squared =          1.082 for     55 degrees of freedom
# Null hypothesis probability =   3.151474e-01

Energy  Fluence     90% Error
[keV]   [erg/cm2]   [erg/cm2]
15- 25  2.232e-07   6.426e-08
25- 50  3.101e-07   7.596e-08
50-150  4.406e-07   1.435e-07
15-150  9.738e-07   2.542e-07
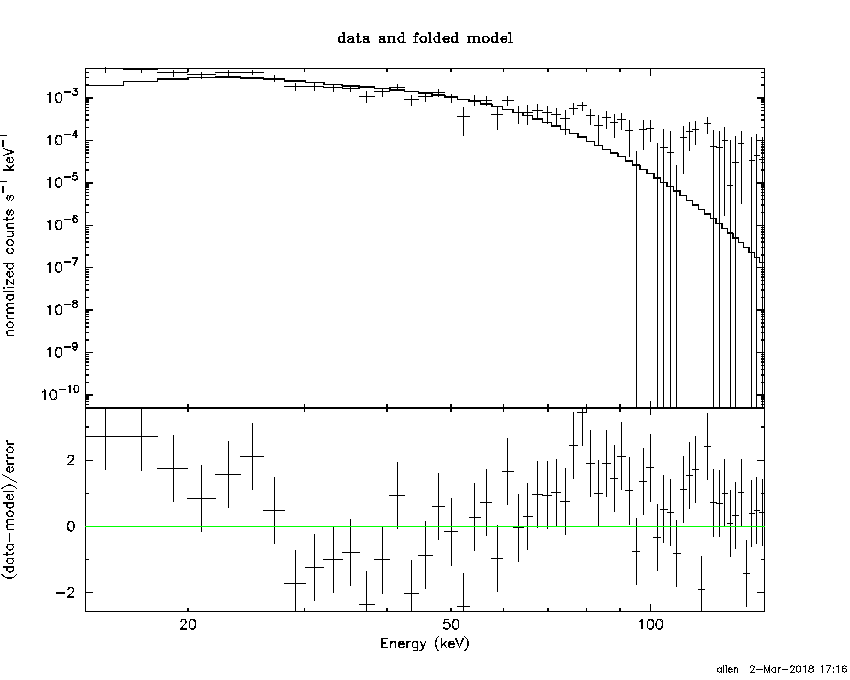
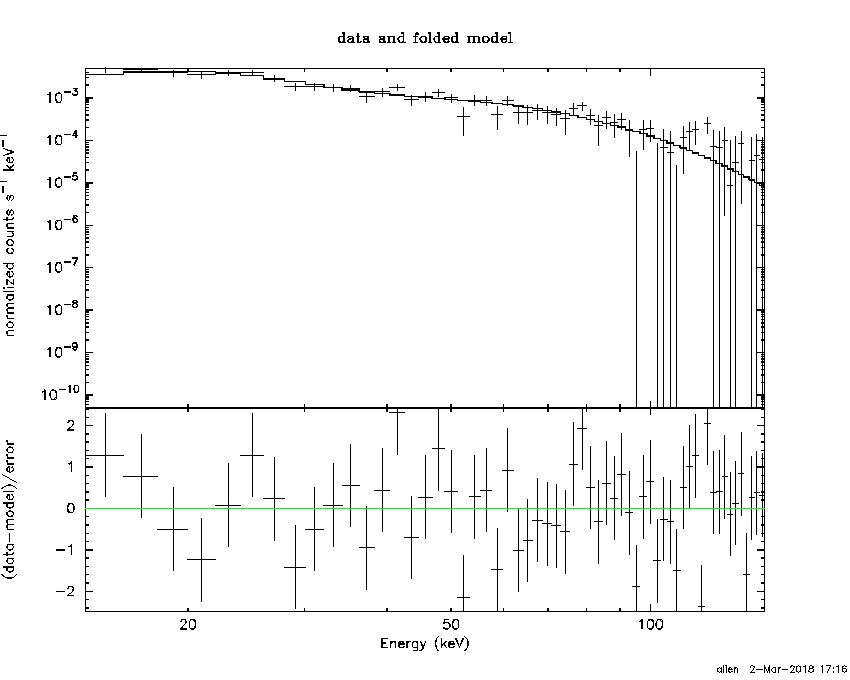
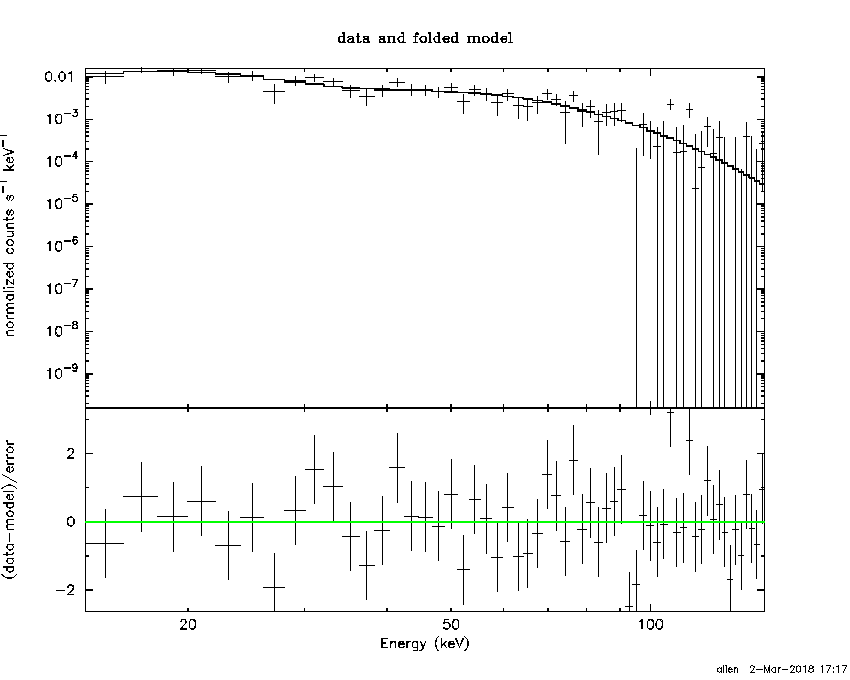
Peak spectrum fit
Power-law model
Time interval is from   -0.196 sec. to    0.804 sec.

Spectral model in power-law:
------------------------------------------------------------
Parameters  : value       lower 90%   higher 90%
Photon index: 1.72493     ( -0.142265   0.146312 )
Norm@50keV  : 2.51720E-02    ( -0.00230686   0.00228199 )
------------------------------------------------------------
#Fit statistic : Chi-Squared =          68.73 using 59 PHA bins.
# Reduced chi-squared =          1.206 for     57 degrees of freedom
# Null hypothesis probability =   1.372523e-01

Photon flux (15-150 keV)    in 1 sec: 3.37293 ( -0.28658  0.28681 ) ph/cm2/s
Energy fluence (15-150 keV)             : 2.3267e-07 ( -2.20644e-08  2.22771e-08 ) ergs/cm2
Cutoff power-law model

Time interval is from   -0.196 sec. to    0.804 sec.
Spectral model in the cutoff power-law:
------------------------------------------------------------
Parameters  : value       lower 90%   higher 90%
Photon index: 1.05344     ( -0.653394   0.572383 )
Epeak [keV] : 68.4196      ( -15.0139 98.8099 )
Norm@50keV  : 5.62287E-02    ( -0.0273744   0.064065 )
------------------------------------------------------------
#Fit statistic : Chi-Squared =          64.63 using 59 PHA bins.
# Reduced chi-squared =          1.154 for     56 degrees of freedom
# Null hypothesis probability =   2.007335e-01

Photon flux (15-150 keV)    in 1 sec: 3.28812 ( -0.2967  0.29591 ) ph/cm2/s
Energy fluence (15-150 keV)             : 2.23254e-07 ( -2.33599e-08  2.36568e-08 ) ergs/cm2
Band function
Time interval is from   -0.196 sec. to    0.804 sec.

Spectral model in the Band function:
------------------------------------------------------------
Parameters  : value       lower 90%   higher 90%
alpha       : -1.05326   ( -0.501839   0.736018 )
beta        : -10.0000    ( 10   3.55271e-15 )
Epeak [keV] : 68.3936      ( -14.4153 99.3297 )
Norm@50keV   : 5.62406E-02    ( -0.0273828   0.0640773 )
------------------------------------------------------------
#Fit statistic : Chi-Squared =          64.63 using 59 PHA bins.
# Reduced chi-squared =          1.175 for     55 degrees of freedom
# Null hypothesis probability =   1.756695e-01

Photon flux (15-150 keV)    in 1 sec: 3.30449 ( -0.3165  0.27515 ) ph/cm2/s
Energy fluence (15-150 keV)             : 2.25959e-07 ( -2.45448e-08  2.10882e-08 ) ergs/cm2
Single BB
Spectral model blackbody:
------------------------------------------------------------
Parameters  : value    Lower 90%  Upper 90%
kT [keV]    : 13.5843  (-1.34385  1.47355)
R^2/D10^2   : 0.530137  (-0.165043   0.24192)
(R is the radius in km and D10 is the distance to the source in units of 10 kpc)
------------------------------------------------------------
#Fit statistic : Chi-Squared =          91.82 using 59 PHA bins.
# Reduced chi-squared =          1.611 for     57 degrees of freedom
# Null hypothesis probability =   2.365985e-03

Energy  Fluence     90% Error
[keV]   [erg/cm2]   [erg/cm2]
15- 25  2.071e-08   3.120e-09
25- 50  7.472e-08   8.330e-09
50-150  8.936e-08   1.587e-08
15-150  1.848e-07   2.075e-08
Thermal bremsstrahlung (OTTB)

Spectral model: thermal bremsstrahlung
------------------------------------------------------------
Parameters  : value         Lower 90%    Upper 90%
kT [keV]    : 128.433       (-37.2787      57.8659)
Norm        : 14.1027       (-1.40881     1.77798)
------------------------------------------------------------
#Fit statistic : Chi-Squared =          65.23 using 59 PHA bins.
# Reduced chi-squared =          1.144 for     57 degrees of freedom
# Null hypothesis probability =   2.124606e-01

Energy  Fluence     90% Error
[keV]   [erg/cm2]   [erg/cm2]
15- 25  3.662e-08   4.185e-09
25- 50  6.626e-08   8.700e-09
50-150  1.222e-07   5.027e-08
15-150  2.250e-07   6.210e-08
Double BB
Spectral model: bbodyrad<1> + bbodyrad<2>
------------------------------------------------------------
Parameters  : value         Lower 90%    Upper 90%
kT1 [keV]   : 4.37407        (-1.21484      1.7223)
R1^2/D10^2  : 19.7212        (-14.5371      74.2598)
kT2 [keV]   : 17.7103        (-2.36701      3.36424)
R2^2/D10^2  : 0.176194    (-0.0894469   0.132133)
------------------------------------------------------------
#Fit statistic : Chi-Squared =          61.95 using 59 PHA bins.
# Reduced chi-squared =          1.126 for     55 degrees of freedom
# Null hypothesis probability =   2.421276e-01

Energy  Fluence     90% Error
[keV]   [erg/cm2]   [erg/cm2]
15- 25  3.833e-08   1.689e-08
25- 50  6.340e-08   1.569e-08
50-150  1.154e-07   2.879e-08
15-150  2.172e-07   4.730e-08
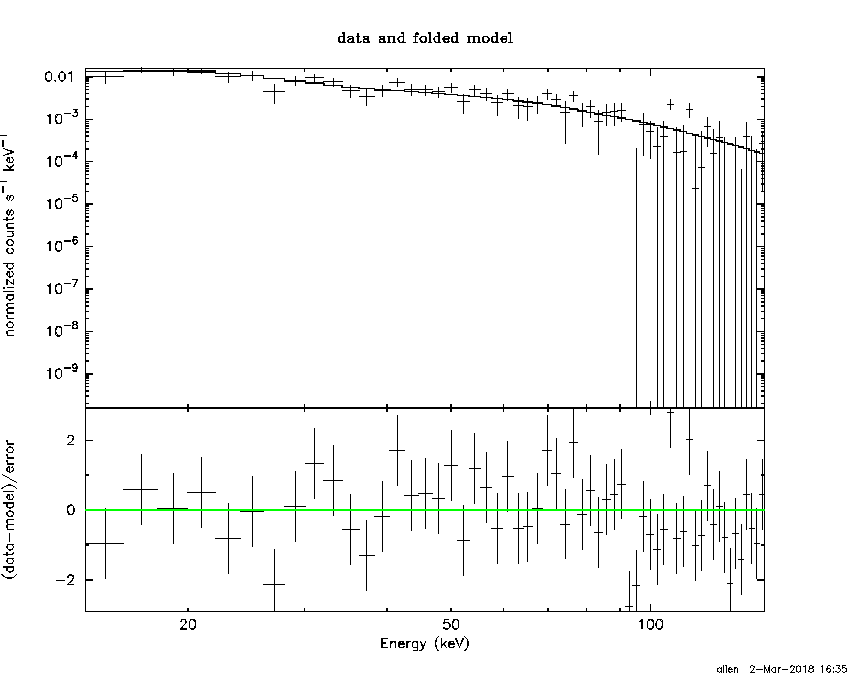
Pre-slew spectrum (Pre-slew PHA with pre-slew DRM)
Power-law model
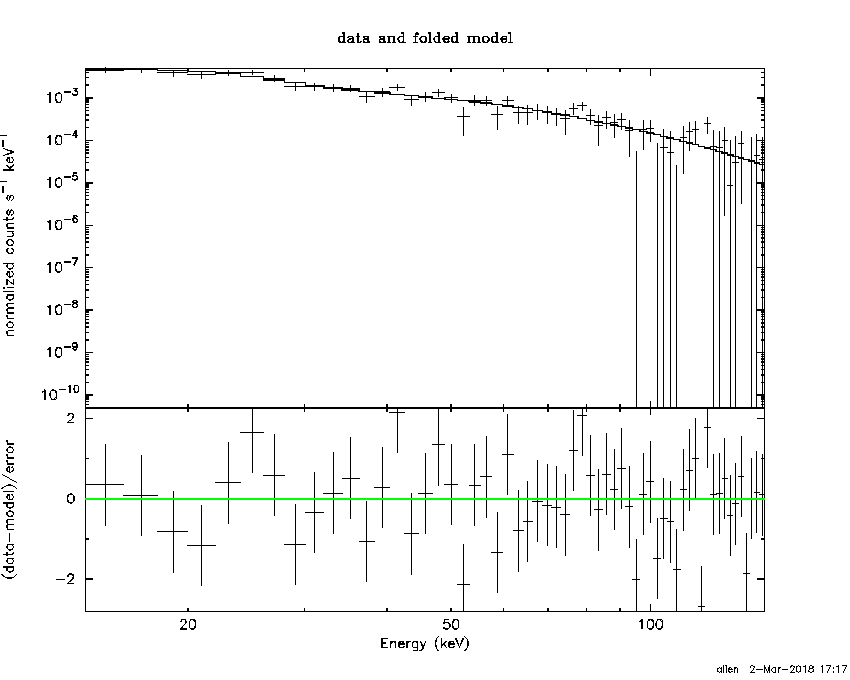
Spectral model in power-law:
------------------------------------------------------------
Parameters  : value       lower 90%   higher 90%
Photon index: 2.03639     ( -0.124096   0.128216 )
Norm@50keV  : 6.16328E-03    ( -0.000483306   0.000475738 )
------------------------------------------------------------
#Fit statistic : Chi-Squared =          58.36 using 59 PHA bins.
# Reduced chi-squared =          1.024 for     57 degrees of freedom
# Null hypothesis probability =   4.250441e-01

Photon flux (15-150 keV)    in 17.91 sec: 0.940306 ( -0.0607555  0.0608374 ) ph/cm2/s
Energy fluence (15-150 keV)             : 1.0202e-06 ( -7.41239e-08  7.48941e-08 ) ergs/cm2
Cutoff power-law model

Spectral model in the cutoff power-law:
------------------------------------------------------------
Parameters  : value       lower 90%   higher 90%
Photon index: 1.82652     ( -0.508529   0.300685 )
Epeak [keV] : 36.5454      (   )
Norm@50keV  : 8.04747E-03    (     )
------------------------------------------------------------
#Fit statistic : Chi-Squared =          57.77 using 59 PHA bins.
# Reduced chi-squared =          1.032 for     56 degrees of freedom
# Null hypothesis probability =   4.095863e-01

Photon flux (15-150 keV)    in 17.91 sec: 0.929660 ( -0.064817  0.064823 ) ph/cm2/s
Energy fluence (15-150 keV)             : 1.00007e-06 ( -8.60844e-08  8.67131e-08 ) ergs/cm2
Band function

Spectral model in the Band function:
------------------------------------------------------------
Parameters  : value       lower 90%   higher 90%
alpha       : -1.82656   ( 1.86284   0.459143 )
beta        : -10.0000    ( 10   3.55271e-15 )
Epeak [keV] : 36.5409      ( -17.8963 -36.5409 )
Norm@50keV   : 8.04491E-03    ( -0.00199263   0.00716308 )
------------------------------------------------------------
#Fit statistic : Chi-Squared =          57.77 using 59 PHA bins.
# Reduced chi-squared =          1.050 for     55 degrees of freedom
# Null hypothesis probability =   3.732165e-01

Photon flux (15-150 keV)    in 17.91 sec: 0.932766 ( -0.061721  0.05804 ) ph/cm2/s
Energy fluence (15-150 keV)             : 4.59723e-07 ( 0  0 ) ergs/cm2
S(25-50 keV) vs. S(50-100 keV) plot
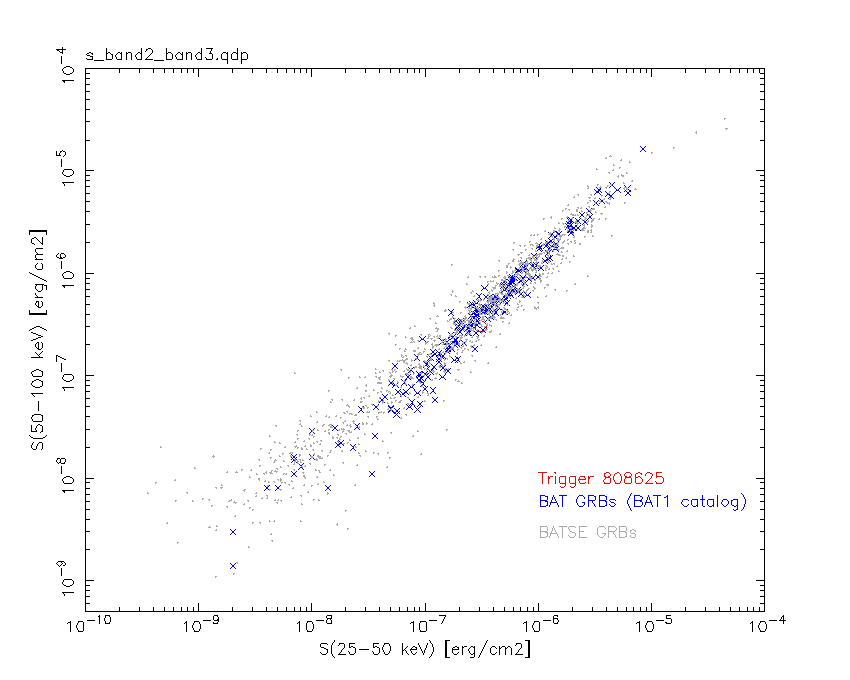
S(25-50 keV)  = 3.10e-07
S(50-100 keV) = 3.03e-07
T90 vs. Hardness ratio plot
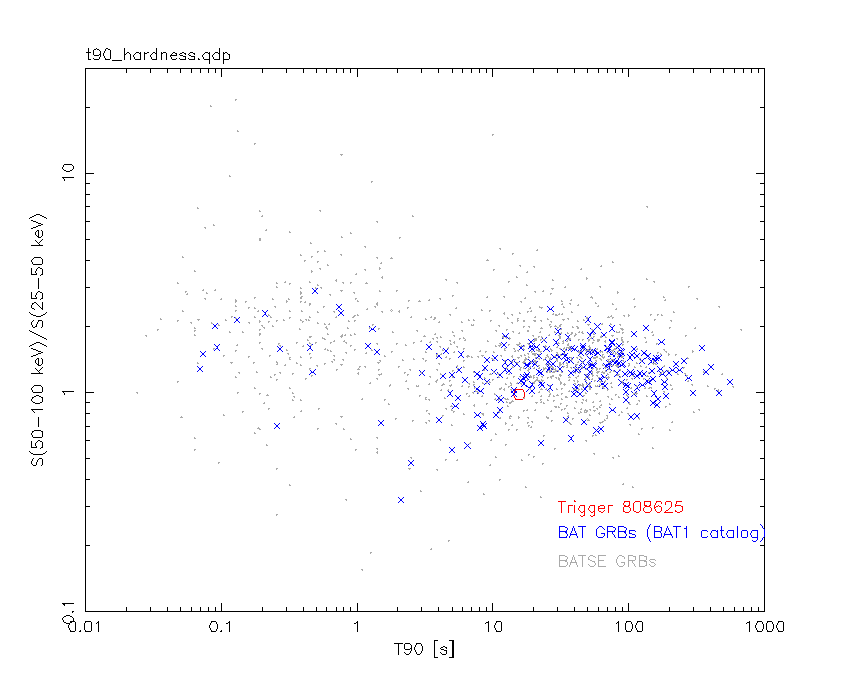
T90                                   = 15.5359998941422 sec.
Hardness ratio (energy fluence ratio) = 0.977419
Color vs. Color plot
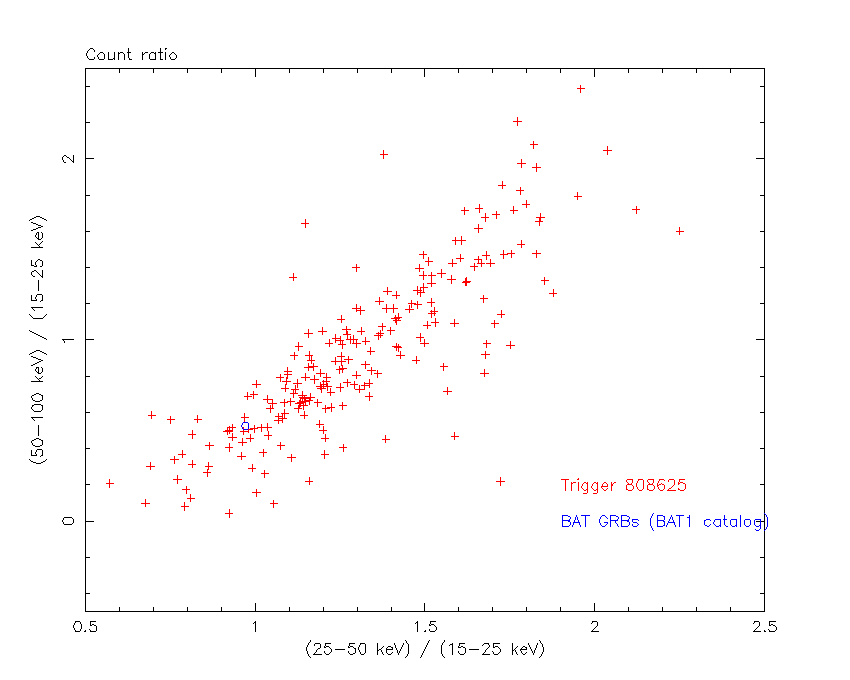
Count Ratio  (25-50 keV) / (15-25 keV) = 0.970445
Count Ratio (50-100 keV) / (15-25 keV) = 0.524654
Mask shadow pattern
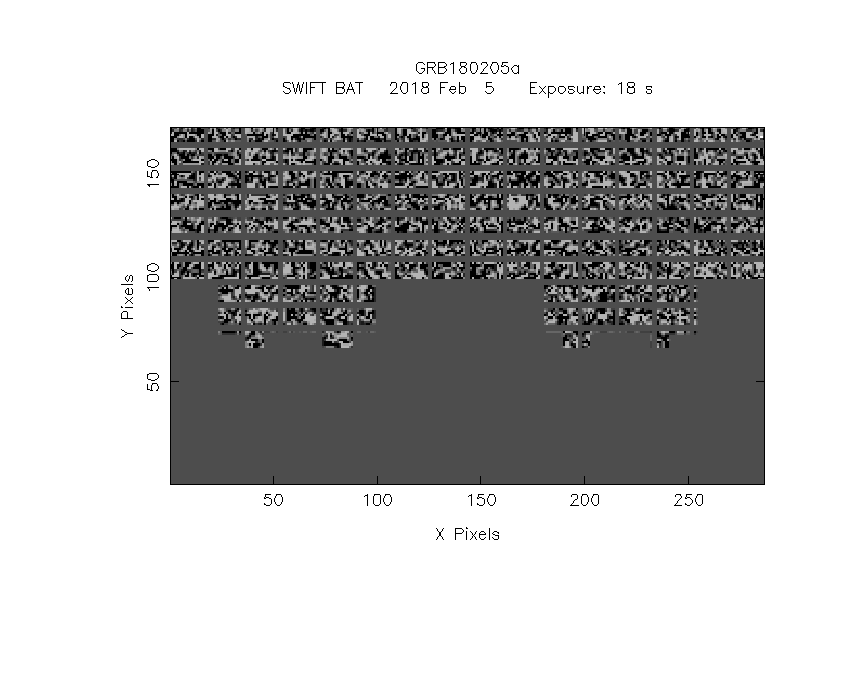
IMX = 1.830738376657725E-02, IMY = -4.883774127948993E-01
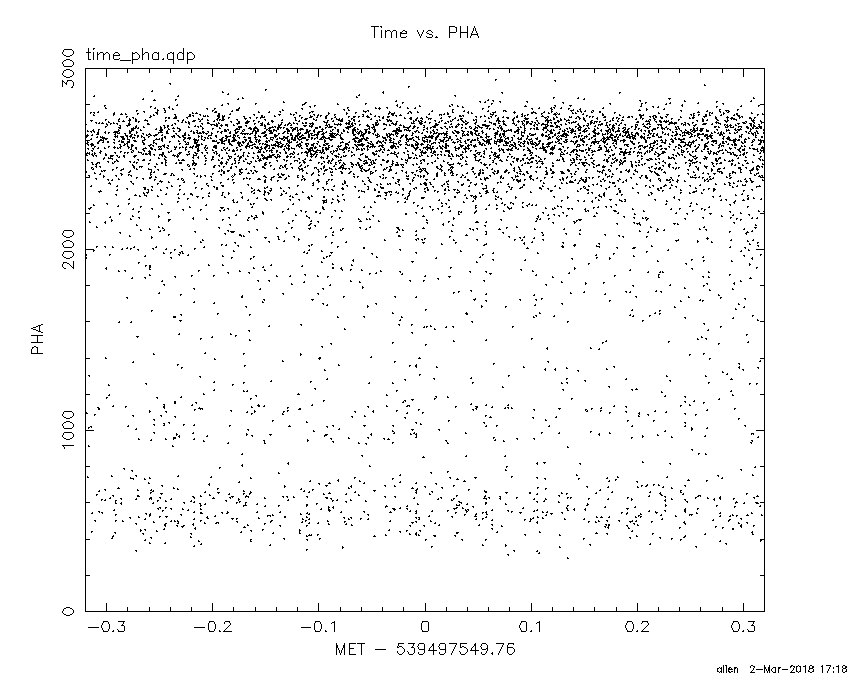
TIME vs. PHA plot around the trigger time
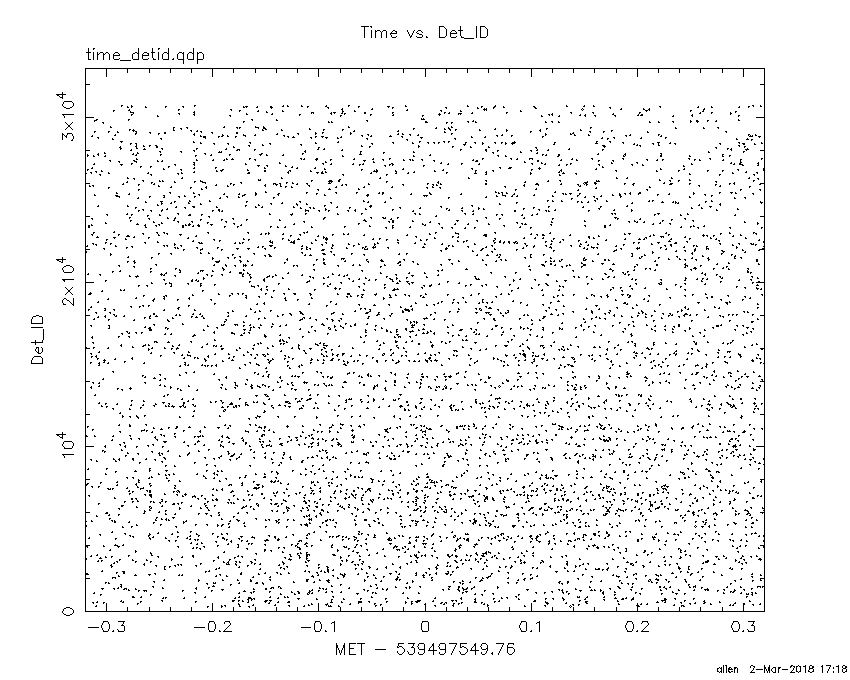
TIME vs. DetID plot around the trigger time
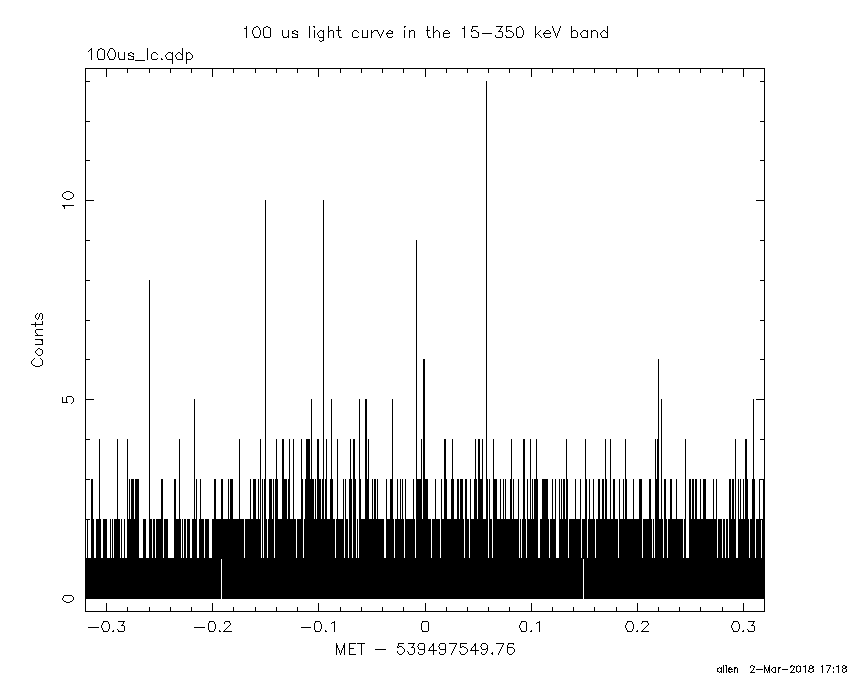
100 us light curve (15-350 keV)
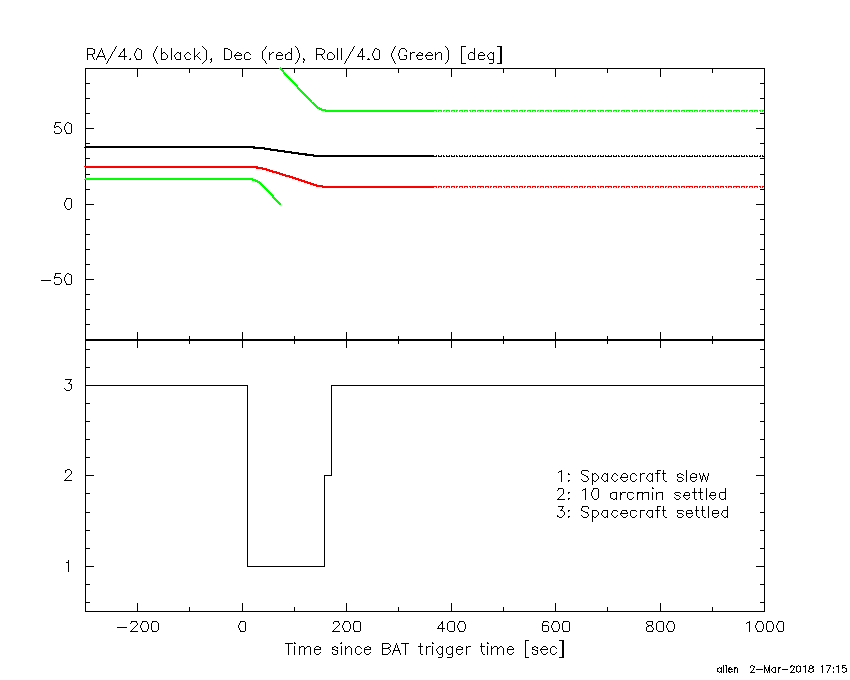
Spacecraft aspect plot
Bright source in the pre-burst/pre-slew/post-slew images
Pre-burst image of 15-350 keV band
Time interval of the image:
-239.760000 -7.044000

# RAcent  DECcent POSerr Theta    Phi  PeakCts   SNR AngSep     Name
#  [deg]    [deg]    ['] [deg]  [deg]                   [']
 95.6817  48.5338    3.3  48.8  157.8   2.6003   3.5 ------	UNKNOWN
156.8300 -28.6912    3.8  53.7   17.1   3.1284   3.0 ------	UNKNOWN
162.4127 -30.0494    2.5  55.9   11.5   5.7319   4.6 ------	UNKNOWN
170.2989 -28.9008    2.8  56.8    3.2   5.2528   4.1 ------	UNKNOWN
161.9509   5.8307    3.0  21.8   -8.1   0.7810   3.8 ------	UNKNOWN
121.5343  72.7392    3.0  50.6 -166.8   2.3017   3.9 ------	UNKNOWN
192.0700  32.0593    2.6  37.0  -87.3   3.0364   4.4 ------	UNKNOWN
193.4097  12.6243    3.3  42.2  -57.5   2.2499   3.5 ------	UNKNOWN
196.0616  61.8021    3.0  48.0 -129.2   3.8694   3.8 ------	UNKNOWN
Pre-slew background subtracted image of 15-350 keV band
Time interval of the image:
-7.044000 10.868000

# RAcent  DECcent POSerr Theta    Phi  PeakCts   SNR AngSep     Name
#  [deg]    [deg]    ['] [deg]  [deg]                   [']
126.8193  11.5362    0.4  26.0   87.9   1.9886  26.7 ------	UNKNOWN
181.8479  -8.2520    2.6  44.9  -22.9   0.3801   4.3 ------	UNKNOWN
195.8059  62.6788    2.7  48.3 -130.3   1.0000   4.3 ------	UNKNOWN
Post-slew image of 15-350 keV band
Time interval of the image:
156.740600 842.290000

# RAcent  DECcent POSerr Theta    Phi  PeakCts   SNR AngSep     Name
#  [deg]    [deg]    ['] [deg]  [deg]                   [']
 83.6245  22.0138    0.6  42.5  -47.7  20.6295  20.6    0.5	Crab
135.5746 -40.5385   11.0  52.8 -166.1   1.7224   1.0    2.3	Vela X-1
104.8270  65.4672    3.3  55.9   11.5  10.1950   3.5 ------	UNKNOWN
 88.9833  56.0860    3.0  53.2   -3.0   4.6589   3.8 ------	UNKNOWN
Plot creation:
Fri Mar  2 17:19:04 EST 2018