Special notes of this burst
Image
Pre-slew 15.0-350.0 keV image (Event data)

#   RAcent    DECcent   POSerr    Theta     Phi              Peak Cts       SNR   Name
  202.6722    38.0750   0.0092    19.3904   -34.6173         0.9661128     20.866 TRIG_00811561

Foreground time interval of the image:
 -0.472  11.045 (delta_t =  11.517 [sec])
Background time interval of the image:
-239.256  -0.472 (delta_t = 238.784 [sec])
Lightcurves
Notes:
- 1) The mask-weighted light curves are using the flight position.
- 2) Multiple plots of different time binning/intervals are shown to cover all scenarios of short/long GRBs, rate/image triggers, and real/false positives.
- 3) For all the mask-weighted lightcurves, the y-axis units are counts/sec/det where a det is 0.4 x 0.4 = 0.16 sq cm.
- 4) The verticle lines correspond to following: green dotted lines are T50 interval, black dotted lines are T90 interval, blue solid line(s) is a spacecraft slew start time, and orange solid line(s) is a spacecraft slew end time.
- 5) Time of each bin is in the middle of the bin.
1 s binning
From T0-310 s to T0+310 s

From T100_start - 20 s to T100_end + 30 s

Full time interval

64 ms binning
Full time interval

From T100_start to T100_end
From T0-5 sec to T0+5 sec

16 ms binning
From T100_start-5 s to T100_start+5 s

Blue+Cyan dotted lines: Time interval of the scaled map
From 0.000000 to 1.024000
8 ms binning
From T100_start-3 s to T100_start+3 s
Blue+Cyan dotted lines: Time interval of the scaled map
From 0.000000 to 1.024000
2 ms binning
From T100_start-1 s to T100_start+1 s
Blue+Cyan dotted lines: Time interval of the scaled map
From 0.000000 to 1.024000
SN=5 or 10 sec. binning (whichever binning is satisfied first)

SN=5 or 10 sec. binning (T < 200 sec)
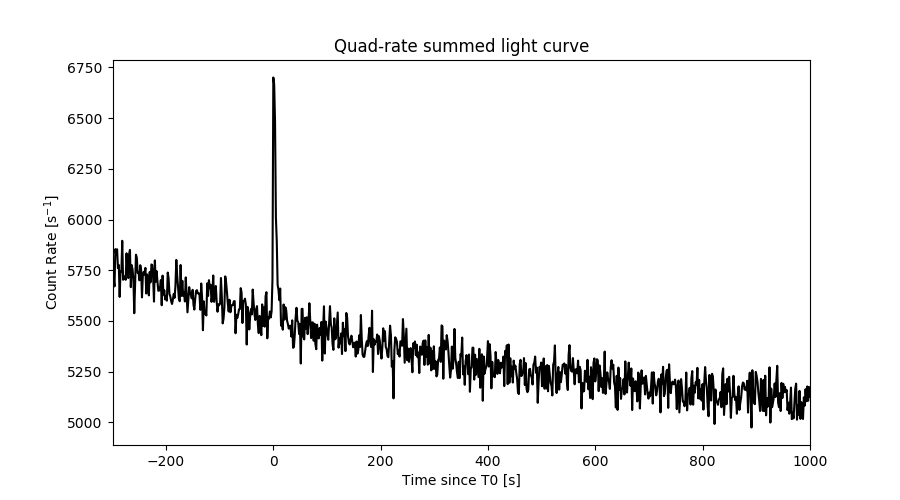
Quad-rate summed light curves (from T0-300s to T0+1000s)
Spectral Evolution

Spectra
Notes:
- 1) The fitting includes the systematic errors.
- 2) When the burst includes telescope slew time periods, the fitting uses an average response file made from multiple 5-s response files through out the slew time plus single time preiod for the non-slew times, and weighted by the total counts in the corresponding time period using addrmf. An average response file is needed becuase a spectral fit using the pre-slew DRM will introduce some errors in both a spectral shape and a normalization if the PHA file contains a lot of the slew/post-slew time interval.
- 3) For fits to more complicated models (e.g. a power-law over a cutoff power-law), the BAT team has decided to require a chi-square improvement of more than 6 for each extra dof.
Time averaged spectrum fit using the average DRM
Power-law model

Time interval is from   -0.472 sec. to   14.572 sec.

Spectral model in power-law:
------------------------------------------------------------
Parameters  : value       lower 90%   higher 90%
Photon index: 2.10499     ( -0.170695   0.17978 )
Norm@50keV  : 3.34061E-03    ( -0.000397766   0.000390573 )
------------------------------------------------------------
#Fit statistic : Chi-Squared =          37.51 using 59 PHA bins.
# Reduced chi-squared =         0.6581 for     57 degrees of freedom
# Null hypothesis probability =   9.784932e-01

Photon flux (15-150 keV)    in 15.04 sec: 0.526909 ( -0.044795  0.0448 ) ph/cm2/s
Energy fluence (15-150 keV)             : 4.6713e-07 ( -4.91289e-08  5.04381e-08 ) ergs/cm2
Cutoff power-law model

Time interval is from   -0.472 sec. to   14.572 sec.
Spectral model in the cutoff power-law:
------------------------------------------------------------
Parameters  : value       lower 90%   higher 90%
Photon index: 1.48981     ( -0.959629   0.623981 )
Epeak [keV] : 32.3344      ( -28.1276 17.5372 )
Norm@50keV  : 7.80513E-03    ( -0.004868   0.0221186 )
------------------------------------------------------------
#Fit statistic : Chi-Squared =          35.63 using 59 PHA bins.
# Reduced chi-squared =         0.6363 for     56 degrees of freedom
# Null hypothesis probability =   9.845923e-01

Photon flux (15-150 keV)    in 15.04 sec: 0.512171 ( -0.048139  0.048232 ) ph/cm2/s
Energy fluence (15-150 keV)             : 4.32541e-07 ( -5.95164e-08  6.49641e-08 ) ergs/cm2
Band function
Time interval is from   -0.472 sec. to   14.572 sec.

Spectral model in the Band function:
------------------------------------------------------------
Parameters  : value       lower 90%   higher 90%
alpha       : -1.49043   ( -3.40415   0.204276 )
beta        : -10.00000    ( 10   20 )
Epeak [keV] : 32.3244      ( -8.48763 17.7087 )
Norm@50keV   : 7.79680E-03    ( -0.000660284   0.0221439 )
------------------------------------------------------------
#Fit statistic : Chi-Squared =          35.63 using 59 PHA bins.
# Reduced chi-squared =         0.6479 for     55 degrees of freedom
# Null hypothesis probability =   9.801594e-01

Photon flux (15-150 keV)    in 15.04 sec: 0.512110 ( -0.047391  0.047398 ) ph/cm2/s
Energy fluence (15-150 keV)             : 3.36696e-07 ( 7.05135e-08  1.63232e-07 ) ergs/cm2
Single BB

Spectral model blackbody:
------------------------------------------------------------
Parameters  : value    Lower 90%  Upper 90%
kT [keV]    : 8.94190  (-0.83043  0.923791)
R^2/D10^2   : 0.368637  (-0.118226   0.172943)
(R is the radius in km and D10 is the distance to the source in units of 10 kpc)
------------------------------------------------------------
#Fit statistic : Chi-Squared =          53.16 using 59 PHA bins.
# Reduced chi-squared =         0.9327 for     57 degrees of freedom
# Null hypothesis probability =   6.198472e-01

Energy  Fluence     90% Error
[keV]   [erg/cm2]   [erg/cm2]
15- 25  8.602e-08   1.199e-08
25- 50  1.810e-07   2.181e-08
50-150  6.768e-08   1.920e-08
15-150  3.347e-07   3.610e-08
Thermal bremsstrahlung (OTTB)

Spectral model: thermal bremsstrahlung
------------------------------------------------------------
Parameters  : value         Lower 90%    Upper 90%
kT [keV]    : 53.0932       (-12.0041      18.2239)
Norm        : 2.87421       (-0.408777     0.518831)
------------------------------------------------------------
#Fit statistic : Chi-Squared =          35.72 using 59 PHA bins.
# Reduced chi-squared =         0.6266 for     57 degrees of freedom
# Null hypothesis probability =   9.877951e-01

Energy  Fluence     90% Error
[keV]   [erg/cm2]   [erg/cm2]
15- 25  1.071e-07   1.217e-08
25- 50  1.570e-07   1.569e-08
50-150  1.612e-07   4.576e-08
15-150  4.253e-07   5.256e-08
Double BB

Spectral model: bbodyrad<1> + bbodyrad<2>
------------------------------------------------------------
Parameters  : value         Lower 90%    Upper 90%
kT1 [keV]   : 6.53935        (-3.0585      1.57927)
R1^2/D10^2  : 0.976429        (-0.490017      0.684616)
kT2 [keV]   : 21.5239        (-10.4885      35.8838)
R2^2/D10^2  : 6.90198E-03    (-0.00622393   0.116761)
------------------------------------------------------------
#Fit statistic : Chi-Squared =          37.30 using 59 PHA bins.
# Reduced chi-squared =         0.6782 for     55 degrees of freedom
# Null hypothesis probability =   9.676412e-01

Energy  Fluence     90% Error
[keV]   [erg/cm2]   [erg/cm2]
15- 25  1.025e-07   3.733e-08
25- 50  1.587e-07   5.278e-08
50-150  1.766e-07   9.748e-08
15-150  4.378e-07   1.714e-07
Peak spectrum fit
Power-law model

Time interval is from    0.396 sec. to    1.396 sec.

Spectral model in power-law:
------------------------------------------------------------
Parameters  : value       lower 90%   higher 90%
Photon index: 1.89884     ( -0.227452   0.241389 )
Norm@50keV  : 9.99795E-03    ( -0.00159957   0.00155718 )
------------------------------------------------------------
#Fit statistic : Chi-Squared =          48.72 using 59 PHA bins.
# Reduced chi-squared =         0.8548 for     57 degrees of freedom
# Null hypothesis probability =   7.742589e-01

Photon flux (15-150 keV)    in 1 sec: 1.43420 ( -0.17831  0.1783 ) ph/cm2/s
Energy fluence (15-150 keV)             : 9.19327e-08 ( -1.41684e-08  1.4587e-08 ) ergs/cm2
Cutoff power-law model

Time interval is from    0.396 sec. to    1.396 sec.
Spectral model in the cutoff power-law:
------------------------------------------------------------
Parameters  : value       lower 90%   higher 90%
Photon index: 1.37834     ( -1.15884   0.800107 )
Epeak [keV] : 48.7573      (   )
Norm@50keV  : 2.02420E-02    (     )
------------------------------------------------------------
#Fit statistic : Chi-Squared =          47.81 using 59 PHA bins.
# Reduced chi-squared =         0.8538 for     56 degrees of freedom
# Null hypothesis probability =   7.736899e-01

Photon flux (15-150 keV)    in 1 sec: 1.40688 ( -0.18414  0.18444 ) ph/cm2/s
Energy fluence (15-150 keV)             : 0 ( 0  0 ) ergs/cm2
Band function

Time interval is from    0.396 sec. to    1.396 sec.

Spectral model in the Band function:
------------------------------------------------------------
Parameters  : value       lower 90%   higher 90%
alpha       : 0.845250   ( -0.8207   -0.8207 )
beta        : -2.14075    ( -2.00537   0.384395 )
Epeak [keV] : 29.1798      ( -29.1381 156.107 )
Norm@50keV   : 0.860212    ( -0.748063   651.532 )
------------------------------------------------------------
#Fit statistic : Chi-Squared =          47.14 using 59 PHA bins.
# Reduced chi-squared =         0.8570 for     55 degrees of freedom
# Null hypothesis probability =   7.656099e-01

Photon flux (15-150 keV)    in 1 sec: 1.41536 ( -0.18163  0.18016 ) ph/cm2/s
Energy fluence (15-150 keV)             : 6.24209e-08 ( 1.16692e-08  4.30566e-08 ) ergs/cm2
Single BB

Spectral model blackbody:
------------------------------------------------------------
Parameters  : value    Lower 90%  Upper 90%
kT [keV]    : 9.81854  (-1.41872  1.69154)
R^2/D10^2   : 0.722109  (-0.326341   0.58359)
(R is the radius in km and D10 is the distance to the source in units of 10 kpc)
------------------------------------------------------------
#Fit statistic : Chi-Squared =          59.58 using 59 PHA bins.
# Reduced chi-squared =          1.045 for     57 degrees of freedom
# Null hypothesis probability =   3.820805e-01

Energy  Fluence     90% Error
[keV]   [erg/cm2]   [erg/cm2]
15- 25  1.409e-08   3.082e-09
25- 50  3.412e-08   6.340e-09
50-150  1.688e-08   5.836e-09
15-150  6.509e-08   1.159e-08
Thermal bremsstrahlung (OTTB)

Spectral model: thermal bremsstrahlung
------------------------------------------------------------
Parameters  : value         Lower 90%    Upper 90%
kT [keV]    : 75.4463       (-25.8294      52.2675)
Norm        : 6.88549       (-1.20382     1.51976)
------------------------------------------------------------
#Fit statistic : Chi-Squared =          47.81 using 59 PHA bins.
# Reduced chi-squared =         0.8387 for     57 degrees of freedom
# Null hypothesis probability =   8.019936e-01

Energy  Fluence     90% Error
[keV]   [erg/cm2]   [erg/cm2]
15- 25  1.779e-08   3.120e-09
25- 50  2.887e-08   4.555e-09
50-150  3.914e-08   1.930e-08
15-150  8.579e-08   2.043e-08
Double BB

Spectral model: bbodyrad<1> + bbodyrad<2>
------------------------------------------------------------
Parameters  : value         Lower 90%    Upper 90%
kT1 [keV]   : 6.13692        (-2.003      2.15924)
R1^2/D10^2  : 3.01477        (-1.88285      8.84761)
kT2 [keV]   : 20.6203        (-7.41674      25.767)
R2^2/D10^2  : 2.87412E-02    (-0.0265137   0.143861)
------------------------------------------------------------
#Fit statistic : Chi-Squared =          47.17 using 59 PHA bins.
# Reduced chi-squared =         0.8576 for     55 degrees of freedom
# Null hypothesis probability =   7.646338e-01

Energy  Fluence     90% Error
[keV]   [erg/cm2]   [erg/cm2]
15- 25  1.790e-08   1.016e-08
25- 50  2.813e-08   1.470e-08
50-150  3.904e-08   2.233e-08
15-150  8.507e-08   4.510e-08
Pre-slew spectrum (Pre-slew PHA with pre-slew DRM)
Power-law model

Spectral model in power-law:
------------------------------------------------------------
Parameters  : value       lower 90%   higher 90%
Photon index: 2.09052     ( -0.156811   0.163848 )
Norm@50keV  : 4.23213E-03    ( -0.000458091   0.000450699 )
------------------------------------------------------------
#Fit statistic : Chi-Squared =          44.47 using 59 PHA bins.
# Reduced chi-squared =         0.7801 for     57 degrees of freedom
# Null hypothesis probability =   8.866962e-01

Photon flux (15-150 keV)    in 11.52 sec: 0.662726 ( -0.0523705  0.0523794 ) ph/cm2/s
Energy fluence (15-150 keV)             : 4.5257e-07 ( -4.3792e-08  4.48084e-08 ) ergs/cm2
Cutoff power-law model

Spectral model in the cutoff power-law:
------------------------------------------------------------
Parameters  : value       lower 90%   higher 90%
Photon index: 1.45628     ( -0.942481   0.573642 )
Epeak [keV] : 33.0474      (   )
Norm@50keV  : 1.02172E-02    (     )
------------------------------------------------------------
#Fit statistic : Chi-Squared =          42.26 using 59 PHA bins.
# Reduced chi-squared =         0.7546 for     56 degrees of freedom
# Null hypothesis probability =   9.128970e-01

Photon flux (15-150 keV)    in 11.52 sec: 0.643414 ( -0.056664  0.056554 ) ph/cm2/s
Energy fluence (15-150 keV)             : 4.16718e-07 ( -5.54769e-08  5.976e-08 ) ergs/cm2
Band function

Spectral model in the Band function:
------------------------------------------------------------
Parameters  : value       lower 90%   higher 90%
alpha       : -0.758585   ( -0.95312   4.3562 )
beta        : -2.52611    ( 2.52582   0.435182 )
Epeak [keV] : 31.9758      ( -9.37875 8.15524 )
Norm@50keV   : 2.98744E-02    ( -0.0308645   107.161 )
------------------------------------------------------------
#Fit statistic : Chi-Squared =          40.20 using 59 PHA bins.
# Reduced chi-squared =         0.7309 for     55 degrees of freedom
# Null hypothesis probability =   9.328070e-01

Photon flux (15-150 keV)    in 11.52 sec: 0.662782 ( -0.052376  0.052385 ) ph/cm2/s
Energy fluence (15-150 keV)             : 4.5265e-07 ( -4.3754e-08  4.48039e-08 ) ergs/cm2
S(25-50 keV) vs. S(50-100 keV) plot

S(25-50 keV)  = 1.45e-07
S(50-100 keV) = 1.35e-07
T90 vs. Hardness ratio plot
T90                                   = 10.9199999570847 sec.
Hardness ratio (energy fluence ratio) = 0.931034
Color vs. Color plot

Count Ratio  (25-50 keV) / (15-25 keV) = 1.07705
Count Ratio (50-100 keV) / (15-25 keV) = 0.400136
Mask shadow pattern

IMX = 2.896559014788390E-01, IMY = 1.999493210829509E-01
TIME vs. PHA plot around the trigger time

Blue+Cyan dotted lines: Time interval of the scaled map
From 0.000000 to 1.024000
TIME vs. DetID plot around the trigger time
Blue+Cyan dotted lines: Time interval of the scaled map
From 0.000000 to 1.024000
100 us light curve (15-350 keV)

Blue+Cyan dotted lines: Time interval of the scaled map
From 0.000000 to 1.024000
Spacecraft aspect plot

Bright source in the pre-burst/pre-slew/post-slew images
Pre-burst image of 15-350 keV band
Time interval of the image:
-239.256000 -0.472000

# RAcent  DECcent POSerr Theta    Phi  PeakCts   SNR AngSep     Name
#  [deg]    [deg]    ['] [deg]  [deg]                   [']
194.9327  33.4589    3.4  14.1  -14.5   0.7365   3.4 ------	UNKNOWN
Pre-slew background subtracted image of 15-350 keV band
Time interval of the image:
-0.472000 11.044600

# RAcent  DECcent POSerr Theta    Phi  PeakCts   SNR AngSep     Name
#  [deg]    [deg]    ['] [deg]  [deg]                   [']
189.9599  -6.8495    2.3  45.2   49.6   0.9673   5.1 ------	UNKNOWN
229.8938   4.1730    2.1  57.5   -2.0   1.4967   5.6 ------	UNKNOWN
202.6722  38.0750    0.6  19.4  -34.6   0.9661  20.9 ------	UNKNOWN
104.2023  48.7745    2.4  53.3 -166.0   0.6704   4.7 ------	UNKNOWN
Post-slew image of 15-350 keV band
Time interval of the image:
63.644600 962.807700

# RAcent  DECcent POSerr Theta    Phi  PeakCts   SNR AngSep     Name
#  [deg]    [deg]    ['] [deg]  [deg]                   [']
254.4493  35.3753    6.3  41.1  -78.6   5.8218   1.8    2.0	Her X-1
174.5791  11.4671    3.1  36.5   74.9   5.3515   3.8 ------	UNKNOWN
168.8708  29.7963    2.8  29.0  107.8   3.7716   4.2 ------	UNKNOWN
232.8636  75.8129    3.2  40.1 -144.8   3.8671   3.6 ------	UNKNOWN
244.5979   0.2250    3.9  54.0  -31.6   8.2406   3.0 ------	UNKNOWN
Plot creation:
Sat Apr  7 22:33:47 EDT 2018