Estimated redshift from machine learning (Ukwatta et al. 2016) - may take a few minute to calcaulte
Image
Pre-slew 15.0-350.0 keV image (Event data)

#   RAcent    DECcent   POSerr    Theta     Phi              Peak Cts       SNR   Name
   99.1732   -24.4947   0.0464    42.2874    35.7193        19.1180942      4.125 TRIG_00814129

Foreground time interval of the image:
-11.800  88.101 (delta_t =  99.901 [sec])
Background time interval of the image:
-12.099 -11.800 (delta_t =   0.299 [sec])
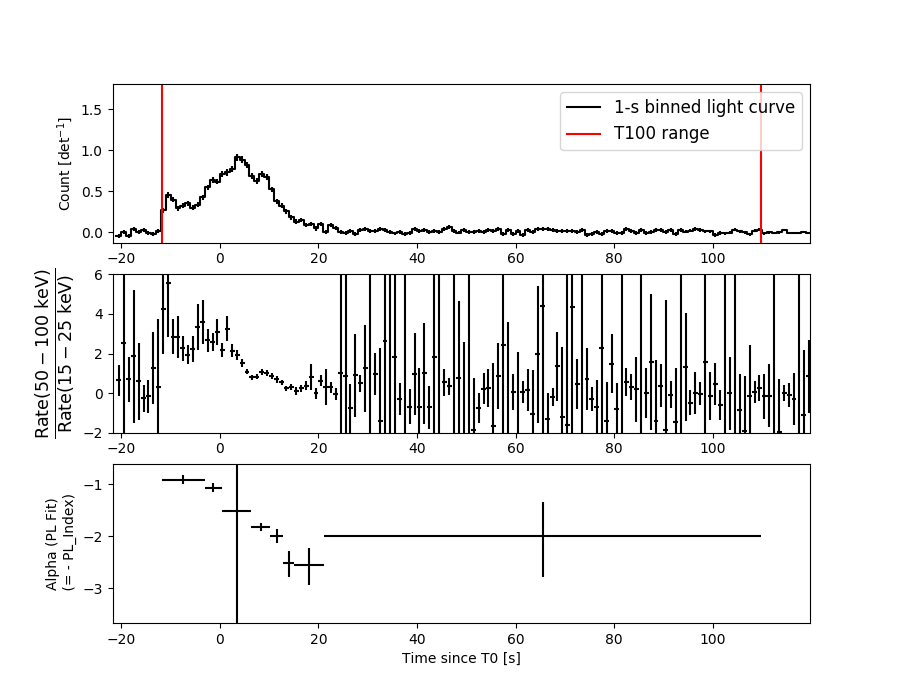
Lightcurves
Notes:
- 1) The mask-weighted light curves are using the flight position.
- 2) Multiple plots of different time binning/intervals are shown to cover all scenarios of short/long GRBs, rate/image triggers, and real/false positives.
- 3) For all the mask-weighted lightcurves, the y-axis units are counts/sec/det where a det is 0.4 x 0.4 = 0.16 sq cm.
- 4) The verticle lines correspond to following: green dotted lines are T50 interval, black dotted lines are T90 interval, blue solid line(s) is a spacecraft slew start time, and orange solid line(s) is a spacecraft slew end time.
- 5) Time of each bin is in the middle of the bin.
1 s binning
From T0-310 s to T0+310 s

From T100_start - 20 s to T100_end + 30 s
Full time interval
64 ms binning
Full time interval

From T100_start to T100_end
From T0-5 sec to T0+5 sec

16 ms binning
From T100_start-5 s to T100_start+5 s
8 ms binning
From T100_start-3 s to T100_start+3 s
2 ms binning
From T100_start-1 s to T100_start+1 s

SN=5 or 10 sec. binning (whichever binning is satisfied first)
SN=5 or 10 sec. binning (T < 200 sec)

Quad-rate summed light curves (from T0-300s to T0+1000s)

Spectral Evolution
Spectra
Notes:
- 1) The fitting includes the systematic errors.
- 2) When the burst includes telescope slew time periods, the fitting uses an average response file made from multiple 5-s response files through out the slew time plus single time preiod for the non-slew times, and weighted by the total counts in the corresponding time period using addrmf. An average response file is needed becuase a spectral fit using the pre-slew DRM will introduce some errors in both a spectral shape and a normalization if the PHA file contains a lot of the slew/post-slew time interval.
- 3) For fits to more complicated models (e.g. a power-law over a cutoff power-law), the BAT team has decided to require a chi-square improvement of more than 6 for each extra dof.
Time averaged spectrum fit using the average DRM
Power-law model

Time interval is from  -11.800 sec. to  109.752 sec.

Spectral model in power-law:
------------------------------------------------------------
Parameters  : value       lower 90%   higher 90%
Photon index: 1.50887     ( -0.0547751   0.0547654 )
Norm@50keV  : 9.54089E-03    ( -0.000300451   0.000300444 )
------------------------------------------------------------
#Fit statistic : Chi-Squared =          74.31 using 59 PHA bins.
# Reduced chi-squared =          1.304 for     57 degrees of freedom
# Null hypothesis probability =   6.152088e-02

Photon flux (15-150 keV)    in 121.6 sec: 1.19397 ( -0.04111  0.04122 ) ph/cm2/s
Energy fluence (15-150 keV)             : 1.09917e-05 ( -3.61415e-07  3.61933e-07 ) ergs/cm2
Cutoff power-law model
Time interval is from  -11.800 sec. to  109.752 sec.
Spectral model in the cutoff power-law:
------------------------------------------------------------
Parameters  : value       lower 90%   higher 90%
Photon index: 0.840543     ( -0.252257   0.239058 )
Epeak [keV] : 94.1900      ( -12.2507 22.8796 )
Norm@50keV  : 1.95499E-02    ( -0.00432112   0.00590558 )
------------------------------------------------------------
#Fit statistic : Chi-Squared =          49.42 using 59 PHA bins.
# Reduced chi-squared =         0.8826 for     56 degrees of freedom
# Null hypothesis probability =   7.203264e-01

Photon flux (15-150 keV)    in 121.6 sec: 1.14839 ( -0.04359  0.04375 ) ph/cm2/s
Energy fluence (15-150 keV)             : 1.06046e-05 ( -3.90397e-07  3.89621e-07 ) ergs/cm2
Band function
Time interval is from  -11.800 sec. to  109.752 sec.

Spectral model in the Band function:
------------------------------------------------------------
Parameters  : value       lower 90%   higher 90%
alpha       : -0.840477   ( -0.248182   2.11229 )
beta        : -9.16025    ( 9.29603   19.293 )
Epeak [keV] : 94.1691      ( -8.27645 22.5181 )
Norm@50keV   : 1.95508E-02    ( -0.0041473   0.00301609 )
------------------------------------------------------------
#Fit statistic : Chi-Squared =          49.42 using 59 PHA bins.
# Reduced chi-squared =         0.8986 for     55 degrees of freedom
# Null hypothesis probability =   6.867270e-01

Photon flux (15-150 keV)    in 121.6 sec: 1.14878 ( -0.04357  0.04215 ) ph/cm2/s
Energy fluence (15-150 keV)             : 5.53011e-07 ( 0  0 ) ergs/cm2
Single BB
Spectral model blackbody:
------------------------------------------------------------
Parameters  : value    Lower 90%  Upper 90%
kT [keV]    : 16.4368  (  )
R^2/D10^2   : 9.82992E-02  (   )
(R is the radius in km and D10 is the distance to the source in units of 10 kpc)
------------------------------------------------------------
#Fit statistic : Chi-Squared =         198.67 using 59 PHA bins.
# Reduced chi-squared =         3.4854 for     57 degrees of freedom
# Null hypothesis probability =   1.444595e-17

Energy  Fluence     90% Error
[keV]   [erg/cm2]   [erg/cm2]
15- 25  6.635e-07   4.195e-08
25- 50  2.856e-06   1.252e-07
50-150  5.447e-06   2.864e-07
15-150  8.967e-06   3.393e-07
Thermal bremsstrahlung (OTTB)

Spectral model: thermal bremsstrahlung
------------------------------------------------------------
Parameters  : value         Lower 90%    Upper 90%
kT [keV]    : 200.000       (-14.0707      -200)
Norm        : 4.92622       (-0.154686     0.154686)
------------------------------------------------------------
#Fit statistic : Chi-Squared =          60.63 using 59 PHA bins.
# Reduced chi-squared =          1.064 for     57 degrees of freedom
# Null hypothesis probability =   3.464626e-01

Energy  Fluence     90% Error
[keV]   [erg/cm2]   [erg/cm2]
15- 25  1.492e-06   4.925e-08
25- 50  2.870e-06   1.009e-07
50-150  6.295e-06   2.183e-07
15-150  1.066e-05   3.721e-07
Double BB

Spectral model: bbodyrad<1> + bbodyrad<2>
------------------------------------------------------------
Parameters  : value         Lower 90%    Upper 90%
kT1 [keV]   : 8.22683        (-1.01724      1.09584)
R1^2/D10^2  : 0.642640        (-0.198962      0.328191)
kT2 [keV]   : 26.4177        (-2.84928      4.08149)
R2^2/D10^2  : 1.39196E-02    (-0.00591375   0.00798762)
------------------------------------------------------------
#Fit statistic : Chi-Squared =          47.82 using 59 PHA bins.
# Reduced chi-squared =         0.8695 for     55 degrees of freedom
# Null hypothesis probability =   7.428661e-01

Energy  Fluence     90% Error
[keV]   [erg/cm2]   [erg/cm2]
15- 25  1.175e-06   1.356e-07
25- 50  2.953e-06   2.772e-07
50-150  6.464e-06   7.515e-07
15-150  1.059e-05   8.998e-07
Peak spectrum fit
Power-law model

Time interval is from    3.052 sec. to    4.052 sec.

Spectral model in power-law:
------------------------------------------------------------
Parameters  : value       lower 90%   higher 90%
Photon index: 1.53271     ( -0.099945   0.101095 )
Norm@50keV  : 6.28088E-02    ( -0.00457525   0.00457045 )
------------------------------------------------------------
#Fit statistic : Chi-Squared =          95.55 using 59 PHA bins.
# Reduced chi-squared =          1.676 for     57 degrees of freedom
# Null hypothesis probability =   1.046342e-03

Photon flux (15-150 keV)    in 1 sec: 7.91217 ( -0.58686  0.58737 ) ph/cm2/s
Energy fluence (15-150 keV)             : 5.92871e-07 ( -4.52123e-08  4.53484e-08 ) ergs/cm2
Cutoff power-law model

Time interval is from    3.052 sec. to    4.052 sec.
Spectral model in the cutoff power-law:
------------------------------------------------------------
Parameters  : value       lower 90%   higher 90%
Photon index: -0.813078     ( -0.703763   0.615479 )
Epeak [keV] : 62.5052      ( -4.69576 5.94635 )
Norm@50keV  : 0.897858    ( -0.440297   1.0349 )
------------------------------------------------------------
#Fit statistic : Chi-Squared =          39.34 using 59 PHA bins.
# Reduced chi-squared =         0.7024 for     56 degrees of freedom
# Null hypothesis probability =   9.554803e-01

Photon flux (15-150 keV)    in 1 sec: 7.74953 ( -0.58788  0.59062 ) ph/cm2/s
Energy fluence (15-150 keV)             : 5.78189e-07 ( -4.59705e-08  4.63219e-08 ) ergs/cm2
Band function
Time interval is from    3.052 sec. to    4.052 sec.

Spectral model in the Band function:
------------------------------------------------------------
Parameters  : value       lower 90%   higher 90%
alpha       : 0.813579   ( -0.481438   0.520019 )
beta        : -9.99997    ( 9.99997   0.000167242 )
Epeak [keV] : 62.4915      ( -4.20542 5.94497 )
Norm@50keV   : 0.898610    ( -0.369943   1.0369 )
------------------------------------------------------------
#Fit statistic : Chi-Squared =          39.34 using 59 PHA bins.
# Reduced chi-squared =         0.7152 for     55 degrees of freedom
# Null hypothesis probability =   9.451599e-01

Photon flux (15-150 keV)    in 1 sec: 7.74657 ( -0.58692  0.58908 ) ph/cm2/s
Energy fluence (15-150 keV)             : 4.38925e-09 ( 0  0 ) ergs/cm2
Single BB
Spectral model blackbody:
------------------------------------------------------------
Parameters  : value    Lower 90%  Upper 90%
kT [keV]    : 15.4891  (-0.942492  1.00149)
R^2/D10^2   : 0.946010  (-0.194235   0.239727)
(R is the radius in km and D10 is the distance to the source in units of 10 kpc)
------------------------------------------------------------
#Fit statistic : Chi-Squared =          41.98 using 59 PHA bins.
# Reduced chi-squared =         0.7365 for     57 degrees of freedom
# Null hypothesis probability =   9.318072e-01

Energy  Fluence     90% Error
[keV]   [erg/cm2]   [erg/cm2]
15- 25  4.725e-08   5.270e-09
25- 50  1.933e-07   1.550e-08
50-150  3.199e-07   3.725e-08
15-150  5.604e-07   4.190e-08
Thermal bremsstrahlung (OTTB)
Spectral model: thermal bremsstrahlung
------------------------------------------------------------
Parameters  : value         Lower 90%    Upper 90%
kT [keV]    : 187.161       (-46.9038      -187.161)
Norm        : 33.4637       (-2.48758     2.62449)
------------------------------------------------------------
#Fit statistic : Chi-Squared =          79.49 using 59 PHA bins.
# Reduced chi-squared =          1.395 for     57 degrees of freedom
# Null hypothesis probability =   2.617768e-02

Energy  Fluence     90% Error
[keV]   [erg/cm2]   [erg/cm2]
15- 25  8.400e-08   8.800e-09
25- 50  1.604e-07   3.260e-08
50-150  3.443e-07   1.464e-07
15-150  5.886e-07   1.601e-07
Double BB
Spectral model: bbodyrad<1> + bbodyrad<2>
------------------------------------------------------------
Parameters  : value         Lower 90%    Upper 90%
kT1 [keV]   : 9.50937        (-9.58931      -9.58931)
R1^2/D10^2  : 1.40556        (-1.38722      -1.38722)
kT2 [keV]   : 17.8172        (-17.9424      65.5407)
R2^2/D10^2  : 0.453316    (-0.429832   0.741661)
------------------------------------------------------------
#Fit statistic : Chi-Squared =          39.46 using 59 PHA bins.
# Reduced chi-squared =         0.7174 for     55 degrees of freedom
# Null hypothesis probability =   9.435463e-01

Energy  Fluence     90% Error
[keV]   [erg/cm2]   [erg/cm2]
15- 25  5.430e-08   3.043e-08
25- 50  1.914e-07   1.214e-07
50-150  3.313e-07   1.880e-07
15-150  5.770e-07   3.243e-07
Pre-slew spectrum (Pre-slew PHA with pre-slew DRM)
Power-law model

Spectral model in power-law:
------------------------------------------------------------
Parameters  : value       lower 90%   higher 90%
Photon index: 1.50593     ( -0.0522795   0.0522607 )
Norm@50keV  : 1.15160E-02    ( -0.000346946   0.000346945 )
------------------------------------------------------------
#Fit statistic : Chi-Squared =          83.70 using 59 PHA bins.
# Reduced chi-squared =          1.469 for     57 degrees of freedom
# Null hypothesis probability =   1.216502e-02

Photon flux (15-150 keV)    in 99.9 sec: 1.43996 ( -0.0475792  0.0476971 ) ph/cm2/s
Energy fluence (15-150 keV)             : 1.09033e-05 ( -3.4231e-07  3.42652e-07 ) ergs/cm2
Cutoff power-law model

Spectral model in the cutoff power-law:
------------------------------------------------------------
Parameters  : value       lower 90%   higher 90%
Photon index: 0.785239     ( -0.24242   0.230389 )
Epeak [keV] : 92.2267      ( -10.7015 18.4222 )
Norm@50keV  : 2.48070E-02    ( -0.00526801   0.00709141 )
------------------------------------------------------------
#Fit statistic : Chi-Squared =          52.19 using 59 PHA bins.
# Reduced chi-squared =         0.9320 for     56 degrees of freedom
# Null hypothesis probability =   6.197162e-01

Photon flux (15-150 keV)    in 99.9 sec: 1.37983 ( -0.05041  0.0506 ) ph/cm2/s
Energy fluence (15-150 keV)             : 1.05107e-05 ( -3.68531e-07  3.67832e-07 ) ergs/cm2
Band function

Spectral model in the Band function:
------------------------------------------------------------
Parameters  : value       lower 90%   higher 90%
alpha       : -0.785187   ( -0.167217   0.324134 )
beta        : -10.0000    ( 10   3.55271e-15 )
Epeak [keV] : 92.2094      ( -8.42183 18.466 )
Norm@50keV   : 2.48074E-02    ( -0.00527401   0.00708171 )
------------------------------------------------------------
#Fit statistic : Chi-Squared =          52.19 using 59 PHA bins.
# Reduced chi-squared =         0.9490 for     55 degrees of freedom
# Null hypothesis probability =   5.825314e-01

Photon flux (15-150 keV)    in 99.9 sec: 1.39070 ( -0.06857  0.04525 ) ph/cm2/s
Energy fluence (15-150 keV)             : 1.06944e-05 ( -5.70783e-07  1.87274e-07 ) ergs/cm2
S(25-50 keV) vs. S(50-100 keV) plot

S(25-50 keV)  = 2.74e-06
S(50-100 keV) = 3.84e-06
T90 vs. Hardness ratio plot

T90                                   = 50.4640001058578 sec.
Hardness ratio (energy fluence ratio) = 1.40146
Color vs. Color plot

Count Ratio  (25-50 keV) / (15-25 keV) = 1.67241
Count Ratio (50-100 keV) / (15-25 keV) = 1.38102
Mask shadow pattern
IMX = 7.384328718997748E-01, IMY = -5.309956329835059E-01
TIME vs. PHA plot around the trigger time

TIME vs. DetID plot around the trigger time
100 us light curve (15-350 keV)

Spacecraft aspect plot
Bright source in the pre-burst/pre-slew/post-slew images
Pre-burst image of 15-350 keV band
Time interval of the image:
-12.099400 -11.800000

# RAcent  DECcent POSerr Theta    Phi  PeakCts   SNR AngSep     Name
#  [deg]    [deg]    ['] [deg]  [deg]                   [']
170.5756 -60.7101    5.6  41.8  131.5   0.0429   2.1    9.3	Cen X-3
186.5926 -62.7290    4.2  45.0  141.9  -0.0599  -2.7    3.0	GX 301-2
 78.5746  -6.2919    2.2  57.0    5.6   0.1914   5.2 ------	UNKNOWN
 68.6706  -4.9387    2.6  58.2   -6.1   0.1605   4.5 ------	UNKNOWN
 55.9765 -42.3872    2.0  22.8  -34.3   0.0396   5.9 ------	UNKNOWN
 57.0782 -18.4825    1.8  45.8  -22.2   0.0730   6.3 ------	UNKNOWN
298.5713 -56.9241    2.8  54.8 -153.0   0.1080   4.1 ------	UNKNOWN
Pre-slew background subtracted image of 15-350 keV band
Time interval of the image:
-11.800000 88.100610

# RAcent  DECcent POSerr Theta    Phi  PeakCts   SNR AngSep     Name
#  [deg]    [deg]    ['] [deg]  [deg]                   [']
170.1997 -60.5559    5.8  41.8  131.5 -13.5682  -2.0    5.3	Cen X-3
186.2248 -62.6667    0.0  45.0  142.0  19.9768   2.8   13.4	GX 301-2
130.6763 -62.0995    2.5  25.9  113.1  13.5505   4.7 ------	UNKNOWN
218.2034 -63.2708    2.5  51.2  159.5  44.0158   4.7 ------	UNKNOWN
 64.0500 -22.4571    2.0  40.9  -13.6  17.6751   5.8 ------	UNKNOWN
Post-slew image of 15-350 keV band
Time interval of the image:
148.300590 963.175900

# RAcent  DECcent POSerr Theta    Phi  PeakCts   SNR AngSep     Name
#  [deg]    [deg]    ['] [deg]  [deg]                   [']
 83.6187  22.0244    0.4  48.9  -10.2  30.2758  26.6    1.0	Crab
135.5016 -40.5340   80.6  34.2  136.0  -0.1439  -0.1    1.7	Vela X-1
137.9006 -23.2342    4.5  35.2  105.2   3.7413   2.6 ------	UNKNOWN
 87.6550 -74.7010    2.8  50.6 -167.0   6.8499   4.1 ------	UNKNOWN
 86.0645 -81.8923    3.1  57.6 -168.7  14.7145   3.7 ------	UNKNOWN
 79.7470  -7.7627    2.5  25.1  -42.3   3.2353   4.6 ------	UNKNOWN
 67.4447  -0.7009    2.8  38.9  -48.0   4.5014   4.2 ------	UNKNOWN
 64.5806  10.0280    3.4  48.3  -39.5   6.4086   3.4 ------	UNKNOWN
 62.5381   7.0060    3.7  47.7  -44.3   6.7014   3.1 ------	UNKNOWN
 61.3456  13.0631    2.4  52.7  -39.7  13.5007   4.7 ------	UNKNOWN
 46.2448 -52.4532    2.8  48.5 -130.4  13.1996   4.2 ------	UNKNOWN
 48.8511 -45.1888    2.8  45.3 -121.1  10.7865   4.1 ------	UNKNOWN
Plot creation:
Sat Apr  7 22:27:32 EDT 2018