Estimated redshift from machine learning (Ukwatta et al. 2016) - may take a few minute to calcaulte
Image
Pre-slew 15.0-350.0 keV image (Event data)
#   RAcent    DECcent   POSerr    Theta     Phi              Peak Cts       SNR   Name
  157.4161    24.4610   0.0076    15.5980   138.0259         1.1542966     25.346 TRIG_00817564

Foreground time interval of the image:
 -0.008  10.981 (delta_t =  10.989 [sec])
Background time interval of the image:
-239.520  -0.008 (delta_t = 239.512 [sec])
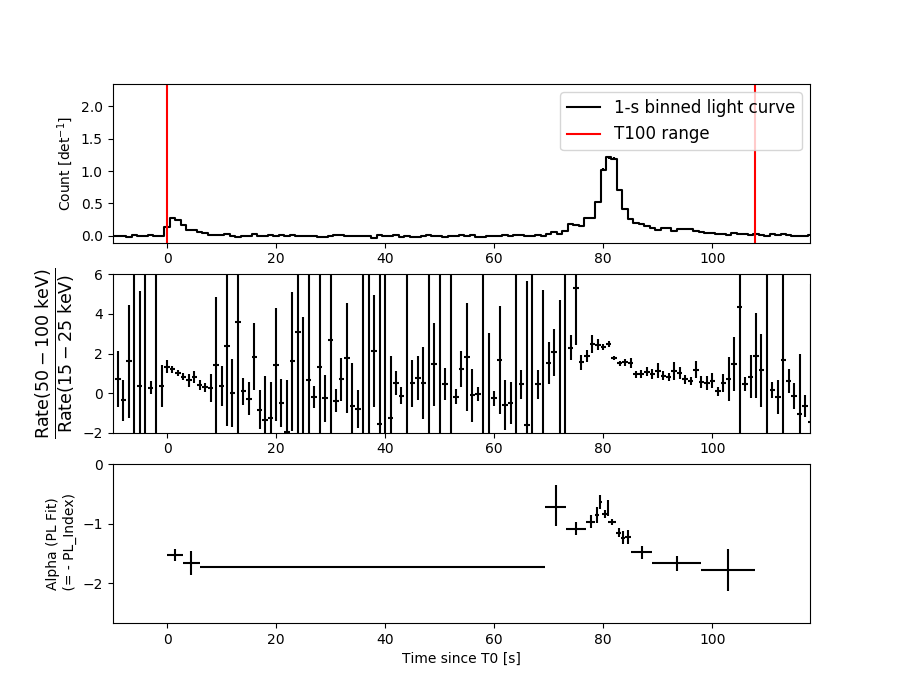
Lightcurves
Notes:
- 1) The mask-weighted light curves are using the flight position.
- 2) Multiple plots of different time binning/intervals are shown to cover all scenarios of short/long GRBs, rate/image triggers, and real/false positives.
- 3) For all the mask-weighted lightcurves, the y-axis units are counts/sec/det where a det is 0.4 x 0.4 = 0.16 sq cm.
- 4) The verticle lines correspond to following: green dotted lines are T50 interval, black dotted lines are T90 interval, blue solid line(s) is a spacecraft slew start time, and orange solid line(s) is a spacecraft slew end time.
- 5) Time of each bin is in the middle of the bin.
1 s binning
From T0-310 s to T0+310 s

From T100_start - 20 s to T100_end + 30 s
Full time interval

64 ms binning
Full time interval
From T100_start to T100_end

From T0-5 sec to T0+5 sec
16 ms binning
From T100_start-5 s to T100_start+5 s
Blue+Cyan dotted lines: Time interval of the scaled map
From 0.000000 to 0.512000
8 ms binning
From T100_start-3 s to T100_start+3 s
Blue+Cyan dotted lines: Time interval of the scaled map
From 0.000000 to 0.512000
2 ms binning
From T100_start-1 s to T100_start+1 s
Blue+Cyan dotted lines: Time interval of the scaled map
From 0.000000 to 0.512000
SN=5 or 10 sec. binning (whichever binning is satisfied first)
SN=5 or 10 sec. binning (T < 200 sec)

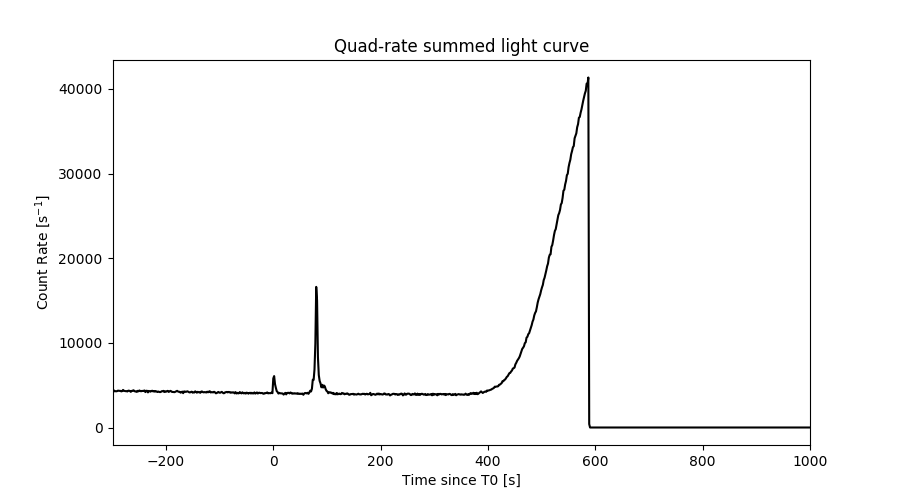
Quad-rate summed light curves (from T0-300s to T0+1000s)
Spectral Evolution
Spectra
Notes:
- 1) The fitting includes the systematic errors.
- 2) When the burst includes telescope slew time periods, the fitting uses an average response file made from multiple 5-s response files through out the slew time plus single time preiod for the non-slew times, and weighted by the total counts in the corresponding time period using addrmf. An average response file is needed becuase a spectral fit using the pre-slew DRM will introduce some errors in both a spectral shape and a normalization if the PHA file contains a lot of the slew/post-slew time interval.
- 3) For fits to more complicated models (e.g. a power-law over a cutoff power-law), the BAT team has decided to require a chi-square improvement of more than 6 for each extra dof.
Time averaged spectrum fit using the average DRM
Power-law model

Time interval is from   -0.008 sec. to  107.888 sec.

Spectral model in power-law:
------------------------------------------------------------
Parameters  : value       lower 90%   higher 90%
Photon index: 1.20313     ( -0.0465214   0.0463018 )
Norm@50keV  : 5.84403E-03    ( -0.000146609   0.000146519 )
------------------------------------------------------------
#Fit statistic : Chi-Squared =          68.73 using 59 PHA bins.
# Reduced chi-squared =          1.206 for     57 degrees of freedom
# Null hypothesis probability =   1.373264e-01

Photon flux (15-150 keV)    in 107.9 sec: 0.686277 ( -0.018442  0.018479 ) ph/cm2/s
Energy fluence (15-150 keV)             : 6.39251e-06 ( -1.68774e-07  1.68961e-07 ) ergs/cm2
Cutoff power-law model

Time interval is from   -0.008 sec. to  107.888 sec.
Spectral model in the cutoff power-law:
------------------------------------------------------------
Parameters  : value       lower 90%   higher 90%
Photon index: 0.974174     ( -0.189091   0.181311 )
Epeak [keV] : 257.581      ( -89.9997 653.615 )
Norm@50keV  : 7.36735E-03    ( -0.00120593   0.00150441 )
------------------------------------------------------------
#Fit statistic : Chi-Squared =          64.04 using 59 PHA bins.
# Reduced chi-squared =          1.144 for     56 degrees of freedom
# Null hypothesis probability =   2.152852e-01

Photon flux (15-150 keV)    in 107.9 sec: 0.676321 ( -0.019905  0.019952 ) ph/cm2/s
Energy fluence (15-150 keV)             : 6.30786e-06 ( -1.82498e-07  1.81946e-07 ) ergs/cm2
Band function

Time interval is from   -0.008 sec. to  107.888 sec.


Spectral model in the Band function:
------------------------------------------------------------
Parameters  : value       lower 90%   higher 90%
alpha       :    (     )
beta        :     (     )
Epeak [keV] :       (   )
Norm@50keV   :     (     )
------------------------------------------------------------

Photon flux (15-150 keV)    in  sec:  (    ) ph/cm2/s
Energy fluence (15-150 keV)             : 0 ( 0  0 ) ergs/cm2
Single BB
Spectral model blackbody:
------------------------------------------------------------
Parameters  : value    Lower 90%  Upper 90%
kT [keV]    : 20.2080  (  )
R^2/D10^2   : 2.98353E-02  (   )
(R is the radius in km and D10 is the distance to the source in units of 10 kpc)
------------------------------------------------------------
#Fit statistic : Chi-Squared =         332.21 using 59 PHA bins.
# Reduced chi-squared =         5.8282 for     57 degrees of freedom
# Null hypothesis probability =   1.744526e-40

Energy  Fluence     90% Error
[keV]   [erg/cm2]   [erg/cm2]
15- 25  2.524e-07   1.349e-08
25- 50  1.266e-06   4.802e-08
50-150  3.837e-06   1.619e-07
15-150  5.355e-06   1.586e-07
Thermal bremsstrahlung (OTTB)

Spectral model: thermal bremsstrahlung
------------------------------------------------------------
Parameters  : value         Lower 90%    Upper 90%
kT [keV]    : 199.363       (      )
Norm        : 2.92088       (     )
------------------------------------------------------------
#Fit statistic : Chi-Squared =         238.79 using 59 PHA bins.
# Reduced chi-squared =         4.1892 for     57 degrees of freedom
# Null hypothesis probability =   4.159276e-24

Energy  Fluence     90% Error
[keV]   [erg/cm2]   [erg/cm2]
15- 25  7.848e-07   2.050e-08
25- 50  1.510e-06   4.100e-08
50-150  3.311e-06   9.064e-08
15-150  5.605e-06   1.484e-07
Double BB

Spectral model: bbodyrad<1> + bbodyrad<2>
------------------------------------------------------------
Parameters  : value         Lower 90%    Upper 90%
kT1 [keV]   : 8.45190        (-0.855773      0.934702)
R1^2/D10^2  : 0.302039        (-0.0824087      0.122493)
kT2 [keV]   : 32.9746        (-3.09093      4.20862)
R2^2/D10^2  : 5.08052E-03    (-0.00164493   0.00200344)
------------------------------------------------------------
#Fit statistic : Chi-Squared =          61.91 using 59 PHA bins.
# Reduced chi-squared =          1.126 for     55 degrees of freedom
# Null hypothesis probability =   2.431123e-01

Energy  Fluence     90% Error
[keV]   [erg/cm2]   [erg/cm2]
15- 25  5.250e-07   4.677e-08
25- 50  1.402e-06   8.200e-08
50-150  4.399e-06   3.021e-07
15-150  6.326e-06   4.203e-07
Peak spectrum fit
Power-law model
Time interval is from   80.752 sec. to   81.752 sec.

Spectral model in power-law:
------------------------------------------------------------
Parameters  : value       lower 90%   higher 90%
Photon index: 0.894609     ( -0.0614754   0.0610197 )
Norm@50keV  : 8.13693E-02    ( -0.00278375   0.002778 )
------------------------------------------------------------
#Fit statistic : Chi-Squared =          42.45 using 59 PHA bins.
# Reduced chi-squared =         0.7448 for     57 degrees of freedom
# Null hypothesis probability =   9.244453e-01

Photon flux (15-150 keV)    in 1 sec: 0.532126 (    ) ph/cm2/s
Energy fluence (15-150 keV)             : 9.15208e-07 ( -3.46256e-08  3.46966e-08 ) ergs/cm2
Cutoff power-law model

Time interval is from   80.752 sec. to   81.752 sec.
Spectral model in the cutoff power-law:
------------------------------------------------------------
Parameters  : value       lower 90%   higher 90%
Photon index: 0.888047     ( -0.242769   0.0755213 )
Epeak [keV] : 9998.05      ( -9997.94 -9997.94 )
Norm@50keV  : 8.19098E-02    ( -0.00275941   0.0257647 )
------------------------------------------------------------
#Fit statistic : Chi-Squared =          42.42 using 59 PHA bins.
# Reduced chi-squared =         0.7575 for     56 degrees of freedom
# Null hypothesis probability =   9.099090e-01

Photon flux (15-150 keV)    in 1 sec: 9.32553 ( -0.35272  0.33363 ) ph/cm2/s
Energy fluence (15-150 keV)             : 9.13755e-07 ( -3.64108e-08  3.42268e-08 ) ergs/cm2
Band function
Time interval is from   80.752 sec. to   81.752 sec.


Spectral model in the Band function:
------------------------------------------------------------
Parameters  : value       lower 90%   higher 90%
alpha       :    (     )
beta        :     (     )
Epeak [keV] :       (   )
Norm@50keV   :     (     )
------------------------------------------------------------

Photon flux (15-150 keV)    in  sec:  (    ) ph/cm2/s
Energy fluence (15-150 keV)             : 0 ( 0  0 ) ergs/cm2
Single BB
Spectral model blackbody:
------------------------------------------------------------
Parameters  : value    Lower 90%  Upper 90%
kT [keV]    : 23.7489  (  )
R^2/D10^2   : 0.268843  (   )
(R is the radius in km and D10 is the distance to the source in units of 10 kpc)
------------------------------------------------------------
#Fit statistic : Chi-Squared =         194.85 using 59 PHA bins.
# Reduced chi-squared =         3.4185 for     57 degrees of freedom
# Null hypothesis probability =   5.751413e-17

Energy  Fluence     90% Error
[keV]   [erg/cm2]   [erg/cm2]
15- 25  2.705e-08   1.865e-09
25- 50  1.494e-07   7.700e-09
50-150  6.282e-07   3.605e-08
15-150  8.046e-07   3.530e-08
Thermal bremsstrahlung (OTTB)
Spectral model: thermal bremsstrahlung
------------------------------------------------------------
Parameters  : value         Lower 90%    Upper 90%
kT [keV]    : 199.363       (      )
Norm        : 36.5259       (     )
------------------------------------------------------------
#Fit statistic : Chi-Squared =         341.82 using 59 PHA bins.
# Reduced chi-squared =         5.9969 for     57 degrees of freedom
# Null hypothesis probability =   3.108818e-42

Energy  Fluence     90% Error
[keV]   [erg/cm2]   [erg/cm2]
15- 25  9.095e-08   3.540e-09
25- 50  1.750e-07   6.650e-09
50-150  3.837e-07   1.515e-08
15-150  6.496e-07   2.505e-08
Double BB
Spectral model: bbodyrad<1> + bbodyrad<2>
------------------------------------------------------------
Parameters  : value         Lower 90%    Upper 90%
kT1 [keV]   : 9.44633        (-1.3305      1.49026)
R1^2/D10^2  : 2.49330        (-0.818741      1.37499)
kT2 [keV]   : 42.8504        (-6.36403      10.7794)
R2^2/D10^2  : 4.06099E-02    (-0.018527   0.0245299)
------------------------------------------------------------
#Fit statistic : Chi-Squared =          41.26 using 59 PHA bins.
# Reduced chi-squared =         0.7501 for     55 degrees of freedom
# Null hypothesis probability =   9.152453e-01

Energy  Fluence     90% Error
[keV]   [erg/cm2]   [erg/cm2]
15- 25  5.348e-08   7.120e-09
25- 50  1.651e-07   1.570e-08
50-150  7.051e-07   1.060e-07
15-150  9.237e-07   1.086e-07
Pre-slew spectrum (Pre-slew PHA with pre-slew DRM)
Power-law model
Spectral model in power-law:
------------------------------------------------------------
Parameters  : value       lower 90%   higher 90%
Photon index: 1.62677     ( -0.105863   0.107256 )
Norm@50keV  : 6.54672E-03    ( -0.000435404   0.000432801 )
------------------------------------------------------------
#Fit statistic : Chi-Squared =          83.22 using 59 PHA bins.
# Reduced chi-squared =          1.460 for     57 degrees of freedom
# Null hypothesis probability =   1.332240e-02

Photon flux (15-150 keV)    in 10.99 sec: 0.848409 ( -0.0531404  0.0531727 ) ph/cm2/s
Energy fluence (15-150 keV)             : 6.70789e-07 ( -4.76611e-08  4.80641e-08 ) ergs/cm2
Cutoff power-law model

Spectral model in the cutoff power-law:
------------------------------------------------------------
Parameters  : value       lower 90%   higher 90%
Photon index: 0.691508     ( -0.53028   0.469452 )
Epeak [keV] : 65.0689      ( -9.80326 21.3359 )
Norm@50keV  : 2.06090E-02    ( -0.00887762   0.0185771 )
------------------------------------------------------------
#Fit statistic : Chi-Squared =          70.32 using 59 PHA bins.
# Reduced chi-squared =          1.256 for     56 degrees of freedom
# Null hypothesis probability =   9.437848e-02

Photon flux (15-150 keV)    in 10.99 sec: 0.815433 ( -0.055426  0.055436 ) ph/cm2/s
Energy fluence (15-150 keV)             : 6.18746e-07 ( -5.27278e-08  5.3773e-08 ) ergs/cm2
Band function

Spectral model in the Band function:
------------------------------------------------------------
Parameters  : value       lower 90%   higher 90%
alpha       :    (     )
beta        :     (     )
Epeak [keV] :       (   )
Norm@50keV   :     (     )
------------------------------------------------------------

Photon flux (15-150 keV)    in  sec:  (    ) ph/cm2/s
Energy fluence (15-150 keV)             : 0 ( 0  0 ) ergs/cm2
S(25-50 keV) vs. S(50-100 keV) plot
S(25-50 keV)  = 1.35e-06
S(50-100 keV) = 2.34e-06
T90 vs. Hardness ratio plot

T90                                   = 92.8279999494553 sec.
Hardness ratio (energy fluence ratio) = 1.73333
Color vs. Color plot

Count Ratio  (25-50 keV) / (15-25 keV) = 1.69387
Count Ratio (50-100 keV) / (15-25 keV) = 1.57593
Mask shadow pattern

IMX = -2.075458038916739E-01, IMY = -1.867052018994906E-01
TIME vs. PHA plot around the trigger time
Blue+Cyan dotted lines: Time interval of the scaled map
From 0.000000 to 0.512000
TIME vs. DetID plot around the trigger time
Blue+Cyan dotted lines: Time interval of the scaled map
From 0.000000 to 0.512000
100 us light curve (15-350 keV)

Blue+Cyan dotted lines: Time interval of the scaled map
From 0.000000 to 0.512000
Spacecraft aspect plot
Bright source in the pre-burst/pre-slew/post-slew images
Pre-burst image of 15-350 keV band
Time interval of the image:
-239.520000 -0.008000

# RAcent  DECcent POSerr Theta    Phi  PeakCts   SNR AngSep     Name
#  [deg]    [deg]    ['] [deg]  [deg]                   [']
172.5223  -2.1378    2.5  40.8   97.4   4.8228   4.6 ------	UNKNOWN
167.3886   2.8551    2.9  35.4  105.0   1.8984   3.9 ------	UNKNOWN
164.2872   2.5492    2.9  35.7  110.4   2.1429   4.0 ------	UNKNOWN
230.7105  24.4635    3.7  55.7   11.4   4.1768   3.1 ------	UNKNOWN
203.8386  30.3898    3.2  31.9   19.9   1.1230   3.7 ------	UNKNOWN
213.1964  45.9116    3.3  35.3  -10.8   1.0209   3.6 ------	UNKNOWN
105.6313  15.1720    2.7  57.6 -168.8   6.4512   4.2 ------	UNKNOWN
152.4292  56.1749    2.8  20.2  -95.2   1.1304   4.1 ------	UNKNOWN
113.9956  39.1014    3.2  40.1 -144.6   1.4519   3.5 ------	UNKNOWN
107.4718  61.6884    2.9  42.4 -109.7   4.3102   4.0 ------	UNKNOWN
102.1544  53.7584    2.5  45.4 -121.0   5.2230   4.7 ------	UNKNOWN
Pre-slew background subtracted image of 15-350 keV band
Time interval of the image:
-0.008000 10.980600

# RAcent  DECcent POSerr Theta    Phi  PeakCts   SNR AngSep     Name
#  [deg]    [deg]    ['] [deg]  [deg]                   [']
157.4161  24.4610    0.5  15.6  138.0   1.1543  25.3 ------	UNKNOWN
Post-slew image of 15-350 keV band
Time interval of the image:
61.380600 602.560000

# RAcent  DECcent POSerr Theta    Phi  PeakCts   SNR AngSep     Name
#  [deg]    [deg]    ['] [deg]  [deg]                   [']
217.8901  40.9316    3.1  52.4   14.6   4.1199   3.7 ------	UNKNOWN
157.4512  24.4745    0.4   0.0   18.3   8.5206  28.3 ------	UNKNOWN
128.6968   0.2678    2.2  36.9 -168.2   2.1008   5.3 ------	UNKNOWN
135.0109  47.2885    3.8  29.0  -73.7   1.4824   3.1 ------	UNKNOWN
111.7425  39.6340    5.7  41.1  -98.4   2.8500   2.1 ------	UNKNOWN
Plot creation:
Thu May 31 10:54:27 EDT 2018