Estimated redshift from machine learning (Ukwatta et al. 2016) - may take a few minute to calcaulte
Image
Pre-slew 15.0-350.0 keV image (Event data)

#   RAcent    DECcent   POSerr    Theta     Phi              Peak Cts       SNR   Name
   66.0055    13.3860   0.0163    24.6400  -141.1272         1.0734494     11.843 TRIG_00820347

Foreground time interval of the image:
  0.584  48.584 (delta_t =  48.000 [sec])
Background time interval of the image:
-200.115   0.584 (delta_t = 200.699 [sec])
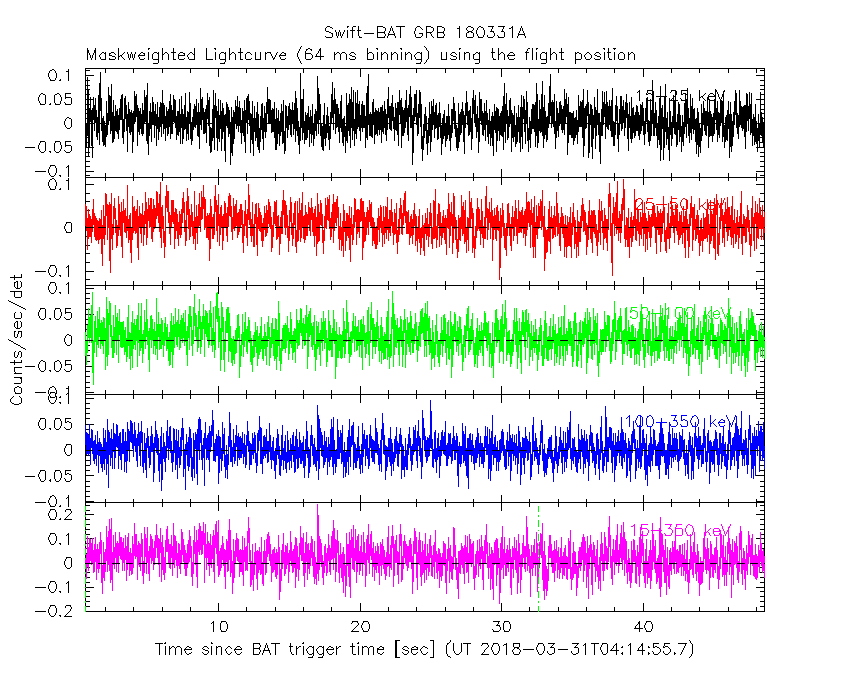
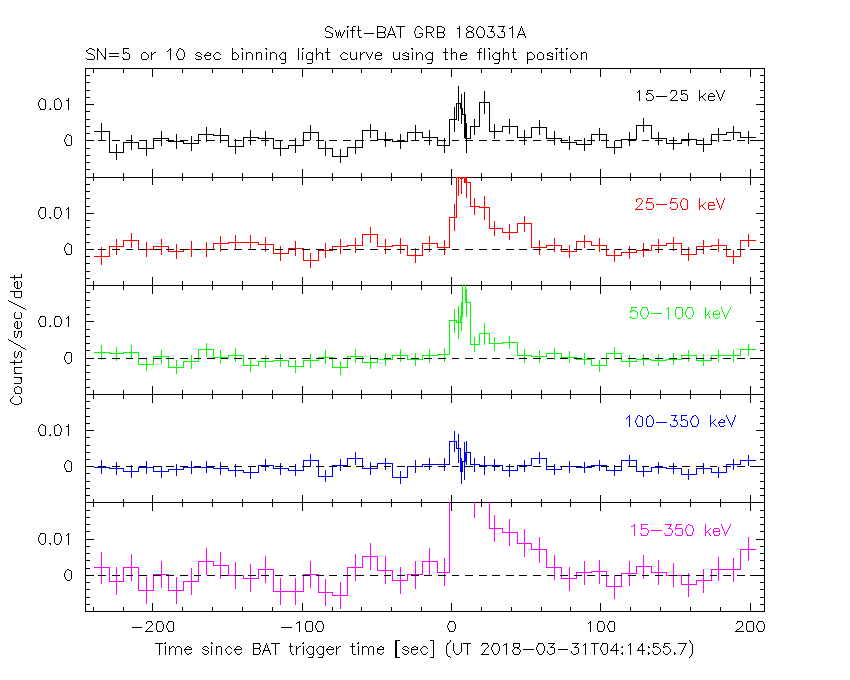
Lightcurves
Notes:
- 1) The mask-weighted light curves are using the flight position.
- 2) Multiple plots of different time binning/intervals are shown to cover all scenarios of short/long GRBs, rate/image triggers, and real/false positives.
- 3) For all the mask-weighted lightcurves, the y-axis units are counts/sec/det where a det is 0.4 x 0.4 = 0.16 sq cm.
- 4) The verticle lines correspond to following: green dotted lines are T50 interval, black dotted lines are T90 interval, blue solid line(s) is a spacecraft slew start time, and orange solid line(s) is a spacecraft slew end time.
- 5) Time of each bin is in the middle of the bin.
1 s binning
From T0-310 s to T0+310 s

From T100_start - 20 s to T100_end + 30 s

Full time interval

64 ms binning
Full time interval

From T100_start to T100_end
From T0-5 sec to T0+5 sec

16 ms binning
From T100_start-5 s to T100_start+5 s

Blue+Cyan dotted lines: Time interval of the scaled map
From 0.000000 to 8.192000
8 ms binning
From T100_start-3 s to T100_start+3 s

Blue+Cyan dotted lines: Time interval of the scaled map
From 0.000000 to 8.192000
2 ms binning
From T100_start-1 s to T100_start+1 s

Blue+Cyan dotted lines: Time interval of the scaled map
From 0.000000 to 8.192000
SN=5 or 10 sec. binning (whichever binning is satisfied first)

SN=5 or 10 sec. binning (T < 200 sec)
Quad-rate summed light curves (from T0-300s to T0+1000s)

Spectral Evolution

Spectra
Notes:
- 1) The fitting includes the systematic errors.
- 2) When the burst includes telescope slew time periods, the fitting uses an average response file made from multiple 5-s response files through out the slew time plus single time preiod for the non-slew times, and weighted by the total counts in the corresponding time period using addrmf. An average response file is needed becuase a spectral fit using the pre-slew DRM will introduce some errors in both a spectral shape and a normalization if the PHA file contains a lot of the slew/post-slew time interval.
- 3) For fits to more complicated models (e.g. a power-law over a cutoff power-law), the BAT team has decided to require a chi-square improvement of more than 6 for each extra dof.
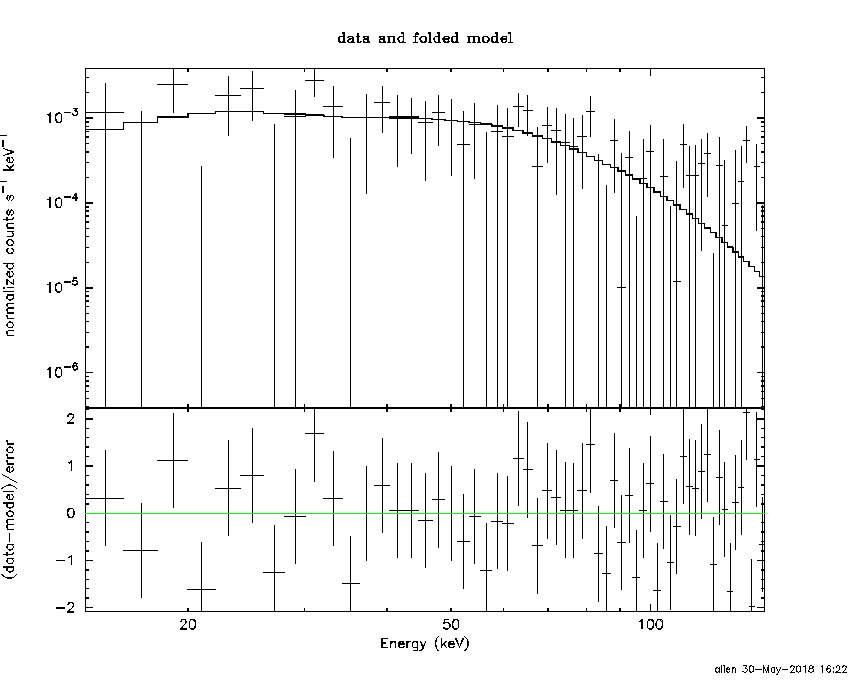
Time averaged spectrum fit using the average DRM
Power-law model

Time interval is from    0.584 sec. to   48.584 sec.

Spectral model in power-law:
------------------------------------------------------------
Parameters  : value       lower 90%   higher 90%
Photon index: 1.47119     ( -0.193431   0.195189 )
Norm@50keV  : 1.49925E-03    ( -0.00018279   0.000181745 )
------------------------------------------------------------
#Fit statistic : Chi-Squared =          64.30 using 59 PHA bins.
# Reduced chi-squared =          1.128 for     57 degrees of freedom
# Null hypothesis probability =   2.362582e-01

Photon flux (15-150 keV)    in 48 sec: 0.185757 ( -0.022057  0.02208 ) ph/cm2/s
Energy fluence (15-150 keV)             : 6.86122e-07 ( -9.1417e-08  9.27058e-08 ) ergs/cm2
Cutoff power-law model

Time interval is from    0.584 sec. to   48.584 sec.
Spectral model in the cutoff power-law:
------------------------------------------------------------
Parameters  : value       lower 90%   higher 90%
Photon index: 0.176427     ( -1.16458   0.90959 )
Epeak [keV] : 66.4153      ( -13.6063 48.0973 )
Norm@50keV  : 7.19515E-03    ( -0.00719516   0.0218728 )
------------------------------------------------------------
#Fit statistic : Chi-Squared =          57.91 using 59 PHA bins.
# Reduced chi-squared =          1.034 for     56 degrees of freedom
# Null hypothesis probability =   4.047856e-01

Photon flux (15-150 keV)    in 48 sec: 0.176622 ( -0.022965  0.022981 ) ph/cm2/s
Energy fluence (15-150 keV)             : 6.1453e-07 ( -9.85632e-08  1.03779e-07 ) ergs/cm2
Band function

Time interval is from    0.584 sec. to   48.584 sec.

Spectral model in the Band function:
------------------------------------------------------------
Parameters  : value       lower 90%   higher 90%
alpha       : -0.176258   ( -0.814105   0.76735 )
beta        : -10.00000    ( 10   2.25143e-07 )
Epeak [keV] : 66.4017      ( -11.8982 48.1286 )
Norm@50keV   : 7.19718E-03    ( -0.00719718   0.0219034 )
------------------------------------------------------------
#Fit statistic : Chi-Squared =          57.91 using 59 PHA bins.
# Reduced chi-squared =          1.053 for     55 degrees of freedom
# Null hypothesis probability =   3.685531e-01

Photon flux (15-150 keV)    in 48 sec: 0.177126 ( -0.022921  0.023301 ) ph/cm2/s
Energy fluence (15-150 keV)             : 6.27437e-07 ( -9.83568e-08  1.07468e-07 ) ergs/cm2
Single BB

Spectral model blackbody:
------------------------------------------------------------
Parameters  : value    Lower 90%  Upper 90%
kT [keV]    : 14.1431  (-1.75585  2.07961)
R^2/D10^2   : 2.69773E-02  (-0.0104313   0.0162599)
(R is the radius in km and D10 is the distance to the source in units of 10 kpc)
------------------------------------------------------------
#Fit statistic : Chi-Squared =          63.07 using 59 PHA bins.
# Reduced chi-squared =          1.106 for     57 degrees of freedom
# Null hypothesis probability =   2.705527e-01

Energy  Fluence     90% Error
[keV]   [erg/cm2]   [erg/cm2]
15- 25  5.466e-08   1.168e-08
25- 50  2.053e-07   3.473e-08
50-150  2.719e-07   6.701e-08
15-150  5.319e-07   8.638e-08
Thermal bremsstrahlung (OTTB)

Spectral model: thermal bremsstrahlung
------------------------------------------------------------
Parameters  : value         Lower 90%    Upper 90%
kT [keV]    : 199.362       (-78.8291      -199.363)
Norm        : 0.766104       (-0.0893653     0.0894473)
------------------------------------------------------------
#Fit statistic : Chi-Squared =          61.88 using 59 PHA bins.
# Reduced chi-squared =          1.086 for     57 degrees of freedom
# Null hypothesis probability =   3.061603e-01

Energy  Fluence     90% Error
[keV]   [erg/cm2]   [erg/cm2]
15- 25  9.157e-08   5.110e-08
25- 50  1.761e-07   9.703e-08
50-150  3.863e-07   2.139e-07
15-150  6.540e-07   3.566e-07
Double BB

Spectral model: bbodyrad<1> + bbodyrad<2>
------------------------------------------------------------
Parameters  : value         Lower 90%    Upper 90%
kT1 [keV]   : 8.83110        (-5.01754      4.54195)
R1^2/D10^2  : 7.98275E-02        (-0.0494438      0.834591)
kT2 [keV]   : 23.0840        (-11.2514      -23.0844)
R2^2/D10^2  : 3.12342E-03    (-0.00306843   0.0100269)
------------------------------------------------------------
#Fit statistic : Chi-Squared =          57.55 using 59 PHA bins.
# Reduced chi-squared =          1.046 for     55 degrees of freedom
# Null hypothesis probability =   3.808705e-01

Energy  Fluence     90% Error
[keV]   [erg/cm2]   [erg/cm2]
15- 25  7.205e-08   4.051e-08
25- 50  1.974e-07   1.047e-07
50-150  3.555e-07   1.889e-07
15-150  6.249e-07   3.158e-07
Peak spectrum fit
Power-law model

Time interval is from    8.084 sec. to    9.084 sec.

Spectral model in power-law:
------------------------------------------------------------
Parameters  : value       lower 90%   higher 90%
Photon index: 1.13157     ( -0.441217   0.416511 )
Norm@50keV  : 4.68292E-03    ( -0.00124039   0.00123826 )
------------------------------------------------------------
#Fit statistic : Chi-Squared =          51.31 using 59 PHA bins.
# Reduced chi-squared =         0.9002 for     57 degrees of freedom
# Null hypothesis probability =   6.874071e-01

Photon flux (15-150 keV)    in 1 sec: 0.544997 ( -0.147859  0.148862 ) ph/cm2/s
Energy fluence (15-150 keV)             : 4.84808e-08 ( -1.36326e-08  1.3841e-08 ) ergs/cm2
Cutoff power-law model
Time interval is from    8.084 sec. to    9.084 sec.
Spectral model in the cutoff power-law:
------------------------------------------------------------
Parameters  : value       lower 90%   higher 90%
Photon index: -0.813540     ( -3.93784   2.06794 )
Epeak [keV] : 77.1786      ( -22.8128 -77.1569 )
Norm@50keV  : 3.84366E-02    ( -0.0385034   1.81629 )
------------------------------------------------------------
#Fit statistic : Chi-Squared =          48.91 using 59 PHA bins.
# Reduced chi-squared =         0.8733 for     56 degrees of freedom
# Null hypothesis probability =   7.380184e-01

Photon flux (15-150 keV)    in 1 sec: 0.507751 ( -0.154901  0.155902 ) ph/cm2/s
Energy fluence (15-150 keV)             : 4.33611e-08 ( -1.41277e-08  1.52041e-08 ) ergs/cm2
Band function

Time interval is from    8.084 sec. to    9.084 sec.

Spectral model in the Band function:
------------------------------------------------------------
Parameters  : value       lower 90%   higher 90%
alpha       : 0.767100   ( -0.976478   2.42028 )
beta        : -10.00000    ( 10   20 )
Epeak [keV] : 77.5693      ( -21.0572 647.082 )
Norm@50keV   : 3.68241E-02    ( -0.00942007   1.60619 )
------------------------------------------------------------
#Fit statistic : Chi-Squared =          48.91 using 59 PHA bins.
# Reduced chi-squared =         0.8892 for     55 degrees of freedom
# Null hypothesis probability =   7.053145e-01

Photon flux (15-150 keV)    in 1 sec: 0.544994 ( -0.14787  0.148867 ) ph/cm2/s
Energy fluence (15-150 keV)             : 4.4153e-08 ( -1.12852e-08  1.46352e-08 ) ergs/cm2
Single BB

Spectral model blackbody:
------------------------------------------------------------
Parameters  : value    Lower 90%  Upper 90%
kT [keV]    : 18.4130  (-4.43994  6.72132)
R^2/D10^2   : 3.54992E-02  (-0.0230537   0.0544134)
(R is the radius in km and D10 is the distance to the source in units of 10 kpc)
------------------------------------------------------------
#Fit statistic : Chi-Squared =          49.04 using 59 PHA bins.
# Reduced chi-squared =         0.8604 for     57 degrees of freedom
# Null hypothesis probability =   7.641136e-01

Energy  Fluence     90% Error
[keV]   [erg/cm2]   [erg/cm2]
15- 25  2.392e-09   1.221e-09
25- 50  1.125e-08   5.425e-09
50-150  2.784e-08   1.609e-08
15-150  4.148e-08   2.268e-08
Thermal bremsstrahlung (OTTB)

Spectral model: thermal bremsstrahlung
------------------------------------------------------------
Parameters  : value         Lower 90%    Upper 90%
kT [keV]    : 199.363       (-88.2311      -199.363)
Norm        : 2.26824       (-0.61417     0.614196)
------------------------------------------------------------
#Fit statistic : Chi-Squared =          53.35 using 59 PHA bins.
# Reduced chi-squared =         0.9360 for     57 degrees of freedom
# Null hypothesis probability =   6.128177e-01

Energy  Fluence     90% Error
[keV]   [erg/cm2]   [erg/cm2]
15- 25  5.648e-09   3.303e-09
25- 50  1.087e-08   6.390e-09
50-150  2.383e-08   1.433e-08
15-150  4.034e-08   2.381e-08
Double BB

Spectral model: bbodyrad<1> + bbodyrad<2>
------------------------------------------------------------
Parameters  : value         Lower 90%    Upper 90%
kT1 [keV]   : 3.06038E-02        (0.822496      -0.0306038)
R1^2/D10^2  : 4.32775E+22        (-4.32775e+22      -4.32775e+22)
kT2 [keV]   : 18.4130        (-4.4399      6.72136)
R2^2/D10^2  : 3.54994E-02    (-0.0230536   0.0544134)
------------------------------------------------------------
#Fit statistic : Chi-Squared =          49.04 using 59 PHA bins.
# Reduced chi-squared =         0.8917 for     55 degrees of freedom
# Null hypothesis probability =   7.003723e-01

Energy  Fluence     90% Error
[keV]   [erg/cm2]   [erg/cm2]
15- 25  0.000e+00   0.000e+00
25- 50  0.000e+00   0.000e+00
50-150  0.000e+00   0.000e+00
15-150  0.000e+00   0.000e+00
Pre-slew spectrum (Pre-slew PHA with pre-slew DRM)
Power-law model

Spectral model in power-law:
------------------------------------------------------------
Parameters  : value       lower 90%   higher 90%
Photon index: 1.47119     ( -0.193431   0.195189 )
Norm@50keV  : 1.49925E-03    ( -0.00018279   0.000181745 )
------------------------------------------------------------
#Fit statistic : Chi-Squared =          64.30 using 59 PHA bins.
# Reduced chi-squared =          1.128 for     57 degrees of freedom
# Null hypothesis probability =   2.362582e-01

Photon flux (15-150 keV)    in 48 sec: 0.185752 ( -0.0220559  0.0220795 ) ph/cm2/s
Energy fluence (15-150 keV)             : 6.8603e-07 ( -9.13834e-08  9.27432e-08 ) ergs/cm2
Cutoff power-law model

Spectral model in the cutoff power-law:
------------------------------------------------------------
Parameters  : value       lower 90%   higher 90%
Photon index: 0.176432     ( -1.16458   0.90959 )
Epeak [keV] : 66.4154      ( -13.6063 48.0973 )
Norm@50keV  : 7.19511E-03    ( -0.00719516   0.0218728 )
------------------------------------------------------------
#Fit statistic : Chi-Squared =          57.91 using 59 PHA bins.
# Reduced chi-squared =          1.034 for     56 degrees of freedom
# Null hypothesis probability =   4.047856e-01

Photon flux (15-150 keV)    in 48 sec: 0.176606 ( -0.022959  0.022978 ) ph/cm2/s
Energy fluence (15-150 keV)             : 6.14736e-07 ( -9.86688e-08  1.03872e-07 ) ergs/cm2
Band function

Spectral model in the Band function:
------------------------------------------------------------
Parameters  : value       lower 90%   higher 90%
alpha       : -0.176258   ( -0.814105   0.76735 )
beta        : -10.00000    ( 10   2.25143e-07 )
Epeak [keV] : 66.4017      ( -11.8982 48.1286 )
Norm@50keV   : 7.19718E-03    ( -0.00719718   0.0219034 )
------------------------------------------------------------
#Fit statistic : Chi-Squared =          57.91 using 59 PHA bins.
# Reduced chi-squared =          1.053 for     55 degrees of freedom
# Null hypothesis probability =   3.685531e-01

Photon flux (15-150 keV)    in 48 sec: 0.177126 ( -0.022921  0.023301 ) ph/cm2/s
Energy fluence (15-150 keV)             : 6.27437e-07 ( -9.83568e-08  1.07468e-07 ) ergs/cm2
S(25-50 keV) vs. S(50-100 keV) plot
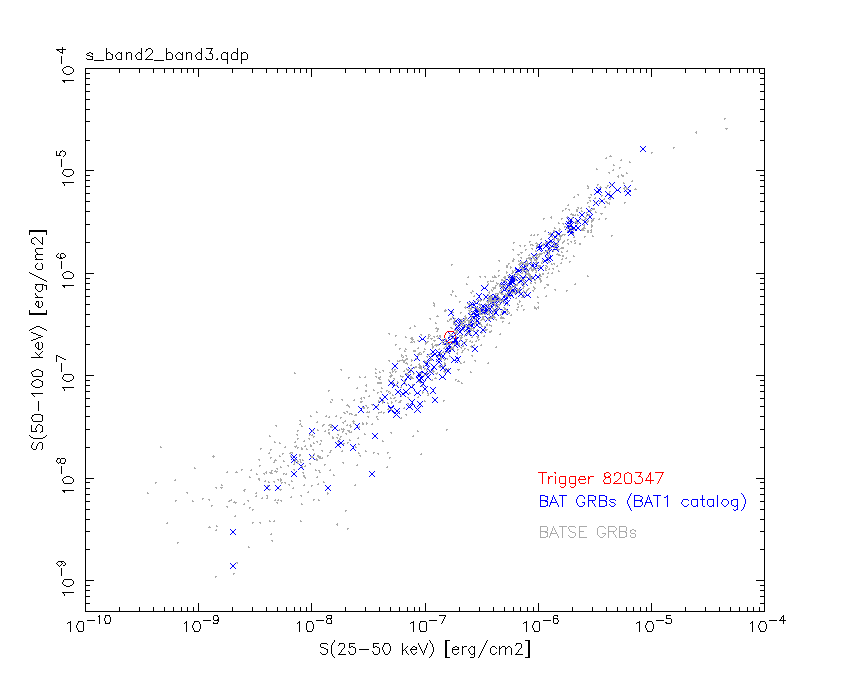
S(25-50 keV)  = 1.67e-07
S(50-100 keV) = 2.41e-07
T90 vs. Hardness ratio plot
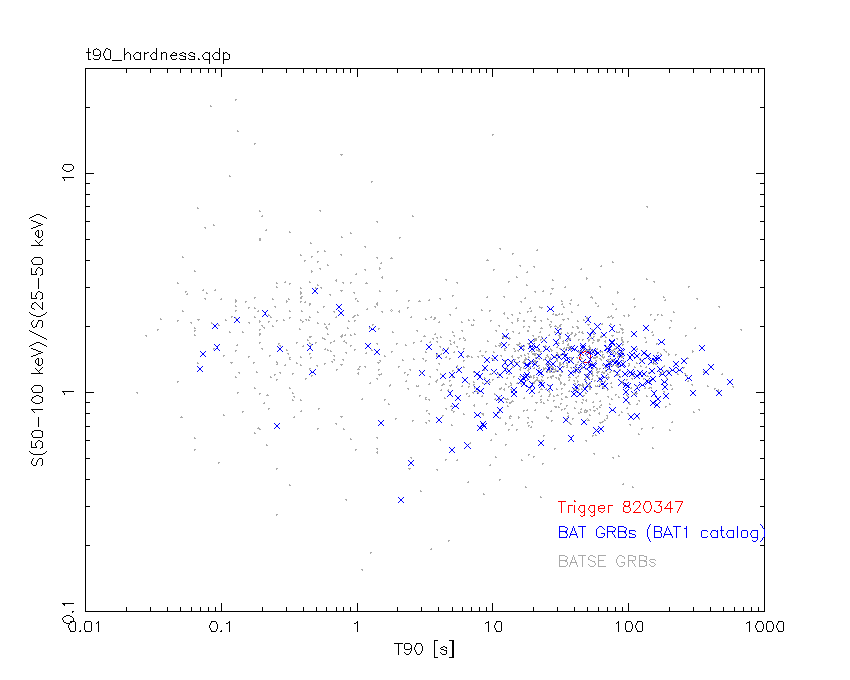
T90                                   = 48 sec.
Hardness ratio (energy fluence ratio) = 1.44311
Color vs. Color plot

Count Ratio  (25-50 keV) / (15-25 keV) = 2.03411
Count Ratio (50-100 keV) / (15-25 keV) = 1.29583
Mask shadow pattern

IMX = -3.571011420068040E-01, IMY = 2.878646867855455E-01
TIME vs. PHA plot around the trigger time
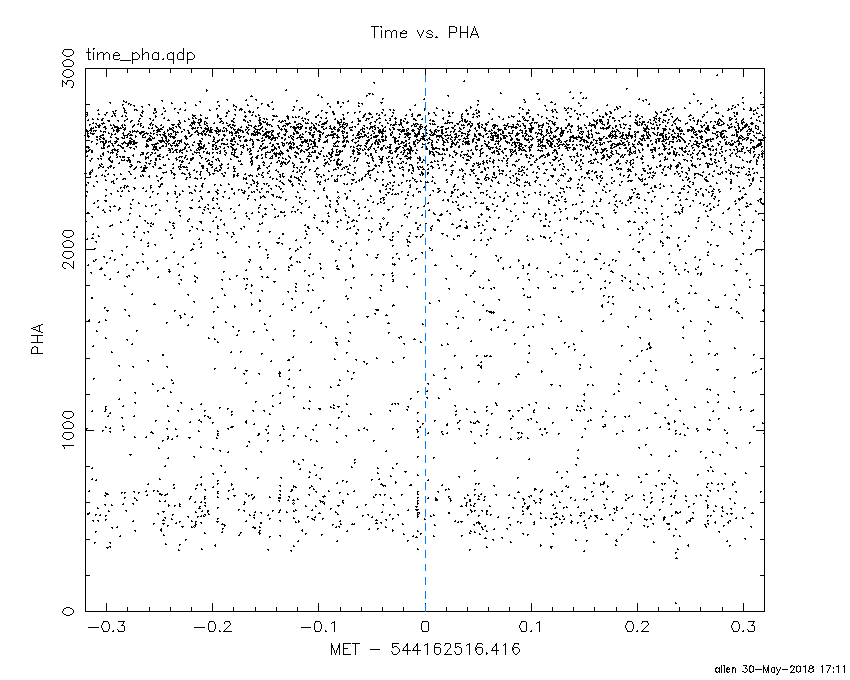
Blue+Cyan dotted lines: Time interval of the scaled map
From 0.000000 to 8.192000
TIME vs. DetID plot around the trigger time
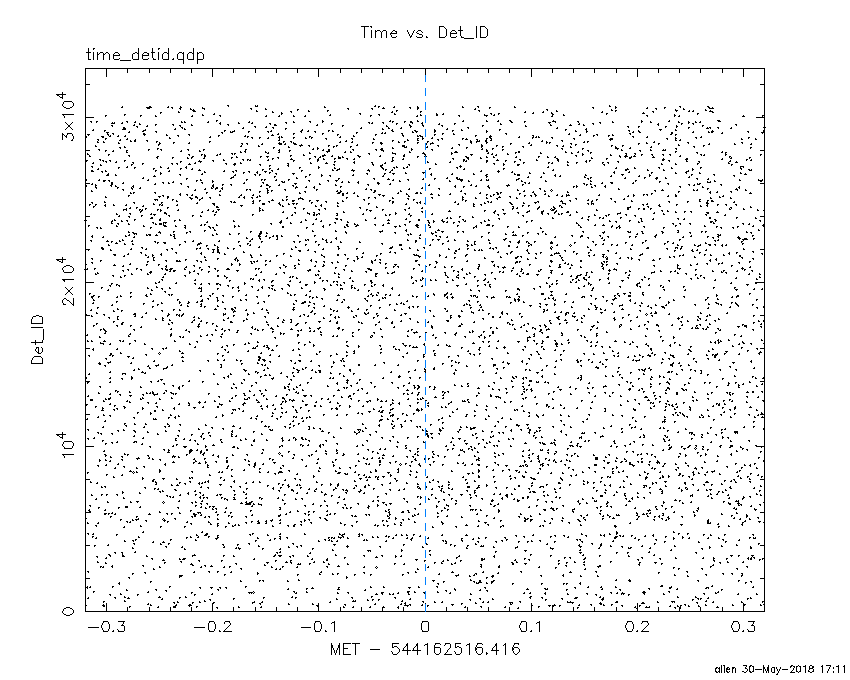
Blue+Cyan dotted lines: Time interval of the scaled map
From 0.000000 to 8.192000
100 us light curve (15-350 keV)

Blue+Cyan dotted lines: Time interval of the scaled map
From 0.000000 to 8.192000
Spacecraft aspect plot

Bright source in the pre-burst/pre-slew/post-slew images
Pre-burst image of 15-350 keV band
Time interval of the image:
-200.115380 0.584000

# RAcent  DECcent POSerr Theta    Phi  PeakCts   SNR AngSep     Name
#  [deg]    [deg]    ['] [deg]  [deg]                   [']
 83.6408  22.0107    0.3  10.5  172.6   8.3606  45.1    0.5	Crab
 95.2752  42.1239    3.4  13.7   37.8   0.6630   3.4 ------	UNKNOWN
164.6997  83.9114    2.8  56.8    3.1   4.1710   4.1 ------	UNKNOWN
 76.3691 -25.4649    3.1  58.3 -177.1   5.2201   3.7 ------	UNKNOWN
Pre-slew background subtracted image of 15-350 keV band
Time interval of the image:
0.584000 48.584000

# RAcent  DECcent POSerr Theta    Phi  PeakCts   SNR AngSep     Name
#  [deg]    [deg]    ['] [deg]  [deg]                   [']
 83.8048  22.1529    0.0  10.4  171.7   0.1676   2.1   12.7	Crab
 66.0055  13.3860    1.0  24.6 -141.1   1.0734  11.8 ------	UNKNOWN
 45.7553  10.6568    2.7  40.6 -118.1   0.9187   4.2 ------	UNKNOWN
Post-slew image of 15-350 keV band
Time interval of the image:
96.284600 962.656000

# RAcent  DECcent POSerr Theta    Phi  PeakCts   SNR AngSep     Name
#  [deg]    [deg]    ['] [deg]  [deg]                   [']
 83.6356  22.0202    0.2  18.8   64.5  36.6020  53.0    0.4	Crab
 88.2150   0.8449    2.7  25.3  122.1   3.3263   4.3 ------	UNKNOWN
 83.2427   0.8658    2.7  21.2  129.1   3.0647   4.3 ------	UNKNOWN
 82.4525  56.7788    3.0  45.2   16.8   4.6619   3.8 ------	UNKNOWN
 66.9857 -42.3533    2.3  55.8 -176.7  13.1556   4.9 ------	UNKNOWN
 56.2557  26.8622    2.5  16.3  -28.6   2.8021   4.7 ------	UNKNOWN
 48.9573  41.7804    3.6  32.0  -20.2   2.2381   3.2 ------	UNKNOWN
 30.8887 -19.9060    2.7  48.0 -129.1  16.2222   4.2 ------	UNKNOWN
Plot creation:
Wed May 30 17:12:00 EDT 2018