Estimated redshift from machine learning (Ukwatta et al. 2016) - may take a few minute to calcaulte
Image
Pre-slew 15.0-350.0 keV image (Event data)

#   RAcent    DECcent   POSerr    Theta     Phi              Peak Cts       SNR   Name
   53.3896   -50.2140   0.0025    25.1501  -147.2724         7.0760727     77.592 TRIG_00821902

Foreground time interval of the image:
 -5.908  11.901 (delta_t =  17.809 [sec])
Background time interval of the image:
-239.800  -5.908 (delta_t = 233.892 [sec])
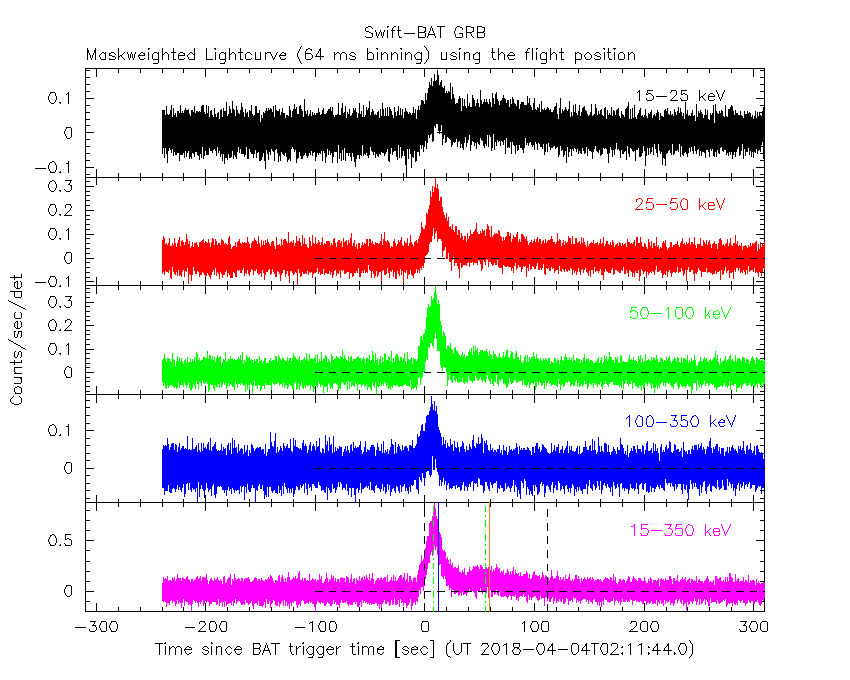
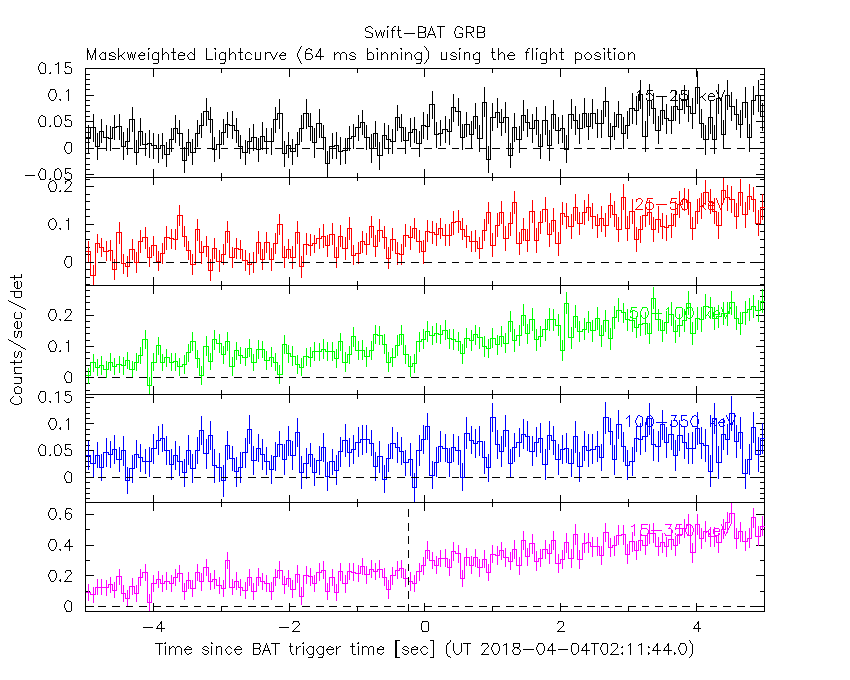
Lightcurves
Notes:
- 1) The mask-weighted light curves are using the flight position.
- 2) Multiple plots of different time binning/intervals are shown to cover all scenarios of short/long GRBs, rate/image triggers, and real/false positives.
- 3) For all the mask-weighted lightcurves, the y-axis units are counts/sec/det where a det is 0.4 x 0.4 = 0.16 sq cm.
- 4) The verticle lines correspond to following: green dotted lines are T50 interval, black dotted lines are T90 interval, blue solid line(s) is a spacecraft slew start time, and orange solid line(s) is a spacecraft slew end time.
- 5) Time of each bin is in the middle of the bin.
1 s binning
From T0-310 s to T0+310 s

From T100_start - 20 s to T100_end + 30 s

Full time interval

64 ms binning
Full time interval
From T100_start to T100_end

From T0-5 sec to T0+5 sec
16 ms binning
From T100_start-5 s to T100_start+5 s

Blue+Cyan dotted lines: Time interval of the scaled map
From 0.000000 to 1.024000
8 ms binning
From T100_start-3 s to T100_start+3 s

Blue+Cyan dotted lines: Time interval of the scaled map
From 0.000000 to 1.024000
2 ms binning
From T100_start-1 s to T100_start+1 s

Blue+Cyan dotted lines: Time interval of the scaled map
From 0.000000 to 1.024000
SN=5 or 10 sec. binning (whichever binning is satisfied first)

SN=5 or 10 sec. binning (T < 200 sec)

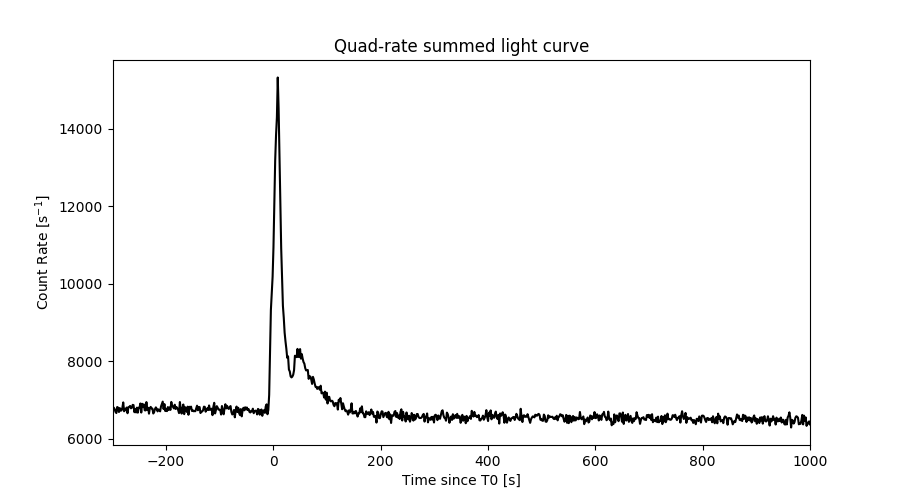
Quad-rate summed light curves (from T0-300s to T0+1000s)
Spectral Evolution

Spectra
Notes:
- 1) The fitting includes the systematic errors.
- 2) When the burst includes telescope slew time periods, the fitting uses an average response file made from multiple 5-s response files through out the slew time plus single time preiod for the non-slew times, and weighted by the total counts in the corresponding time period using addrmf. An average response file is needed becuase a spectral fit using the pre-slew DRM will introduce some errors in both a spectral shape and a normalization if the PHA file contains a lot of the slew/post-slew time interval.
- 3) For fits to more complicated models (e.g. a power-law over a cutoff power-law), the BAT team has decided to require a chi-square improvement of more than 6 for each extra dof.
Time averaged spectrum fit using the average DRM
Power-law model

Time interval is from   -5.908 sec. to  196.280 sec.

Spectral model in power-law:
------------------------------------------------------------
Parameters  : value       lower 90%   higher 90%
Photon index: 1.33366     ( -0.0365017   0.0364244 )
Norm@50keV  : 5.95097E-03    ( -0.000110991   0.000110877 )
------------------------------------------------------------
#Fit statistic : Chi-Squared =          31.12 using 59 PHA bins.
# Reduced chi-squared =         0.5459 for     57 degrees of freedom
# Null hypothesis probability =   9.979517e-01

Photon flux (15-150 keV)    in 202.2 sec: 0.714565 ( -0.015113  0.01519 ) ph/cm2/s
Energy fluence (15-150 keV)             : 1.17975e-05 ( -2.24137e-07  2.24027e-07 ) ergs/cm2
Cutoff power-law model

Time interval is from   -5.908 sec. to  196.280 sec.
Spectral model in the cutoff power-law:
------------------------------------------------------------
Parameters  : value       lower 90%   higher 90%
Photon index: 1.28422     ( -0.147458   0.0626794 )
Epeak [keV] : 835.133      ( -873.109 -873.109 )
Norm@50keV  : 6.24554E-03    ( -0.000151065   0.000939427 )
------------------------------------------------------------
#Fit statistic : Chi-Squared =          30.81 using 59 PHA bins.
# Reduced chi-squared =         0.5501 for     56 degrees of freedom
# Null hypothesis probability =   9.975257e-01

Photon flux (15-150 keV)    in 202.2 sec: 0.711628 ( -0.017292  0.015502 ) ph/cm2/s
Energy fluence (15-150 keV)             : 1.17631e-05 ( -2.46039e-07  2.36635e-07 ) ergs/cm2
Band function

Time interval is from   -5.908 sec. to  196.280 sec.

Spectral model in the Band function:
------------------------------------------------------------
Parameters  : value       lower 90%   higher 90%
alpha       : -0.957389   ( 0.965904   4.90849 )
beta        : -1.35482    ( 1.35474   0.0504054 )
Epeak [keV] : 101.047      ( -106.405 534.259 )
Norm@50keV   : 9.90254E-03    ( -0.00362951   0 )
------------------------------------------------------------
#Fit statistic : Chi-Squared =          30.16 using 59 PHA bins.
# Reduced chi-squared =         0.5484 for     55 degrees of freedom
# Null hypothesis probability =   9.974258e-01

Photon flux (15-150 keV)    in 202.2 sec: 0.706471 ( -0.020212  0.020163 ) ph/cm2/s
Energy fluence (15-150 keV)             : 1.17975e-05 ( -2.24137e-07  2.24027e-07 ) ergs/cm2
Single BB

Spectral model blackbody:
------------------------------------------------------------
Parameters  : value    Lower 90%  Upper 90%
kT [keV]    : 19.5103  (  )
R^2/D10^2   : 3.29456E-02  (   )
(R is the radius in km and D10 is the distance to the source in units of 10 kpc)
------------------------------------------------------------
#Fit statistic : Chi-Squared =         577.81 using 59 PHA bins.
# Reduced chi-squared =         10.137 for     57 degrees of freedom
# Null hypothesis probability =   3.054644e-87

Energy  Fluence     90% Error
[keV]   [erg/cm2]   [erg/cm2]
15- 25  4.935e-07   1.870e-08
25- 50  2.418e-06   6.572e-08
50-150  6.797e-06   2.032e-07
15-150  9.708e-06   2.113e-07
Thermal bremsstrahlung (OTTB)

Spectral model: thermal bremsstrahlung
------------------------------------------------------------
Parameters  : value         Lower 90%    Upper 90%
kT [keV]    : 199.363       (      )
Norm        : 3.04428       (     )
------------------------------------------------------------
#Fit statistic : Chi-Squared =         179.67 using 59 PHA bins.
# Reduced chi-squared =         3.1521 for     57 degrees of freedom
# Null hypothesis probability =   1.265700e-14

Energy  Fluence     90% Error
[keV]   [erg/cm2]   [erg/cm2]
15- 25  1.533e-06   3.084e-08
25- 50  2.948e-06   6.673e-08
50-150  6.467e-06   1.375e-07
15-150  1.095e-05   2.265e-07
Double BB

Spectral model: bbodyrad<1> + bbodyrad<2>
------------------------------------------------------------
Parameters  : value         Lower 90%    Upper 90%
kT1 [keV]   : 8.42241        (-0.658245      0.69876)
R1^2/D10^2  : 0.349739        (-0.0787425      0.109018)
kT2 [keV]   : 33.3968        (-2.63333      3.37204)
R2^2/D10^2  : 4.57828E-03    (-0.00123784   0.00146842)
------------------------------------------------------------
#Fit statistic : Chi-Squared =          44.89 using 59 PHA bins.
# Reduced chi-squared =         0.8162 for     55 degrees of freedom
# Null hypothesis probability =   8.328664e-01

Energy  Fluence     90% Error
[keV]   [erg/cm2]   [erg/cm2]
15- 25  1.091e-06   7.623e-08
25- 50  2.765e-06   1.102e-07
50-150  7.829e-06   3.488e-07
15-150  1.169e-05   4.802e-07
Peak spectrum fit
Power-law model

Time interval is from    8.880 sec. to    9.880 sec.

Spectral model in power-law:
------------------------------------------------------------
Parameters  : value       lower 90%   higher 90%
Photon index: 0.792318     ( -0.0744128   0.0732945 )
Norm@50keV  : 4.49179E-02    ( -0.00201102   0.00200434 )
------------------------------------------------------------
#Fit statistic : Chi-Squared =          58.63 using 59 PHA bins.
# Reduced chi-squared =          1.029 for     57 degrees of freedom
# Null hypothesis probability =   4.153878e-01

Photon flux (15-150 keV)    in 1 sec: 5.16392 ( -0.22699  0.22712 ) ph/cm2/s
Energy fluence (15-150 keV)             : 5.2666e-07 ( -2.45718e-08  2.46299e-08 ) ergs/cm2
Cutoff power-law model

Time interval is from    8.880 sec. to    9.880 sec.
Spectral model in the cutoff power-law:
------------------------------------------------------------
Parameters  : value       lower 90%   higher 90%
Photon index: 0.320594     ( -0.326893   0.303271 )
Epeak [keV] : 212.681      ( -62.798 254.404 )
Norm@50keV  : 7.17533E-02    ( -0.0182277   0.0262939 )
------------------------------------------------------------
#Fit statistic : Chi-Squared =          51.31 using 59 PHA bins.
# Reduced chi-squared =         0.9163 for     56 degrees of freedom
# Null hypothesis probability =   6.525530e-01

Photon flux (15-150 keV)    in 1 sec: 5.10055 ( -0.23063  0.23066 ) ph/cm2/s
Energy fluence (15-150 keV)             : 5.18764e-07 ( -2.57605e-08  2.56133e-08 ) ergs/cm2
Band function

Time interval is from    8.880 sec. to    9.880 sec.

Spectral model in the Band function:
------------------------------------------------------------
Parameters  : value       lower 90%   higher 90%
alpha       : -0.861797   ( 0.861797   0.861797 )
beta        : -0.792325    ( -0.0732479   0.0744914 )
Epeak [keV] : 15.4898      ( -15.4898 -15.4898 )
Norm@50keV   : 6.44428E-02    ( -0.0214898   0 )
------------------------------------------------------------
#Fit statistic : Chi-Squared =          58.63 using 59 PHA bins.
# Reduced chi-squared =          1.066 for     55 degrees of freedom
# Null hypothesis probability =   3.437755e-01

Photon flux (15-150 keV)    in 1 sec: 0.158822 ( -0.158822  -0.122593 ) ph/cm2/s
Energy fluence (15-150 keV)             : 5.15822e-07 ( -2.55241e-08  2.55303e-08 ) ergs/cm2
Single BB

Spectral model blackbody:
------------------------------------------------------------
Parameters  : value    Lower 90%  Upper 90%
kT [keV]    : 24.9081  (-1.47239  1.61782)
R^2/D10^2   : 0.135257  (-0.0231766   0.0272362)
(R is the radius in km and D10 is the distance to the source in units of 10 kpc)
------------------------------------------------------------
#Fit statistic : Chi-Squared =         103.30 using 59 PHA bins.
# Reduced chi-squared =         1.8122 for     57 degrees of freedom
# Null hypothesis probability =   1.708166e-04

Energy  Fluence     90% Error
[keV]   [erg/cm2]   [erg/cm2]
15- 25  1.461e-08   1.295e-09
25- 50  8.271e-08   5.765e-09
50-150  3.807e-07   2.415e-08
15-150  4.780e-07   2.435e-08
Thermal bremsstrahlung (OTTB)

Spectral model: thermal bremsstrahlung
------------------------------------------------------------
Parameters  : value         Lower 90%    Upper 90%
kT [keV]    : 199.363       (      )
Norm        : 19.6049       (     )
------------------------------------------------------------
#Fit statistic : Chi-Squared =         325.37 using 59 PHA bins.
# Reduced chi-squared =         5.7082 for     57 degrees of freedom
# Null hypothesis probability =   3.023904e-39

Energy  Fluence     90% Error
[keV]   [erg/cm2]   [erg/cm2]
15- 25  4.882e-08   2.430e-09
25- 50  9.391e-08   5.045e-09
50-150  2.060e-07   1.255e-08
15-150  3.487e-07   2.220e-08
Double BB

Spectral model: bbodyrad<1> + bbodyrad<2>
------------------------------------------------------------
Parameters  : value         Lower 90%    Upper 90%
kT1 [keV]   : 12.6853        (-3.12865      2.97471)
R1^2/D10^2  : 0.566762        (-0.208775      0.44839)
kT2 [keV]   : 49.7410        (-15.6305      139.753)
R2^2/D10^2  : 1.40974E-02    (-0.00935442   0.0237322)
------------------------------------------------------------
#Fit statistic : Chi-Squared =          48.52 using 59 PHA bins.
# Reduced chi-squared =         0.8821 for     55 degrees of freedom
# Null hypothesis probability =   7.190827e-01

Energy  Fluence     90% Error
[keV]   [erg/cm2]   [erg/cm2]
15- 25  2.316e-08   5.565e-09
25- 50  9.246e-08   2.079e-08
50-150  4.006e-07   1.570e-07
15-150  5.162e-07   1.754e-07
Pre-slew spectrum (Pre-slew PHA with pre-slew DRM)
Power-law model

Spectral model in power-law:
------------------------------------------------------------
Parameters  : value       lower 90%   higher 90%
Photon index: 0.729163     ( -0.0337873   0.0335367 )
Norm@50keV  : 2.62460E-02    ( -0.000527065   0.000525234 )
------------------------------------------------------------
#Fit statistic : Chi-Squared =          46.88 using 59 PHA bins.
# Reduced chi-squared =         0.8224 for     57 degrees of freedom
# Null hypothesis probability =   8.282927e-01

Photon flux (15-150 keV)    in 17.81 sec: 3.02737 ( -0.057836  0.0579003 ) ph/cm2/s
Energy fluence (15-150 keV)             : 5.63193e-06 ( -1.0489e-07  1.04917e-07 ) ergs/cm2
Cutoff power-law model

Spectral model in the cutoff power-law:
------------------------------------------------------------
Parameters  : value       lower 90%   higher 90%
Photon index: 0.436046     ( -0.146641   0.141824 )
Epeak [keV] : 351.340      ( -93.7335 252.975 )
Norm@50keV  : 3.39394E-02    ( -0.00388911   0.00451035 )
------------------------------------------------------------
#Fit statistic : Chi-Squared =          34.10 using 59 PHA bins.
# Reduced chi-squared =         0.6090 for     56 degrees of freedom
# Null hypothesis probability =   9.908369e-01

Photon flux (15-150 keV)    in 17.81 sec: 2.99026 ( -0.06003  0.06022 ) ph/cm2/s
Energy fluence (15-150 keV)             : 5.60675e-06 ( -1.07092e-07  1.0686e-07 ) ergs/cm2
Band function

Spectral model in the Band function:
------------------------------------------------------------
Parameters  : value       lower 90%   higher 90%
alpha       : 4.99995   ( -4.99995   -4.99995 )
beta        : -0.729232    ( -0.0335244   0.0338154 )
Epeak [keV] : 16.7741      ( -16.7741 9982.82 )
Norm@50keV   : 1.32803E+04    ( -235.943   7.6273e+06 )
------------------------------------------------------------
#Fit statistic : Chi-Squared =          46.86 using 59 PHA bins.
# Reduced chi-squared =         0.8519 for     55 degrees of freedom
# Null hypothesis probability =   7.745948e-01

Photon flux (15-150 keV)    in 17.81 sec: 2.99287 ( -0.05574  0.05127 ) ph/cm2/s
Energy fluence (15-150 keV)             : 5.63254e-06 ( -1.04971e-07  1.04847e-07 ) ergs/cm2
S(25-50 keV) vs. S(50-100 keV) plot
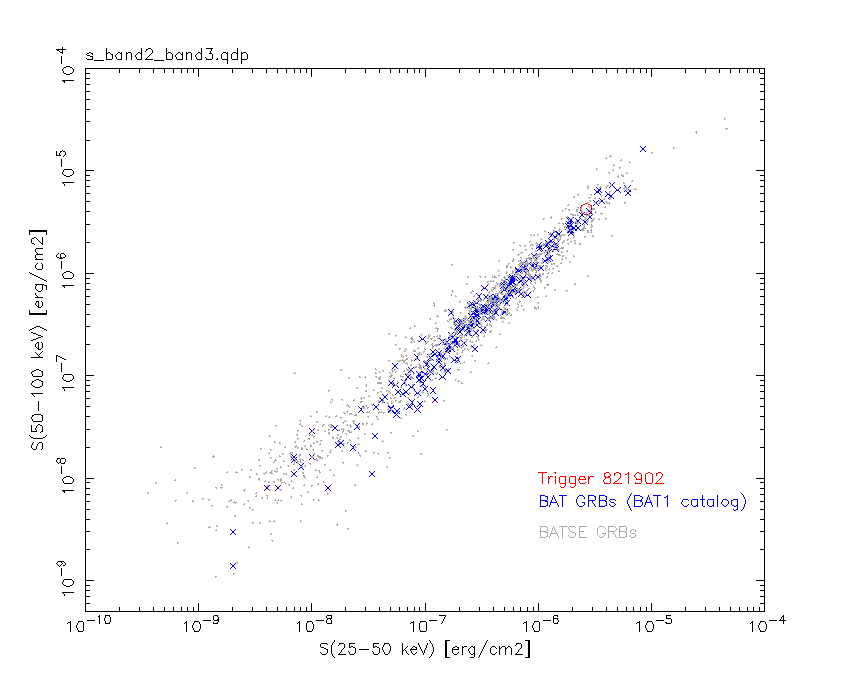
S(25-50 keV)  = 2.67e-06
S(50-100 keV) = 4.25e-06
T90 vs. Hardness ratio plot

T90                                   = 111.707999944687 sec.
Hardness ratio (energy fluence ratio) = 1.59176
Color vs. Color plot
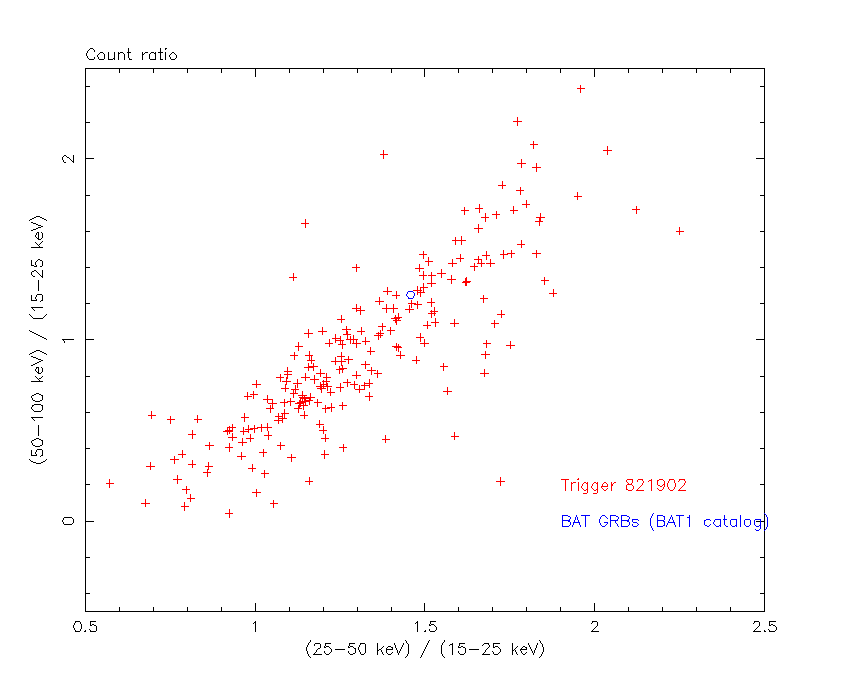
Count Ratio  (25-50 keV) / (15-25 keV) = 1.45754
Count Ratio (50-100 keV) / (15-25 keV) = 1.24904
Mask shadow pattern

IMX = -3.949684927038987E-01, IMY = 2.538342577597678E-01
TIME vs. PHA plot around the trigger time

Blue+Cyan dotted lines: Time interval of the scaled map
From 0.000000 to 1.024000
TIME vs. DetID plot around the trigger time

Blue+Cyan dotted lines: Time interval of the scaled map
From 0.000000 to 1.024000
100 us light curve (15-350 keV)
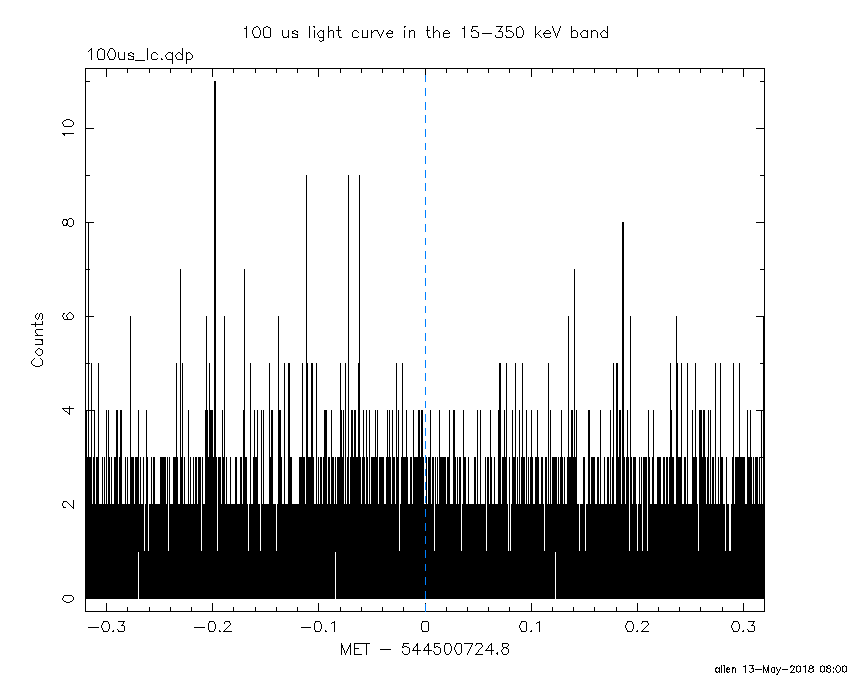
Blue+Cyan dotted lines: Time interval of the scaled map
From 0.000000 to 1.024000
Spacecraft aspect plot

Bright source in the pre-burst/pre-slew/post-slew images
Pre-burst image of 15-350 keV band
Time interval of the image:
-239.800000 -5.908000

# RAcent  DECcent POSerr Theta    Phi  PeakCts   SNR AngSep     Name
#  [deg]    [deg]    ['] [deg]  [deg]                   [']
 83.6605  22.0150    1.6  59.2  -16.3   9.3995   7.4    1.5	Crab
135.2994 -40.4930    0.0  39.9   94.9   1.3215   1.4   11.1	Vela X-1
130.6924 -79.0703    2.5  45.9  152.4   2.4676   4.6 ------	UNKNOWN
346.1517 -84.0090    2.8  53.8  171.0   3.3893   4.1 ------	UNKNOWN
 90.0994  -2.0331    3.4  35.6   -5.1   0.9369   3.4 ------	UNKNOWN
 66.3539 -17.7881    2.9  24.6  -59.0   0.9794   4.0 ------	UNKNOWN
Pre-slew background subtracted image of 15-350 keV band
Time interval of the image:
-5.908000 11.900600

# RAcent  DECcent POSerr Theta    Phi  PeakCts   SNR AngSep     Name
#  [deg]    [deg]    ['] [deg]  [deg]                   [']
 83.6193  21.9494    6.2  59.1  -16.3  -1.0493  -1.9    4.0	Crab
135.4658 -40.4494   10.9  40.0   94.9  -0.4245  -1.1    6.9	Vela X-1
111.0214  -5.9492    2.5  40.0   29.1   0.7291   4.6 ------	UNKNOWN
 40.5797 -64.6452    2.5  37.3 -167.6   0.4789   4.6 ------	UNKNOWN
 53.3894 -50.2142    0.1  25.2 -147.3   7.0749  77.6 ------	UNKNOWN
Post-slew image of 15-350 keV band
Time interval of the image:
59.100600 962.228800

# RAcent  DECcent POSerr Theta    Phi  PeakCts   SNR AngSep     Name
#  [deg]    [deg]    ['] [deg]  [deg]                   [']
 90.0037 -22.2732    2.9  39.9   14.3   3.2758   3.9 ------	UNKNOWN
338.1102 -70.7904    2.5  38.8  165.6   4.8453   4.6 ------	UNKNOWN
 53.4336 -50.2020    1.5   0.0   71.9   4.2707   7.7 ------	UNKNOWN
 38.2514 -23.9125    2.8  28.8  -74.7   3.5920   4.1 ------	UNKNOWN
 69.1755   5.7945    3.4  57.6  -26.3  12.9018   3.4 ------	UNKNOWN
 32.8998 -13.8032    4.0  40.0  -76.9   6.0226   2.9 ------	UNKNOWN
  3.3522 -25.6409    3.0  45.3 -121.3  11.2746   3.8 ------	UNKNOWN
356.7331 -27.7389    3.1  48.0 -129.1  12.8246   3.7 ------	UNKNOWN
Plot creation:
Sun May 13 08:00:50 EDT 2018