Estimated redshift from machine learning (Ukwatta et al. 2016) - may take a few minute to calcaulte
Image
Pre-slew 15.0-350.0 keV image (Event data)

#   RAcent    DECcent   POSerr    Theta     Phi              Peak Cts       SNR   Name
  356.8386    66.7914   0.0029    19.4806    17.9168         4.6642698     65.608 TRIG_00824451

Foreground time interval of the image:
 -6.920  12.421 (delta_t =  19.341 [sec])
Background time interval of the image:
-122.379  -6.920 (delta_t = 115.459 [sec])
Lightcurves
Notes:
- 1) The mask-weighted light curves are using the flight position.
- 2) Multiple plots of different time binning/intervals are shown to cover all scenarios of short/long GRBs, rate/image triggers, and real/false positives.
- 3) For all the mask-weighted lightcurves, the y-axis units are counts/sec/det where a det is 0.4 x 0.4 = 0.16 sq cm.
- 4) The verticle lines correspond to following: green dotted lines are T50 interval, black dotted lines are T90 interval, blue solid line(s) is a spacecraft slew start time, and orange solid line(s) is a spacecraft slew end time.
- 5) Time of each bin is in the middle of the bin.
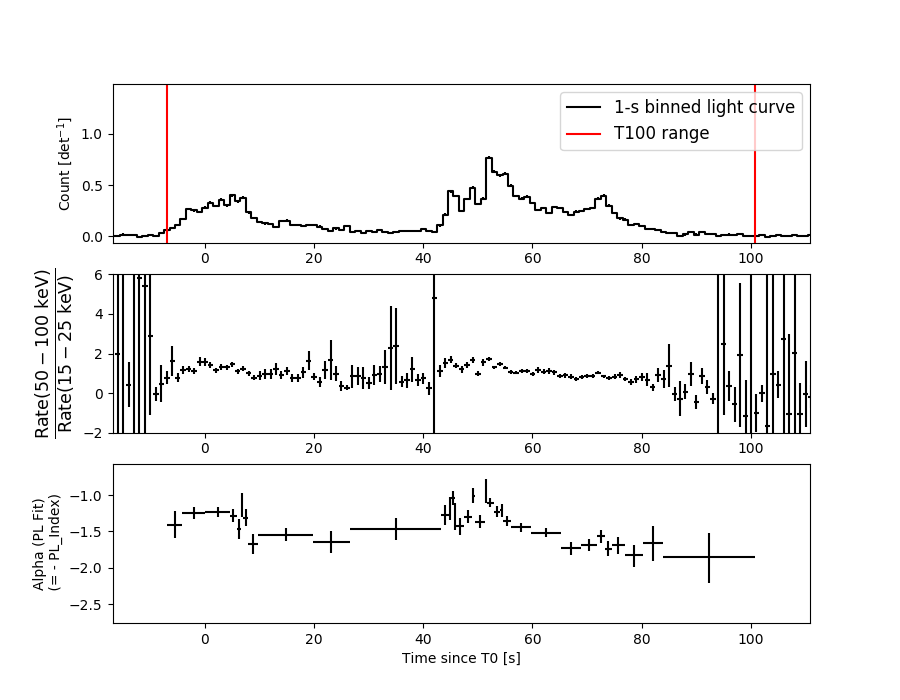
1 s binning
From T0-310 s to T0+310 s

From T100_start - 20 s to T100_end + 30 s

Full time interval

64 ms binning
Full time interval

From T100_start to T100_end

From T0-5 sec to T0+5 sec
16 ms binning
From T100_start-5 s to T100_start+5 s
Blue+Cyan dotted lines: Time interval of the scaled map
From 0.000000 to 1.024000
8 ms binning
From T100_start-3 s to T100_start+3 s
Blue+Cyan dotted lines: Time interval of the scaled map
From 0.000000 to 1.024000
2 ms binning
From T100_start-1 s to T100_start+1 s

Blue+Cyan dotted lines: Time interval of the scaled map
From 0.000000 to 1.024000
SN=5 or 10 sec. binning (whichever binning is satisfied first)

SN=5 or 10 sec. binning (T < 200 sec)
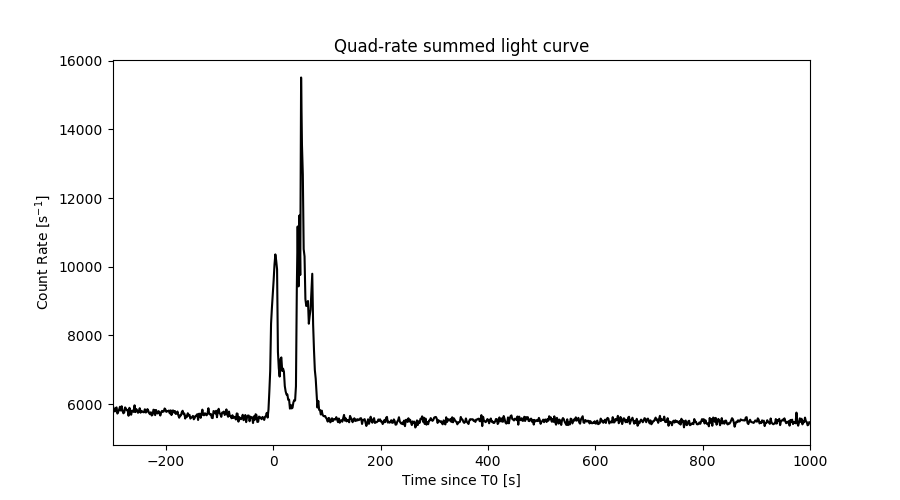
Quad-rate summed light curves (from T0-300s to T0+1000s)
Spectral Evolution
Spectra
Notes:
- 1) The fitting includes the systematic errors.
- 2) When the burst includes telescope slew time periods, the fitting uses an average response file made from multiple 5-s response files through out the slew time plus single time preiod for the non-slew times, and weighted by the total counts in the corresponding time period using addrmf. An average response file is needed becuase a spectral fit using the pre-slew DRM will introduce some errors in both a spectral shape and a normalization if the PHA file contains a lot of the slew/post-slew time interval.
- 3) For fits to more complicated models (e.g. a power-law over a cutoff power-law), the BAT team has decided to require a chi-square improvement of more than 6 for each extra dof.
Time averaged spectrum fit using the average DRM
Power-law model

Time interval is from   -6.920 sec. to  100.824 sec.

Spectral model in power-law:
------------------------------------------------------------
Parameters  : value       lower 90%   higher 90%
Photon index: 1.45218     ( -0.0301674   0.0301049 )
Norm@50keV  : 1.18016E-02    ( -0.000186476   0.00018625 )
------------------------------------------------------------
#Fit statistic : Chi-Squared =          40.21 using 59 PHA bins.
# Reduced chi-squared =         0.7054 for     57 degrees of freedom
# Null hypothesis probability =   9.551341e-01

Photon flux (15-150 keV)    in 107.7 sec: 1.45521 ( -0.02748  0.02758 ) ph/cm2/s
Energy fluence (15-150 keV)             : 1.21595e-05 ( -1.88951e-07  1.88997e-07 ) ergs/cm2
Cutoff power-law model

Time interval is from   -6.920 sec. to  100.824 sec.
Spectral model in the cutoff power-law:
------------------------------------------------------------
Parameters  : value       lower 90%   higher 90%
Photon index: 1.34973     ( -0.123592   0.112562 )
Epeak [keV] : 380.400      ( -173.601 -380.407 )
Norm@50keV  : 1.30235E-02    ( -0.00121075   0.00159948 )
------------------------------------------------------------
#Fit statistic : Chi-Squared =          38.12 using 59 PHA bins.
# Reduced chi-squared =         0.6808 for     56 degrees of freedom
# Null hypothesis probability =   9.676482e-01

Photon flux (15-150 keV)    in 107.7 sec: 1.44127 ( -0.03156  0.03178 ) ph/cm2/s
Energy fluence (15-150 keV)             : 1.2091e-05 ( -2.04775e-07  2.04722e-07 ) ergs/cm2
Band function

Time interval is from   -6.920 sec. to  100.824 sec.

Spectral model in the Band function:
------------------------------------------------------------
Parameters  : value       lower 90%   higher 90%
alpha       : -0.924031   ( -0.554955   5.2898 )
beta        : -1.48750    ( 1.4875   0.0444199 )
Epeak [keV] : 78.4217      ( -43.5235 330.393 )
Norm@50keV   : 2.35187E-02    ( -0.0116033   0.113239 )
------------------------------------------------------------
#Fit statistic : Chi-Squared =          36.16 using 59 PHA bins.
# Reduced chi-squared =         0.6574 for     55 degrees of freedom
# Null hypothesis probability =   9.767098e-01

Photon flux (15-150 keV)    in 107.7 sec: 1.42339 ( -0.03897  0.03809 ) ph/cm2/s
Energy fluence (15-150 keV)             : 6.00116e-06 ( 0  0 ) ergs/cm2
Single BB

Spectral model blackbody:
------------------------------------------------------------
Parameters  : value    Lower 90%  Upper 90%
kT [keV]    : 19.0875  (  )
R^2/D10^2   : 6.91806E-02  (   )
(R is the radius in km and D10 is the distance to the source in units of 10 kpc)
------------------------------------------------------------
#Fit statistic : Chi-Squared =         863.07 using 59 PHA bins.
# Reduced chi-squared =         15.142 for     57 degrees of freedom
# Null hypothesis probability =  2.091253e-144

Energy  Fluence     90% Error
[keV]   [erg/cm2]   [erg/cm2]
15- 25  5.327e-07   1.912e-08
25- 50  2.570e-06   6.516e-08
50-150  6.888e-06   1.529e-07
15-150  9.992e-06   1.707e-07
Thermal bremsstrahlung (OTTB)

Spectral model: thermal bremsstrahlung
------------------------------------------------------------
Parameters  : value         Lower 90%    Upper 90%
kT [keV]    : 199.363       (      )
Norm        : 6.10932       (     )
------------------------------------------------------------
#Fit statistic : Chi-Squared =         122.93 using 59 PHA bins.
# Reduced chi-squared =         2.1567 for     57 degrees of freedom
# Null hypothesis probability =   9.611507e-07

Energy  Fluence     90% Error
[keV]   [erg/cm2]   [erg/cm2]
15- 25  1.638e-06   2.962e-08
25- 50  3.152e-06   5.600e-08
50-150  6.912e-06   1.201e-07
15-150  1.170e-05   2.154e-07
Double BB
Spectral model: bbodyrad<1> + bbodyrad<2>
------------------------------------------------------------
Parameters  : value         Lower 90%    Upper 90%
kT1 [keV]   : 8.33522        (-0.515897      0.53994)
R1^2/D10^2  : 0.777154        (-0.146571      0.190722)
kT2 [keV]   : 31.8588        (-1.94816      2.35358)
R2^2/D10^2  : 9.71632E-03    (-0.0021223   0.00243318)
------------------------------------------------------------
#Fit statistic : Chi-Squared =          52.34 using 59 PHA bins.
# Reduced chi-squared =         0.9516 for     55 degrees of freedom
# Null hypothesis probability =   5.770201e-01

Energy  Fluence     90% Error
[keV]   [erg/cm2]   [erg/cm2]
15- 25  1.242e-06   7.216e-08
25- 50  3.043e-06   8.508e-08
50-150  7.672e-06   2.240e-07
15-150  1.196e-05   3.016e-07
Peak spectrum fit
Power-law model
Time interval is from   51.740 sec. to   52.740 sec.

Spectral model in power-law:
------------------------------------------------------------
Parameters  : value       lower 90%   higher 90%
Photon index: 1.11630     ( -0.067927   0.0676807 )
Norm@50keV  : 5.10205E-02    ( -0.00192355   0.00192318 )
------------------------------------------------------------
#Fit statistic : Chi-Squared =          58.98 using 59 PHA bins.
# Reduced chi-squared =          1.035 for     57 degrees of freedom
# Null hypothesis probability =   4.028281e-01

Photon flux (15-150 keV)    in 1 sec: 5.92773 ( -0.22937  0.22954 ) ph/cm2/s
Energy fluence (15-150 keV)             : 5.3075e-07 ( -2.24033e-08  2.24727e-08 ) ergs/cm2
Cutoff power-law model

Time interval is from   51.740 sec. to   52.740 sec.
Spectral model in the cutoff power-law:
------------------------------------------------------------
Parameters  : value       lower 90%   higher 90%
Photon index: 0.990782     ( -0.264253   0.156109 )
Epeak [keV] : 454.519      ( -454.519 -454.519 )
Norm@50keV  : 5.81681E-02    ( -0.00851595   0.0178348 )
------------------------------------------------------------
#Fit statistic : Chi-Squared =          58.26 using 59 PHA bins.
# Reduced chi-squared =          1.040 for     56 degrees of freedom
# Null hypothesis probability =   3.920748e-01

Photon flux (15-150 keV)    in 1 sec: 2.17827 ( -0.28083  0.19236 ) ph/cm2/s
Energy fluence (15-150 keV)             : 1.33052e-07 ( -1.57866e-08  1.00382e-08 ) ergs/cm2
Band function

Time interval is from   51.740 sec. to   52.740 sec.

Spectral model in the Band function:
------------------------------------------------------------
Parameters  : value       lower 90%   higher 90%
alpha       : -0.990803   ( 0.727587   0.727587 )
beta        : -9.99825    ( 9.99577   19.9958 )
Epeak [keV] : 454.527      ( -350.068 -454.501 )
Norm@50keV   : 5.81610E-02    ( -0.0159069   0.0178478 )
------------------------------------------------------------
#Fit statistic : Chi-Squared =          58.26 using 59 PHA bins.
# Reduced chi-squared =          1.059 for     55 degrees of freedom
# Null hypothesis probability =   3.562374e-01

Photon flux (15-150 keV)    in 1 sec: 5.89348 ( -0.22182  0.22635 ) ph/cm2/s
Energy fluence (15-150 keV)             : 6.53672e-09 ( 0  0 ) ergs/cm2
Single BB

Spectral model blackbody:
------------------------------------------------------------
Parameters  : value    Lower 90%  Upper 90%
kT [keV]    : 20.5020  (  )
R^2/D10^2   : 0.255769  (   )
(R is the radius in km and D10 is the distance to the source in units of 10 kpc)
------------------------------------------------------------
#Fit statistic : Chi-Squared =         194.52 using 59 PHA bins.
# Reduced chi-squared =         3.4127 for     57 degrees of freedom
# Null hypothesis probability =   6.477911e-17

Energy  Fluence     90% Error
[keV]   [erg/cm2]   [erg/cm2]
15- 25  2.052e-08   1.585e-09
25- 50  1.039e-07   5.870e-09
50-150  3.247e-07   2.085e-08
15-150  4.491e-07   2.135e-08
Thermal bremsstrahlung (OTTB)
Spectral model: thermal bremsstrahlung
------------------------------------------------------------
Parameters  : value         Lower 90%    Upper 90%
kT [keV]    : 199.363       (      )
Norm        : 24.2675       (     )
------------------------------------------------------------
#Fit statistic : Chi-Squared =         171.94 using 59 PHA bins.
# Reduced chi-squared =         3.0165 for     57 degrees of freedom
# Null hypothesis probability =   1.836477e-13

Energy  Fluence     90% Error
[keV]   [erg/cm2]   [erg/cm2]
15- 25  6.043e-08   2.510e-09
25- 50  1.162e-07   5.000e-09
50-150  2.549e-07   1.030e-08
15-150  4.316e-07   1.800e-08
Double BB

Spectral model: bbodyrad<1> + bbodyrad<2>
------------------------------------------------------------
Parameters  : value         Lower 90%    Upper 90%
kT1 [keV]   : 7.79790        (-1.22307      1.39317)
R1^2/D10^2  : 3.20560        (-1.26677      2.43166)
kT2 [keV]   : 33.0063        (-4.04974      6.07976)
R2^2/D10^2  : 4.84343E-02    (-0.0200728   0.0260957)
------------------------------------------------------------
#Fit statistic : Chi-Squared =          59.87 using 59 PHA bins.
# Reduced chi-squared =          1.089 for     55 degrees of freedom
# Null hypothesis probability =   3.034476e-01

Energy  Fluence     90% Error
[keV]   [erg/cm2]   [erg/cm2]
15- 25  4.233e-08   5.940e-09
25- 50  1.076e-07   1.086e-08
50-150  3.804e-07   4.385e-08
15-150  5.304e-07   5.175e-08
Pre-slew spectrum (Pre-slew PHA with pre-slew DRM)
Power-law model

Spectral model in power-law:
------------------------------------------------------------
Parameters  : value       lower 90%   higher 90%
Photon index: 1.34933     ( -0.0446162   0.0445533 )
Norm@50keV  : 1.59829E-02    ( -0.000369967   0.000369851 )
------------------------------------------------------------
#Fit statistic : Chi-Squared =          48.27 using 59 PHA bins.
# Reduced chi-squared =         0.8469 for     57 degrees of freedom
# Null hypothesis probability =   7.881328e-01

Photon flux (15-150 keV)    in 19.34 sec: 1.92522 ( -0.0492756  0.0494178 ) ph/cm2/s
Energy fluence (15-150 keV)             : 3.01946e-06 ( -7.35835e-08  7.36748e-08 ) ergs/cm2
Cutoff power-law model

Spectral model in the cutoff power-law:
------------------------------------------------------------
Parameters  : value       lower 90%   higher 90%
Photon index: 1.21913     ( -0.179726   0.149526 )
Epeak [keV] : 343.958      (   )
Norm@50keV  : 1.82296E-02    (     )
------------------------------------------------------------
#Fit statistic : Chi-Squared =          46.64 using 59 PHA bins.
# Reduced chi-squared =         0.8329 for     56 degrees of freedom
# Null hypothesis probability =   8.092598e-01

Photon flux (15-150 keV)    in 19.34 sec: 1.90612 ( -0.05483  0.05495 ) ph/cm2/s
Energy fluence (15-150 keV)             : 2.99702e-06 ( -8.04544e-08  8.0145e-08 ) ergs/cm2
Band function

Spectral model in the Band function:
------------------------------------------------------------
Parameters  : value       lower 90%   higher 90%
alpha       : 1.16795   ( -1.16898   -1.16898 )
beta        : -1.36257    ( -0.0504545   0.0485428 )
Epeak [keV] : 29.3305      ( -29.3257 107.202 )
Norm@50keV   : 1.37246    ( -1.38157   778.888 )
------------------------------------------------------------
#Fit statistic : Chi-Squared =          46.69 using 59 PHA bins.
# Reduced chi-squared =         0.8489 for     55 degrees of freedom
# Null hypothesis probability =   7.799292e-01

Photon flux (15-150 keV)    in 19.34 sec: 1.92525 ( -0.04929  0.04941 ) ph/cm2/s
Energy fluence (15-150 keV)             : 2.99582e-06 ( -6.90684e-08  7.54351e-08 ) ergs/cm2
S(25-50 keV) vs. S(50-100 keV) plot

S(25-50 keV)  = 2.94e-06
S(50-100 keV) = 4.30e-06
T90 vs. Hardness ratio plot
T90                                   = 77.9759999513626 sec.
Hardness ratio (energy fluence ratio) = 1.46259
Color vs. Color plot

Count Ratio  (25-50 keV) / (15-25 keV) = 1.39056
Count Ratio (50-100 keV) / (15-25 keV) = 1.09808
Mask shadow pattern

IMX = 3.365826677118053E-01, IMY = -1.088219953013595E-01
TIME vs. PHA plot around the trigger time

Blue+Cyan dotted lines: Time interval of the scaled map
From 0.000000 to 1.024000
TIME vs. DetID plot around the trigger time

Blue+Cyan dotted lines: Time interval of the scaled map
From 0.000000 to 1.024000
100 us light curve (15-350 keV)
Blue+Cyan dotted lines: Time interval of the scaled map
From 0.000000 to 1.024000
Spacecraft aspect plot
Bright source in the pre-burst/pre-slew/post-slew images
Pre-burst image of 15-350 keV band
Time interval of the image:
-122.379410 -6.920000

# RAcent  DECcent POSerr Theta    Phi  PeakCts   SNR AngSep     Name
#  [deg]    [deg]    ['] [deg]  [deg]                   [']
 83.6191  22.0187    0.9  49.1 -163.1   4.1838  12.5    0.8	Crab
308.0378  41.0461  152.8  56.0    7.9   0.0557   0.1    6.5	Cyg X-3
326.0941  38.3984    7.4  49.9   -8.1   0.4020   1.6    5.9	Cyg X-2
163.0052  72.0361    3.1  40.7   96.8   2.1852   3.7 ------	UNKNOWN
 16.2105  70.9032    2.8  13.5   37.5   0.4941   4.2 ------	UNKNOWN
Pre-slew background subtracted image of 15-350 keV band
Time interval of the image:
-6.920000 12.420600

# RAcent  DECcent POSerr Theta    Phi  PeakCts   SNR AngSep     Name
#  [deg]    [deg]    ['] [deg]  [deg]                   [']
 83.6437  22.1413    8.4  49.0 -163.2   0.2254   1.4    7.6	Crab
308.0951  40.7950    4.4  56.2    7.7  -1.1411  -2.9    9.5	Cyg X-3
326.2590  38.2514    5.0  50.0   -8.3   0.3350   2.3    5.9	Cyg X-2
356.8386  66.7914    0.2  19.5   17.9   4.6644  65.6 ------	UNKNOWN
 96.2416  27.2057    2.2  50.0 -179.6   0.9464   5.2 ------	UNKNOWN
Post-slew image of 15-350 keV band
Time interval of the image:
53.220600 962.613200

# RAcent  DECcent POSerr Theta    Phi  PeakCts   SNR AngSep     Name
#  [deg]    [deg]    ['] [deg]  [deg]                   [']
299.5648  35.2302    1.5  45.2   12.2   8.9481   7.9    2.1	Cyg X-1
308.0826  41.0439    2.6  36.9    7.5   3.2410   4.5    5.6	Cyg X-3
326.1546  38.2476   11.0  33.4  -16.5   0.7141   1.0    4.5	Cyg X-2
208.5644  76.9163    3.1  35.0  104.7   4.7281   3.7 ------	UNKNOWN
301.2576  40.5903    3.4  39.9   14.3   2.7659   3.4 ------	UNKNOWN
322.6603  65.6858    3.4  13.6   38.0   1.8989   3.4 ------	UNKNOWN
356.8388  66.7803    0.7   0.0  141.4   8.8087  16.5 ------	UNKNOWN
 40.8513  61.4206    2.1  19.5 -158.5   3.4519   5.4 ------	UNKNOWN
 85.1646  44.0127    3.2  49.7 -172.8   5.1237   3.6 ------	UNKNOWN
 88.4142  36.0789    2.8  57.8 -170.7  16.8553   4.1 ------	UNKNOWN
  6.6644  27.2229    3.4  40.0  -77.0   7.5797   3.4 ------	UNKNOWN
 48.1353  29.6584    2.5  48.0 -129.1  15.0004   4.6 ------	UNKNOWN
Plot creation:
Sun May 13 07:49:30 EDT 2018