Estimated redshift from machine learning (Ukwatta et al. 2016) - may take a few minute to calcaulte
Image
Pre-slew 15.0-350.0 keV image (Event data)
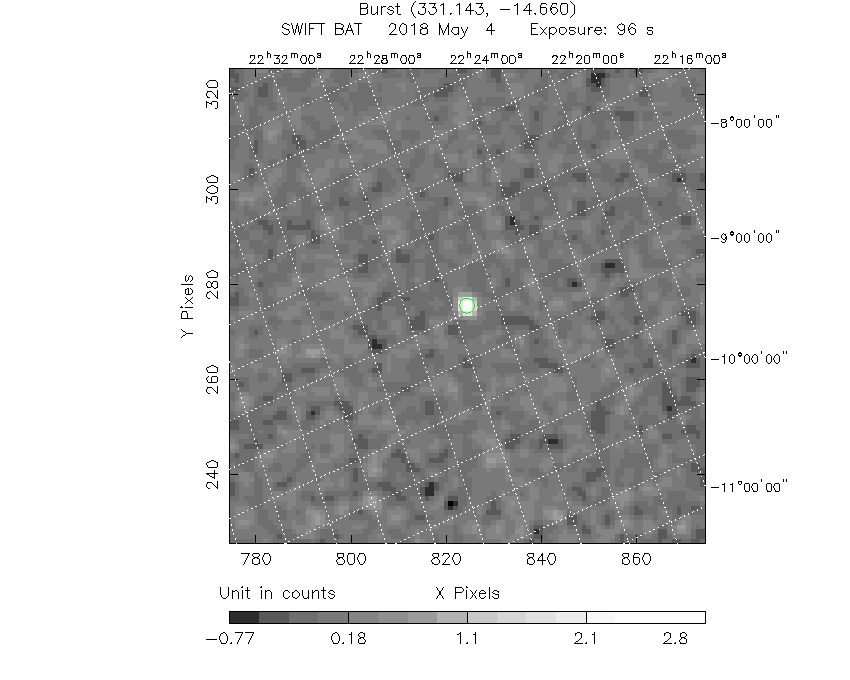
#   RAcent    DECcent   POSerr    Theta     Phi              Peak Cts       SNR   Name
  331.1428   -14.6666   0.0099    23.6561    74.6441         3.4971150     19.441 TRIG_00830822

Foreground time interval of the image:
-44.296  52.125 (delta_t =  96.421 [sec])
Background time interval of the image:
-220.075 -44.296 (delta_t = 175.779 [sec])
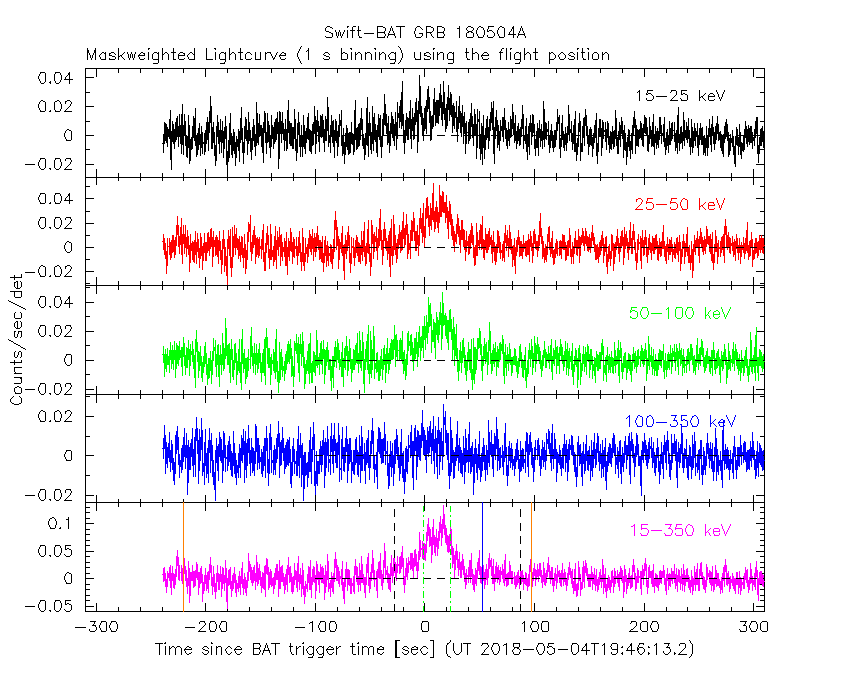
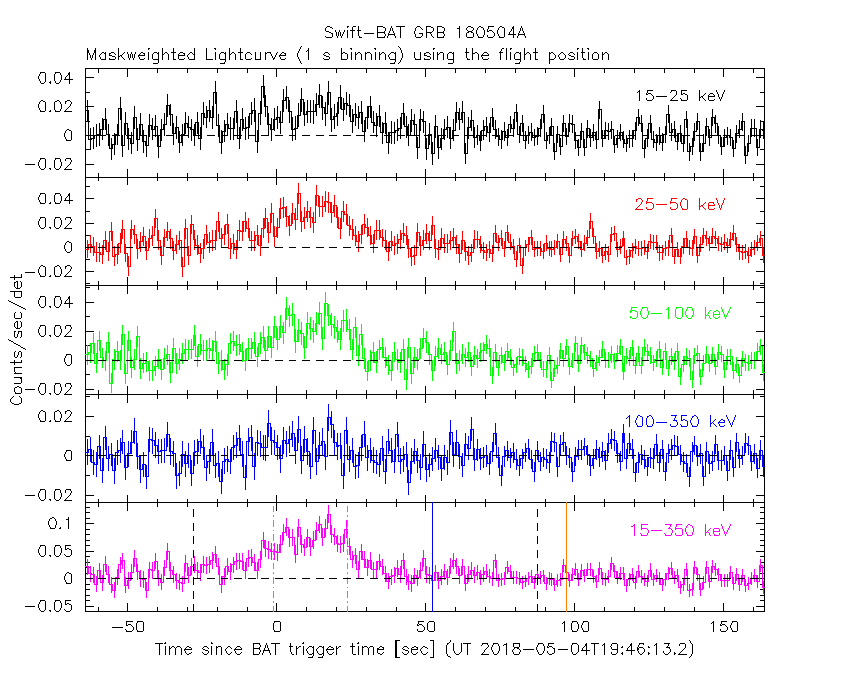
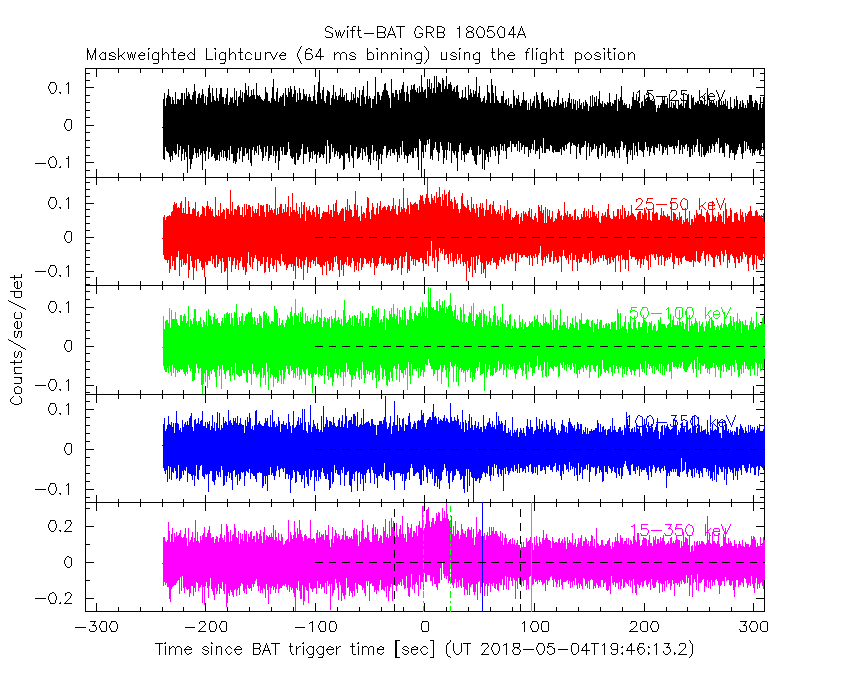
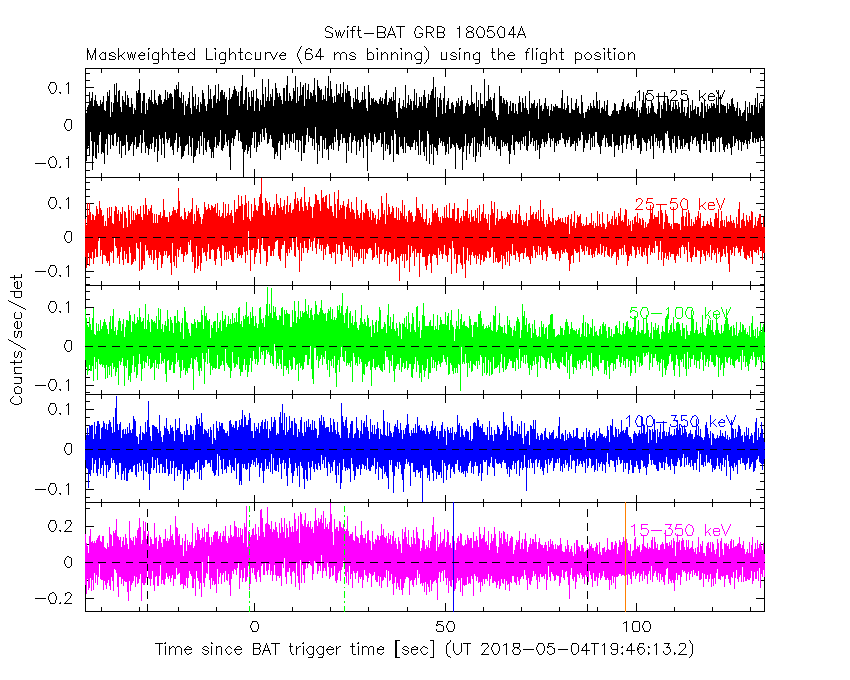
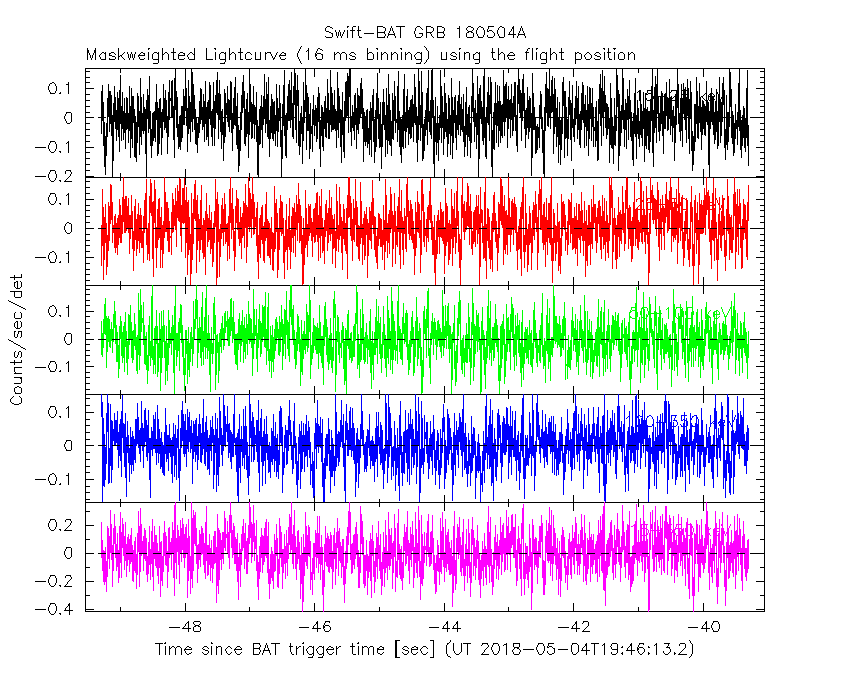
Lightcurves
Notes:
- 1) The mask-weighted light curves are using the flight position.
- 2) Multiple plots of different time binning/intervals are shown to cover all scenarios of short/long GRBs, rate/image triggers, and real/false positives.
- 3) For all the mask-weighted lightcurves, the y-axis units are counts/sec/det where a det is 0.4 x 0.4 = 0.16 sq cm.
- 4) The verticle lines correspond to following: green dotted lines are T50 interval, black dotted lines are T90 interval, blue solid line(s) is a spacecraft slew start time, and orange solid line(s) is a spacecraft slew end time.
- 5) Time of each bin is in the middle of the bin.
1 s binning
From T0-310 s to T0+310 s
From T100_start - 20 s to T100_end + 30 s
Full time interval

64 ms binning
Full time interval
From T100_start to T100_end
From T0-5 sec to T0+5 sec

16 ms binning
From T100_start-5 s to T100_start+5 s
Blue+Cyan dotted lines: Time interval of the scaled map
From 0.000000 to 8.192000
8 ms binning
From T100_start-3 s to T100_start+3 s
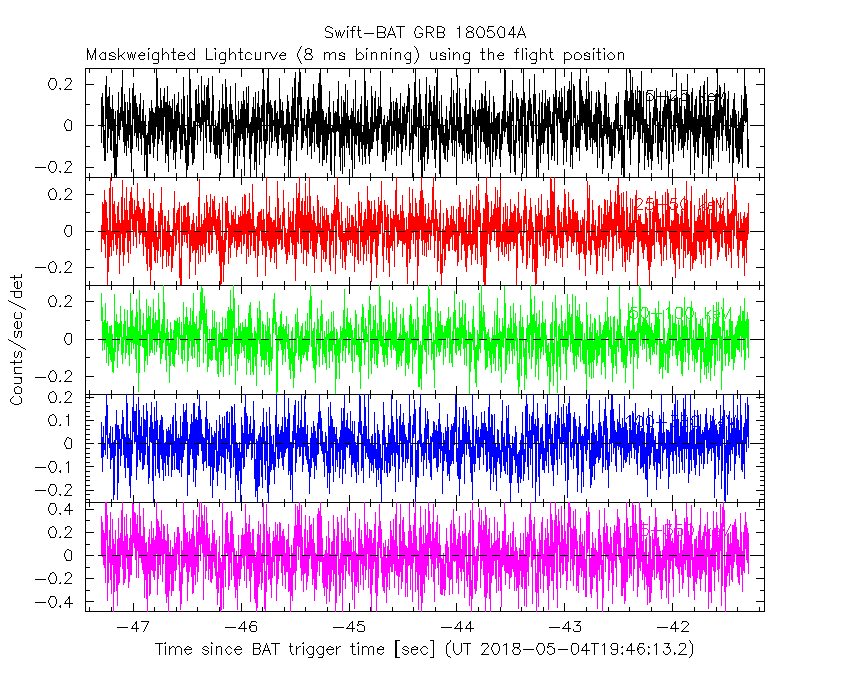
Blue+Cyan dotted lines: Time interval of the scaled map
From 0.000000 to 8.192000
2 ms binning
From T100_start-1 s to T100_start+1 s

Blue+Cyan dotted lines: Time interval of the scaled map
From 0.000000 to 8.192000
SN=5 or 10 sec. binning (whichever binning is satisfied first)

SN=5 or 10 sec. binning (T < 200 sec)

Quad-rate summed light curves (from T0-300s to T0+1000s)

Spectral Evolution

Spectra
Notes:
- 1) The fitting includes the systematic errors.
- 2) When the burst includes telescope slew time periods, the fitting uses an average response file made from multiple 5-s response files through out the slew time plus single time preiod for the non-slew times, and weighted by the total counts in the corresponding time period using addrmf. An average response file is needed becuase a spectral fit using the pre-slew DRM will introduce some errors in both a spectral shape and a normalization if the PHA file contains a lot of the slew/post-slew time interval.
- 3) For fits to more complicated models (e.g. a power-law over a cutoff power-law), the BAT team has decided to require a chi-square improvement of more than 6 for each extra dof.
Time averaged spectrum fit using the average DRM
Power-law model

Time interval is from  -44.296 sec. to  133.688 sec.

Spectral model in power-law:
------------------------------------------------------------
Parameters  : value       lower 90%   higher 90%
Photon index: 1.48944     ( -0.140513   0.141752 )
Norm@50keV  : 1.38660E-03    ( -0.000107983   0.000107372 )
------------------------------------------------------------
#Fit statistic : Chi-Squared =          61.30 using 59 PHA bins.
# Reduced chi-squared =          1.075 for     57 degrees of freedom
# Null hypothesis probability =   3.244203e-01

Photon flux (15-150 keV)    in 178 sec: 0.172619 ( -0.013247  0.013271 ) ph/cm2/s
Energy fluence (15-150 keV)             : 2.34579e-06 ( -2.02455e-07  2.0462e-07 ) ergs/cm2
Cutoff power-law model

Time interval is from  -44.296 sec. to  133.688 sec.
Spectral model in the cutoff power-law:
------------------------------------------------------------
Parameters  : value       lower 90%   higher 90%
Photon index: 1.48939     ( -0.14357   0.139892 )
Epeak [keV] : 9999.22      ( -9999.36 -9999.36 )
Norm@50keV  : 1.38881E-03    ( -0.00139033   0.000795429 )
------------------------------------------------------------
#Fit statistic : Chi-Squared =          61.31 using 59 PHA bins.
# Reduced chi-squared =          1.095 for     56 degrees of freedom
# Null hypothesis probability =   2.913244e-01

Photon flux (15-150 keV)    in 178 sec: 0.173705 (    ) ph/cm2/s
Energy fluence (15-150 keV)             : 2.36793e-06 ( -2.30168e-07  1.79307e-07 ) ergs/cm2
Band function

Time interval is from  -44.296 sec. to  133.688 sec.


Spectral model in the Band function:
------------------------------------------------------------
Parameters  : value       lower 90%   higher 90%
alpha       :    (     )
beta        :     (     )
Epeak [keV] :       (   )
Norm@50keV   :     (     )
------------------------------------------------------------

Photon flux (15-150 keV)    in  sec:  (    ) ph/cm2/s
Energy fluence (15-150 keV)             : 0 ( 0  0 ) ergs/cm2
Single BB

Spectral model blackbody:
------------------------------------------------------------
Parameters  : value    Lower 90%  Upper 90%
kT [keV]    : 14.7067  (-1.49301  1.71935)
R^2/D10^2   : 2.03202E-02  (-0.00651545   0.00930622)
(R is the radius in km and D10 is the distance to the source in units of 10 kpc)
------------------------------------------------------------
#Fit statistic : Chi-Squared =         110.34 using 59 PHA bins.
# Reduced chi-squared =         1.9359 for     57 degrees of freedom
# Null hypothesis probability =   2.909476e-05

Energy  Fluence     90% Error
[keV]   [erg/cm2]   [erg/cm2]
15- 25  1.643e-07   2.372e-08
25- 50  6.409e-07   6.755e-08
50-150  9.349e-07   1.447e-07
15-150  1.740e-06   1.574e-07
Thermal bremsstrahlung (OTTB)

Spectral model: thermal bremsstrahlung
------------------------------------------------------------
Parameters  : value         Lower 90%    Upper 90%
kT [keV]    : 200.000       (-45.9718      -200)
Norm        : 0.701504       (-0.0528533     0.0528533)
------------------------------------------------------------
#Fit statistic : Chi-Squared =          63.67 using 59 PHA bins.
# Reduced chi-squared =          1.117 for     57 degrees of freedom
# Null hypothesis probability =   2.534650e-01

Energy  Fluence     90% Error
[keV]   [erg/cm2]   [erg/cm2]
15- 25  3.119e-07   3.008e-08
25- 50  6.001e-07   8.953e-08
50-150  1.316e-06   4.335e-07
15-150  2.228e-06   5.659e-07
Double BB

Spectral model: bbodyrad<1> + bbodyrad<2>
------------------------------------------------------------
Parameters  : value         Lower 90%    Upper 90%
kT1 [keV]   : 7.74264        (-2.4405      2.31073)
R1^2/D10^2  : 0.135924        (-0.0746608      0.1813)
kT2 [keV]   : 34.1110        (-11.8551      43.7843)
R2^2/D10^2  : 9.32166E-04    (-0.000784915   0.00295593)
------------------------------------------------------------
#Fit statistic : Chi-Squared =          66.23 using 59 PHA bins.
# Reduced chi-squared =          1.204 for     55 degrees of freedom
# Null hypothesis probability =   1.426801e-01

Energy  Fluence     90% Error
[keV]   [erg/cm2]   [erg/cm2]
15- 25  2.835e-07   8.167e-08
25- 50  6.027e-07   1.614e-07
50-150  1.493e-06   7.211e-07
15-150  2.379e-06   8.391e-07
Peak spectrum fit
Power-law model

Time interval is from   16.804 sec. to   17.804 sec.

Spectral model in power-law:
------------------------------------------------------------
Parameters  : value       lower 90%   higher 90%
Photon index: 1.50832     ( -0.435065   0.442896 )
Norm@50keV  : 6.66721E-03    ( -0.00165302   0.0015933 )
------------------------------------------------------------
#Fit statistic : Chi-Squared =          57.79 using 59 PHA bins.
# Reduced chi-squared =          1.014 for     57 degrees of freedom
# Null hypothesis probability =   4.460446e-01

Photon flux (15-150 keV)    in 1 sec: 0.834226 ( -0.190348  0.190624 ) ph/cm2/s
Energy fluence (15-150 keV)             : 6.31713e-08 ( -1.6947e-08  1.74667e-08 ) ergs/cm2
Cutoff power-law model

Time interval is from   16.804 sec. to   17.804 sec.
Spectral model in the cutoff power-law:
------------------------------------------------------------
Parameters  : value       lower 90%   higher 90%
Photon index: 1.52007     ( -1.00746   0.432987 )
Epeak [keV] : 9999.34      ( -9999.36 -9999.36 )
Norm@50keV  : 6.66440E-03    ( -0.00164834   0.0159544 )
------------------------------------------------------------
#Fit statistic : Chi-Squared =          57.79 using 59 PHA bins.
# Reduced chi-squared =          1.032 for     56 degrees of freedom
# Null hypothesis probability =   4.088281e-01

Photon flux (15-150 keV)    in 1 sec: 0.836233 ( -0.194451  0.190297 ) ph/cm2/s
Energy fluence (15-150 keV)             : 3.25904e-08 ( 0  0 ) ergs/cm2
Band function

Time interval is from   16.804 sec. to   17.804 sec.


Spectral model in the Band function:
------------------------------------------------------------
Parameters  : value       lower 90%   higher 90%
alpha       :    (     )
beta        :     (     )
Epeak [keV] :       (   )
Norm@50keV   :     (     )
------------------------------------------------------------

Photon flux (15-150 keV)    in  sec:  (    ) ph/cm2/s
Energy fluence (15-150 keV)             : 0 ( 0  0 ) ergs/cm2
Single BB

Spectral model blackbody:
------------------------------------------------------------
Parameters  : value    Lower 90%  Upper 90%
kT [keV]    : 11.2957  (-3.14236  6.44506)
R^2/D10^2   : 0.243951  (-0.192931   0.562749)
(R is the radius in km and D10 is the distance to the source in units of 10 kpc)
------------------------------------------------------------
#Fit statistic : Chi-Squared =          66.14 using 59 PHA bins.
# Reduced chi-squared =          1.160 for     57 degrees of freedom
# Null hypothesis probability =   1.905944e-01

Energy  Fluence     90% Error
[keV]   [erg/cm2]   [erg/cm2]
15- 25  6.535e-09   3.266e-09
25- 50  1.911e-08   1.116e-08
50-150  1.405e-08   8.203e-09
15-150  3.970e-08   1.553e-08
Thermal bremsstrahlung (OTTB)

Spectral model: thermal bremsstrahlung
------------------------------------------------------------
Parameters  : value         Lower 90%    Upper 90%
kT [keV]    : 199.362       (-125.347      -199.363)
Norm        : 3.38608       (-0.770835     0.771504)
------------------------------------------------------------
#Fit statistic : Chi-Squared =          58.45 using 59 PHA bins.
# Reduced chi-squared =          1.025 for     57 degrees of freedom
# Null hypothesis probability =   4.219554e-01

Energy  Fluence     90% Error
[keV]   [erg/cm2]   [erg/cm2]
15- 25  8.432e-09   4.970e-09
25- 50  1.622e-08   9.550e-09
50-150  3.557e-08   2.077e-08
15-150  6.022e-08   3.554e-08
Double BB

Spectral model: bbodyrad<1> + bbodyrad<2>
------------------------------------------------------------
Parameters  : value         Lower 90%    Upper 90%
kT1 [keV]   : 7.70911        (-2.6188      3.2659)
R1^2/D10^2  : 0.817653        (-0.590364      2.87947)
kT2 [keV]   : 68.6998        (-44.2891      -68.7005)
R2^2/D10^2  : 8.42282E-04    (-0.000761911   0.00692951)
------------------------------------------------------------
#Fit statistic : Chi-Squared =          55.73 using 59 PHA bins.
# Reduced chi-squared =          1.013 for     55 degrees of freedom
# Null hypothesis probability =   4.472944e-01

Energy  Fluence     90% Error
[keV]   [erg/cm2]   [erg/cm2]
15- 25  8.872e-09   5.315e-09
25- 50  1.657e-08   9.650e-09
50-150  4.416e-08   2.267e-08
15-150  6.960e-08   3.467e-08
Pre-slew spectrum (Pre-slew PHA with pre-slew DRM)
Power-law model

Spectral model in power-law:
------------------------------------------------------------
Parameters  : value       lower 90%   higher 90%
Photon index: 1.53065     ( -0.127898   0.129156 )
Norm@50keV  : 2.28471E-03    ( -0.000162509   0.000161541 )
------------------------------------------------------------
#Fit statistic : Chi-Squared =          49.40 using 59 PHA bins.
# Reduced chi-squared =         0.8667 for     57 degrees of freedom
# Null hypothesis probability =   7.525822e-01

Photon flux (15-150 keV)    in 96.42 sec: 0.287637 ( -0.0200347  0.0200742 ) ph/cm2/s
Energy fluence (15-150 keV)             : 2.07975e-06 ( -1.62821e-07  1.64278e-07 ) ergs/cm2
Cutoff power-law model

Spectral model in the cutoff power-law:
------------------------------------------------------------
Parameters  : value       lower 90%   higher 90%
Photon index: 1.53431     ( -0.132484   0.126406 )
Epeak [keV] : 9999.36      ( -9999.36 -9999.36 )
Norm@50keV  : 2.28615E-03    ( -0.00228933   0.00144348 )
------------------------------------------------------------
#Fit statistic : Chi-Squared =          49.41 using 59 PHA bins.
# Reduced chi-squared =         0.8824 for     56 degrees of freedom
# Null hypothesis probability =   7.206947e-01

Photon flux (15-150 keV)    in 96.42 sec: 0.287649 ( -0.020552  0.01994 ) ph/cm2/s
Energy fluence (15-150 keV)             : 2.07169e-06 ( -1.69468e-07  1.74038e-07 ) ergs/cm2
Band function

Spectral model in the Band function:
------------------------------------------------------------
Parameters  : value       lower 90%   higher 90%
alpha       :    (     )
beta        :     (     )
Epeak [keV] :       (   )
Norm@50keV   :     (     )
------------------------------------------------------------

Photon flux (15-150 keV)    in  sec:  (    ) ph/cm2/s
Energy fluence (15-150 keV)             : 0 ( 0  0 ) ergs/cm2
S(25-50 keV) vs. S(50-100 keV) plot

S(25-50 keV)  = 5.77e-07
S(50-100 keV) = 8.22e-07
T90 vs. Hardness ratio plot

T90                                   = 115.263999819756 sec.
Hardness ratio (energy fluence ratio) = 1.42461
Color vs. Color plot

Count Ratio  (25-50 keV) / (15-25 keV) = 1.21459
Count Ratio (50-100 keV) / (15-25 keV) = 0.930136
Mask shadow pattern

IMX = 1.160035673997685E-01, IMY = -4.224173148142144E-01
TIME vs. PHA plot around the trigger time

Blue+Cyan dotted lines: Time interval of the scaled map
From 0.000000 to 8.192000
TIME vs. DetID plot around the trigger time
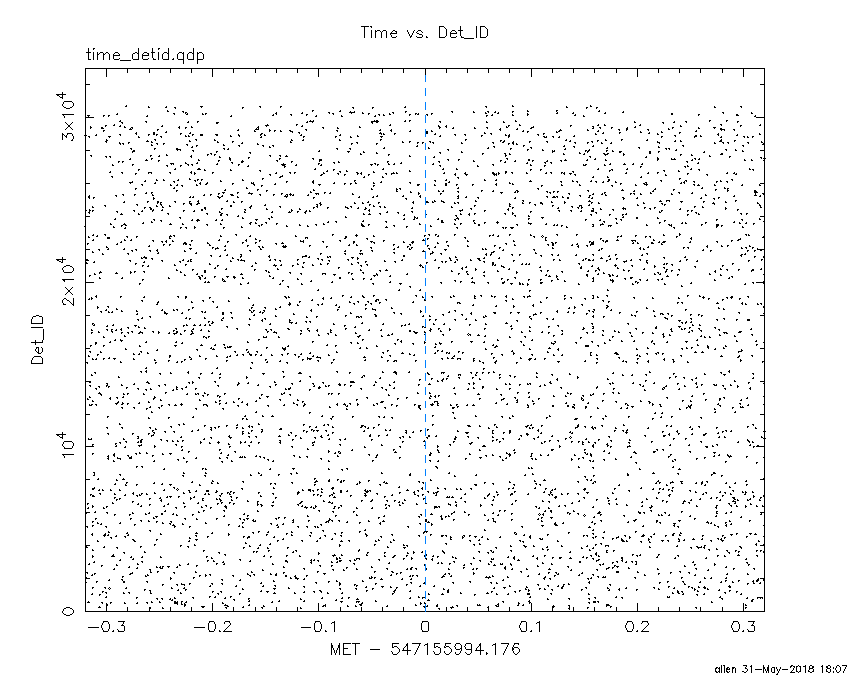
Blue+Cyan dotted lines: Time interval of the scaled map
From 0.000000 to 8.192000
100 us light curve (15-350 keV)

Blue+Cyan dotted lines: Time interval of the scaled map
From 0.000000 to 8.192000
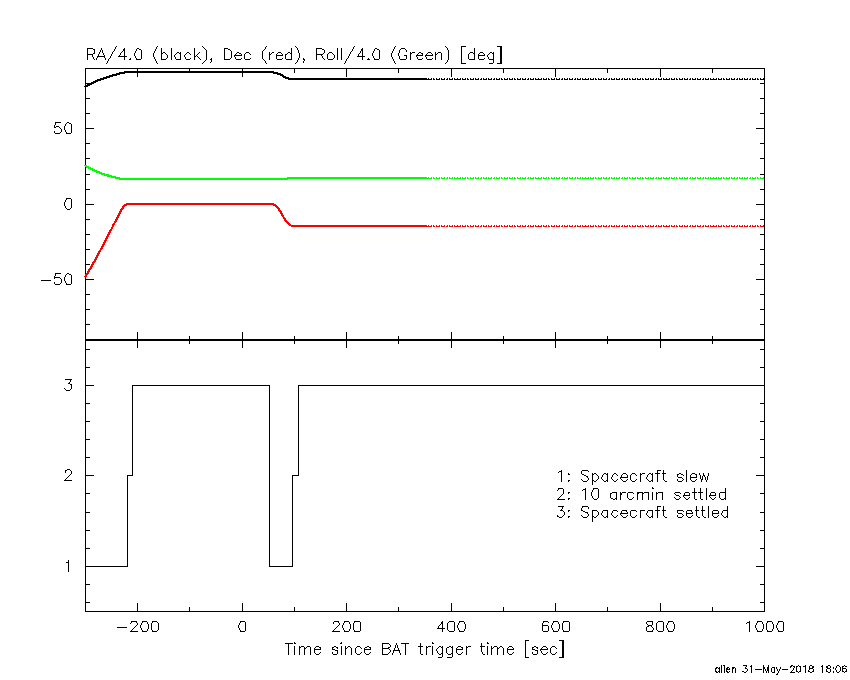
Spacecraft aspect plot
Bright source in the pre-burst/pre-slew/post-slew images
Pre-burst image of 15-350 keV band
Time interval of the image:
-220.075400 -44.296000

# RAcent  DECcent POSerr Theta    Phi  PeakCts   SNR AngSep     Name
#  [deg]    [deg]    ['] [deg]  [deg]                   [']
308.1078  40.9258   16.7  55.4  166.8   0.6994   0.7    1.6	Cyg X-3
326.1568  38.1342    0.0  43.7  177.3   0.8332   2.3   11.3	Cyg X-2
342.9932  17.0357    3.1  18.1 -176.8   0.6328   3.6 ------	UNKNOWN
 15.0478  19.5156    3.5  31.4 -105.0   1.0431   3.3 ------	UNKNOWN
 16.2237  41.8213    2.6  48.0 -129.0   3.9798   4.5 ------	UNKNOWN
Pre-slew background subtracted image of 15-350 keV band
Time interval of the image:
-44.296000 52.124600

# RAcent  DECcent POSerr Theta    Phi  PeakCts   SNR AngSep     Name
#  [deg]    [deg]    ['] [deg]  [deg]                   [']
308.0439  40.8624    4.3  55.5  166.7  -2.0448  -2.7    6.2	Cyg X-3
326.2428  38.4372   12.2  43.9  177.6   0.2401   1.0    7.7	Cyg X-2
319.7030   2.3227    2.4  30.1  118.7   1.0191   4.7 ------	UNKNOWN
331.1428 -14.6666    0.6  23.7   74.6   3.4971  19.5 ------	UNKNOWN
 18.5058 -26.7269    2.4  38.6  -19.1   0.9326   4.9 ------	UNKNOWN
Post-slew image of 15-350 keV band
Time interval of the image:
97.124600 719.454800
720.824000 962.944000

# RAcent  DECcent POSerr Theta    Phi  PeakCts   SNR AngSep     Name
#  [deg]    [deg]    ['] [deg]  [deg]                   [']
288.8408  10.9666    4.1  49.1  140.3   8.7765   2.8    2.8	GRS 1915+105
326.3249  38.2971    7.4  53.1 -163.5   3.0522   1.6    7.4	Cyg X-2
288.6205 -19.4607    4.4  40.8   98.3   6.6147   2.6 ------	UNKNOWN
288.9193 -16.5719    2.6  40.6  102.7  10.4037   4.4 ------	UNKNOWN
303.5025 -39.4834    3.7  34.7   60.2   3.2807   3.1 ------	UNKNOWN
341.5859 -69.7894    3.3  55.5   16.9  10.6694   3.5 ------	UNKNOWN
351.4508 -62.4560    2.9  49.9    9.1   5.2569   4.0 ------	UNKNOWN
343.6970  33.9262    3.7  50.0 -145.2   7.1421   3.1 ------	UNKNOWN
355.5322  27.1159    3.8  48.0 -129.2   9.4685   3.1 ------	UNKNOWN
Plot creation:
Thu May 31 18:07:29 EDT 2018