Estimated redshift from machine learning (Ukwatta et al. 2016) - may take a few minute to calcaulte
Image
Pre-slew 15.0-350.0 keV image (Event data)
#   RAcent    DECcent   POSerr    Theta     Phi              Peak Cts       SNR   Name
  276.3386   -31.9180   0.0051    34.4327    45.0793         6.0965620     37.739 TRIG_00831810

Foreground time interval of the image:
-15.232  11.069 (delta_t =  26.301 [sec])
Background time interval of the image:
-239.232 -15.232 (delta_t = 224.000 [sec])
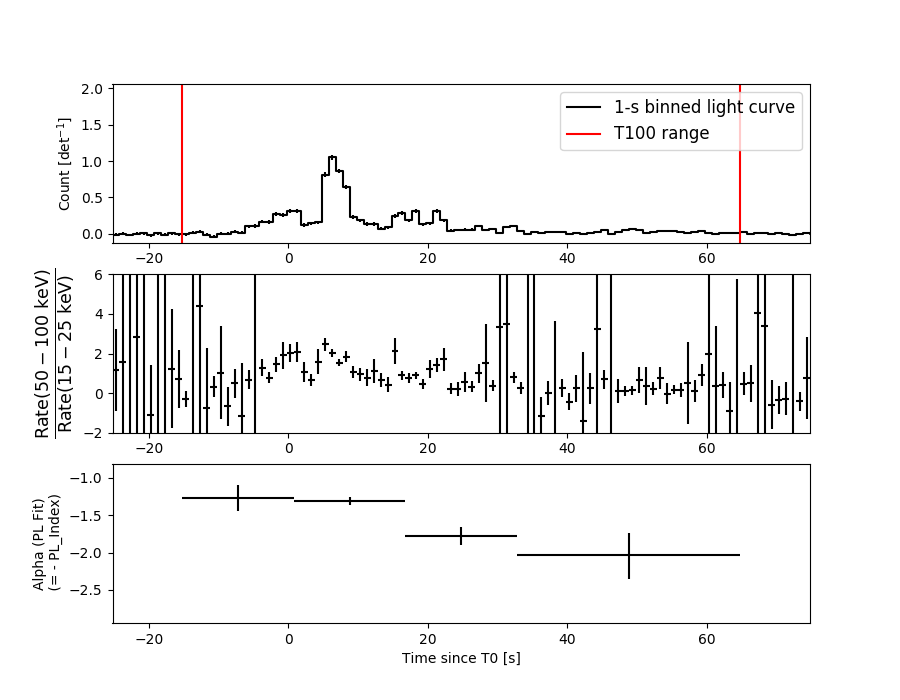
Lightcurves
Notes:
- 1) The mask-weighted light curves are using the flight position.
- 2) Multiple plots of different time binning/intervals are shown to cover all scenarios of short/long GRBs, rate/image triggers, and real/false positives.
- 3) For all the mask-weighted lightcurves, the y-axis units are counts/sec/det where a det is 0.4 x 0.4 = 0.16 sq cm.
- 4) The verticle lines correspond to following: green dotted lines are T50 interval, black dotted lines are T90 interval, blue solid line(s) is a spacecraft slew start time, and orange solid line(s) is a spacecraft slew end time.
- 5) Time of each bin is in the middle of the bin.
1 s binning
From T0-310 s to T0+310 s

From T100_start - 20 s to T100_end + 30 s

Full time interval

64 ms binning
Full time interval

From T100_start to T100_end

From T0-5 sec to T0+5 sec
16 ms binning
From T100_start-5 s to T100_start+5 s

Blue+Cyan dotted lines: Time interval of the scaled map
From 0.000000 to 1.024000
8 ms binning
From T100_start-3 s to T100_start+3 s

Blue+Cyan dotted lines: Time interval of the scaled map
From 0.000000 to 1.024000
2 ms binning
From T100_start-1 s to T100_start+1 s

Blue+Cyan dotted lines: Time interval of the scaled map
From 0.000000 to 1.024000
SN=5 or 10 sec. binning (whichever binning is satisfied first)

SN=5 or 10 sec. binning (T < 200 sec)

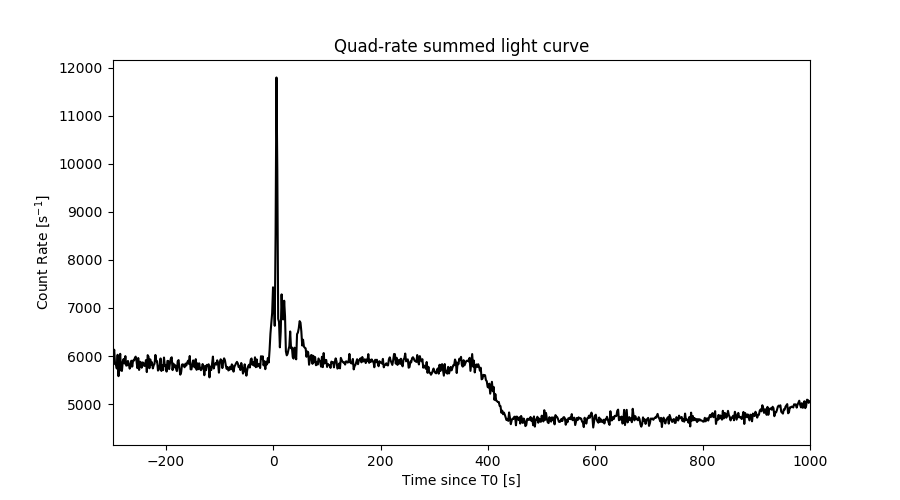
Quad-rate summed light curves (from T0-300s to T0+1000s)
Spectral Evolution
Spectra
Notes:
- 1) The fitting includes the systematic errors.
- 2) When the burst includes telescope slew time periods, the fitting uses an average response file made from multiple 5-s response files through out the slew time plus single time preiod for the non-slew times, and weighted by the total counts in the corresponding time period using addrmf. An average response file is needed becuase a spectral fit using the pre-slew DRM will introduce some errors in both a spectral shape and a normalization if the PHA file contains a lot of the slew/post-slew time interval.
- 3) For fits to more complicated models (e.g. a power-law over a cutoff power-law), the BAT team has decided to require a chi-square improvement of more than 6 for each extra dof.
Time averaged spectrum fit using the average DRM
Power-law model

Time interval is from  -15.232 sec. to   64.768 sec.

Spectral model in power-law:
------------------------------------------------------------
Parameters  : value       lower 90%   higher 90%
Photon index: 1.45827     ( -0.0575992   0.0575513 )
Norm@50keV  : 8.27748E-03    ( -0.000264413   0.00026441 )
------------------------------------------------------------
#Fit statistic : Chi-Squared =          65.36 using 59 PHA bins.
# Reduced chi-squared =          1.147 for     57 degrees of freedom
# Null hypothesis probability =   2.091905e-01

Photon flux (15-150 keV)    in 80 sec: 1.02222 ( -0.036004  0.03611 ) ph/cm2/s
Energy fluence (15-150 keV)             : 6.32805e-06 ( -2.1145e-07  2.11685e-07 ) ergs/cm2
Cutoff power-law model

Time interval is from  -15.232 sec. to   64.768 sec.
Spectral model in the cutoff power-law:
------------------------------------------------------------
Parameters  : value       lower 90%   higher 90%
Photon index: 1.03482     ( -0.246729   0.234054 )
Epeak [keV] : 127.708      ( -27.4131 84.3873 )
Norm@50keV  : 1.28618E-02    ( -0.002713   0.00364041 )
------------------------------------------------------------
#Fit statistic : Chi-Squared =          55.44 using 59 PHA bins.
# Reduced chi-squared =         0.9899 for     56 degrees of freedom
# Null hypothesis probability =   4.961602e-01

Photon flux (15-150 keV)    in 80 sec: 0.994243 ( -0.03874  0.038947 ) ph/cm2/s
Energy fluence (15-150 keV)             : 6.18842e-06 ( -2.26589e-07  2.26034e-07 ) ergs/cm2
Band function

Time interval is from  -15.232 sec. to   64.768 sec.


Spectral model in the Band function:
------------------------------------------------------------
Parameters  : value       lower 90%   higher 90%
alpha       :    (     )
beta        :     (     )
Epeak [keV] :       (   )
Norm@50keV   :     (     )
------------------------------------------------------------

Photon flux (15-150 keV)    in  sec:  (    ) ph/cm2/s
Energy fluence (15-150 keV)             : 0 ( 0  0 ) ergs/cm2
Single BB

Spectral model blackbody:
------------------------------------------------------------
Parameters  : value    Lower 90%  Upper 90%
kT [keV]    : 17.6690  (  )
R^2/D10^2   : 6.54284E-02  (   )
(R is the radius in km and D10 is the distance to the source in units of 10 kpc)
------------------------------------------------------------
#Fit statistic : Chi-Squared =         225.85 using 59 PHA bins.
# Reduced chi-squared =         3.9622 for     57 degrees of freedom
# Null hypothesis probability =   5.896518e-22

Energy  Fluence     90% Error
[keV]   [erg/cm2]   [erg/cm2]
15- 25  3.291e-07   2.204e-08
25- 50  1.501e-06   7.360e-08
50-150  3.384e-06   1.820e-07
15-150  5.214e-06   1.880e-07
Thermal bremsstrahlung (OTTB)

Spectral model: thermal bremsstrahlung
------------------------------------------------------------
Parameters  : value         Lower 90%    Upper 90%
kT [keV]    : 200.000       (-8.72854      -200)
Norm        : 4.24974       (-0.135856     0.135856)
------------------------------------------------------------
#Fit statistic : Chi-Squared =          69.84 using 59 PHA bins.
# Reduced chi-squared =          1.225 for     57 degrees of freedom
# Null hypothesis probability =   1.182118e-01

Energy  Fluence     90% Error
[keV]   [erg/cm2]   [erg/cm2]
15- 25  8.468e-07   3.120e-08
25- 50  1.629e-06   5.960e-08
50-150  3.573e-06   1.340e-07
15-150  6.048e-06   2.364e-07
Double BB

Spectral model: bbodyrad<1> + bbodyrad<2>
------------------------------------------------------------
Parameters  : value         Lower 90%    Upper 90%
kT1 [keV]   : 6.74685        (-0.867816      0.991732)
R1^2/D10^2  : 1.03549        (-0.392163      0.691908)
kT2 [keV]   : 25.1640        (-2.03075      2.64579)
R2^2/D10^2  : 1.61371E-02    (-0.00506563   0.00605683)
------------------------------------------------------------
#Fit statistic : Chi-Squared =          54.76 using 59 PHA bins.
# Reduced chi-squared =         0.9957 for     55 degrees of freedom
# Null hypothesis probability =   4.836415e-01

Energy  Fluence     90% Error
[keV]   [erg/cm2]   [erg/cm2]
15- 25  7.236e-07   8.632e-08
25- 50  1.547e-06   1.232e-07
50-150  3.886e-06   2.888e-07
15-150  6.157e-06   3.752e-07
Peak spectrum fit
Power-law model
Time interval is from    8.268 sec. to    9.268 sec.

Spectral model in power-law:
------------------------------------------------------------
Parameters  : value       lower 90%   higher 90%
Photon index: 1.21583     ( -0.185889   0.183058 )
Norm@50keV  : 2.87879E-02    ( -0.00300973   0.00299931 )
------------------------------------------------------------
#Fit statistic : Chi-Squared =          51.23 using 59 PHA bins.
# Reduced chi-squared =         0.8987 for     57 degrees of freedom
# Null hypothesis probability =   6.904280e-01

Photon flux (15-150 keV)    in 1 sec: 3.38686 ( -0.37412  0.37529 ) ph/cm2/s
Energy fluence (15-150 keV)             : 2.9081e-07 ( -3.21257e-08  3.21956e-08 ) ergs/cm2
Cutoff power-law model

Time interval is from    8.268 sec. to    9.268 sec.
Spectral model in the cutoff power-law:
------------------------------------------------------------
Parameters  : value       lower 90%   higher 90%
Photon index: 1.21137     ( -0.496946   0.22433 )
Epeak [keV] : 1.00000E+04      ( -10000 -10000 )
Norm@50keV  : 2.89240E-02    (     )
------------------------------------------------------------
#Fit statistic : Chi-Squared =          51.24 using 59 PHA bins.
# Reduced chi-squared =         0.9150 for     56 degrees of freedom
# Null hypothesis probability =   6.553400e-01

Photon flux (15-150 keV)    in 1 sec: 3.39810 (    ) ph/cm2/s
Energy fluence (15-150 keV)             : 2.90743e-07 ( 0  0 ) ergs/cm2
Band function

Time interval is from    8.268 sec. to    9.268 sec.


Spectral model in the Band function:
------------------------------------------------------------
Parameters  : value       lower 90%   higher 90%
alpha       :    (     )
beta        :     (     )
Epeak [keV] :       (   )
Norm@50keV   :     (     )
------------------------------------------------------------

Photon flux (15-150 keV)    in  sec:  (    ) ph/cm2/s
Energy fluence (15-150 keV)             : 0 ( 0  0 ) ergs/cm2
Single BB

Spectral model blackbody:
------------------------------------------------------------
Parameters  : value    Lower 90%  Upper 90%
kT [keV]    : 21.1379  (-3.12438  3.81014)
R^2/D10^2   : 0.127990  (-0.0531394   0.0890534)
(R is the radius in km and D10 is the distance to the source in units of 10 kpc)
------------------------------------------------------------
#Fit statistic : Chi-Squared =          80.37 using 59 PHA bins.
# Reduced chi-squared =          1.410 for     57 degrees of freedom
# Null hypothesis probability =   2.239894e-02

Energy  Fluence     90% Error
[keV]   [erg/cm2]   [erg/cm2]
15- 25  1.077e-08   2.212e-09
25- 50  5.561e-08   9.450e-09
50-150  1.853e-07   3.285e-08
15-150  2.517e-07   3.365e-08
Thermal bremsstrahlung (OTTB)
Spectral model: thermal bremsstrahlung
------------------------------------------------------------
Parameters  : value         Lower 90%    Upper 90%
kT [keV]    : 200.000       (-27.22      -200)
Norm        : 14.2713       (-1.51359     1.51359)
------------------------------------------------------------
#Fit statistic : Chi-Squared =          62.76 using 59 PHA bins.
# Reduced chi-squared =          1.101 for     57 degrees of freedom
# Null hypothesis probability =   2.796314e-01

Energy  Fluence     90% Error
[keV]   [erg/cm2]   [erg/cm2]
15- 25  3.555e-08   1.073e-08
25- 50  6.838e-08   3.415e-08
50-150  1.500e-07   8.248e-08
15-150  2.539e-07   1.307e-07
Double BB

Spectral model: bbodyrad<1> + bbodyrad<2>
------------------------------------------------------------
Parameters  : value         Lower 90%    Upper 90%
kT1 [keV]   : 8.31549        (-2.22943      2.69524)
R1^2/D10^2  : 1.86037        (-1.10588      3.56266)
kT2 [keV]   : 40.5185        (-11.4652      36.3111)
R2^2/D10^2  : 1.37635E-02    (-0.0110402   0.0255125)
------------------------------------------------------------
#Fit statistic : Chi-Squared =          50.24 using 59 PHA bins.
# Reduced chi-squared =         0.9135 for     55 degrees of freedom
# Null hypothesis probability =   6.566716e-01

Energy  Fluence     90% Error
[keV]   [erg/cm2]   [erg/cm2]
15- 25  2.679e-08   1.256e-08
25- 50  6.447e-08   2.878e-08
50-150  2.054e-07   1.065e-07
15-150  2.966e-07   1.323e-07
Pre-slew spectrum (Pre-slew PHA with pre-slew DRM)
Power-law model

Spectral model in power-law:
------------------------------------------------------------
Parameters  : value       lower 90%   higher 90%
Photon index: 1.23634     ( -0.0622111   0.0617721 )
Norm@50keV  : 1.60907E-02    ( -0.000572127   0.00057151 )
------------------------------------------------------------
#Fit statistic : Chi-Squared =          54.74 using 59 PHA bins.
# Reduced chi-squared =         0.9603 for     57 degrees of freedom
# Null hypothesis probability =   5.603700e-01

Photon flux (15-150 keV)    in 26.3 sec: 1.89895 ( -0.0728768  0.0730613 ) ph/cm2/s
Energy fluence (15-150 keV)             : 4.25063e-06 ( -1.55179e-07  1.55314e-07 ) ergs/cm2
Cutoff power-law model

Spectral model in the cutoff power-law:
------------------------------------------------------------
Parameters  : value       lower 90%   higher 90%
Photon index: 0.883389     ( -0.263593   0.248715 )
Epeak [keV] : 185.176      ( -54.5167 273.137 )
Norm@50keV  : 2.29384E-02    ( -0.00495529   0.00669596 )
------------------------------------------------------------
#Fit statistic : Chi-Squared =          48.75 using 59 PHA bins.
# Reduced chi-squared =         0.8705 for     56 degrees of freedom
# Null hypothesis probability =   7.433372e-01

Photon flux (15-150 keV)    in 26.3 sec: 1.86326 ( -0.07661  0.07691 ) ph/cm2/s
Energy fluence (15-150 keV)             : 4.19535e-06 ( -1.62429e-07  1.61587e-07 ) ergs/cm2
Band function

Spectral model in the Band function:
------------------------------------------------------------
Parameters  : value       lower 90%   higher 90%
alpha       :    (     )
beta        :     (     )
Epeak [keV] :       (   )
Norm@50keV   :     (     )
------------------------------------------------------------

Photon flux (15-150 keV)    in  sec:  (    ) ph/cm2/s
Energy fluence (15-150 keV)             : 0 ( 0  0 ) ergs/cm2
S(25-50 keV) vs. S(50-100 keV) plot

S(25-50 keV)  = 1.54e-06
S(50-100 keV) = 2.23e-06
T90 vs. Hardness ratio plot

T90                                   = 64 sec.
Hardness ratio (energy fluence ratio) = 1.44805
Color vs. Color plot

Count Ratio  (25-50 keV) / (15-25 keV) = 1.49407
Count Ratio (50-100 keV) / (15-25 keV) = 1.29109
Mask shadow pattern

IMX = 4.840881543379221E-01, IMY = -4.854305873561023E-01
TIME vs. PHA plot around the trigger time

Blue+Cyan dotted lines: Time interval of the scaled map
From 0.000000 to 1.024000
TIME vs. DetID plot around the trigger time

Blue+Cyan dotted lines: Time interval of the scaled map
From 0.000000 to 1.024000
100 us light curve (15-350 keV)

Blue+Cyan dotted lines: Time interval of the scaled map
From 0.000000 to 1.024000
Spacecraft aspect plot

Bright source in the pre-burst/pre-slew/post-slew images
Pre-burst image of 15-350 keV band
Time interval of the image:
-239.232000 -15.232000

# RAcent  DECcent POSerr Theta    Phi  PeakCts   SNR AngSep     Name
#  [deg]    [deg]    ['] [deg]  [deg]                   [']
254.2724  35.3568   15.0  44.6  174.3  -0.4836  -0.8    9.1	Her X-1
263.0691 -24.7370    3.5  34.0   69.6  -1.8356  -3.3    3.3	GX 1+4
268.2090  -1.4760   11.2  17.5  111.9  -0.3750  -1.0    9.6	SW J1753.5-0127
270.2309 -24.9527   11.7  30.2   59.6   0.4431   1.0    8.1	GX 5-1
270.4290 -25.8400    4.3  30.9   58.4   1.2086   2.7    9.0	GRS 1758-258
274.0398 -14.0424    2.2  19.2   67.2   1.7357   5.2    2.0	GX 17+2
276.1233 -30.3727   11.6  33.0   46.2   0.4832   1.0   10.3	H1820-303
285.0851 -24.9337    8.5  26.3   32.1   0.4727   1.4    2.8	HT1900.1-2455
288.7969  10.9290    1.1  10.1 -129.7   2.8343  10.3    1.0	GRS 1915+105
299.6188  35.2485    3.8  36.3 -129.0   1.5159   3.0    3.1	Cyg X-1
308.0875  40.8999    5.8  44.5 -124.2   2.7613   2.0    3.3	Cyg X-3
262.9420 -33.9756   10.5  41.2   60.1  -1.1630  -1.1    8.8	GX 354-0
239.1378  36.0054    2.2  55.1  165.7   9.4739   5.1 ------	UNKNOWN
275.0850   7.1789    0.2  11.9  150.7  22.5689  76.9 ------	UNKNOWN
310.5032  -3.9349    2.8  25.6  -46.6   1.4012   4.1 ------	UNKNOWN
272.6419  56.9080    2.7  56.4 -157.1   8.1327   4.2 ------	UNKNOWN
306.5206  45.7213    2.4  48.0 -129.0   7.3656   4.9 ------	UNKNOWN
Pre-slew background subtracted image of 15-350 keV band
Time interval of the image:
-15.232000 11.068590

# RAcent  DECcent POSerr Theta    Phi  PeakCts   SNR AngSep     Name
#  [deg]    [deg]    ['] [deg]  [deg]                   [']
254.4680  35.2667    7.0  44.5  174.4   0.2788   1.6    4.6	Her X-1
262.9289 -24.9144    0.0  34.2   69.5  -0.2343  -1.2   11.0	GX 1+4
268.3486  -1.4579    9.7  17.4  111.9   0.1235   1.2    1.2	SW J1753.5-0127
270.0583 -25.0233    0.0  30.4   59.8   0.2405   1.7   12.7	GX 5-1
270.1462 -25.6582    4.6  30.9   59.0   0.3545   2.5    9.9	GRS 1758-258
273.7952 -13.9858    0.0  19.3   67.8  -0.0475  -0.4   12.6	GX 17+2
275.8630 -30.5368    4.2  33.2   46.5   0.4374   2.7   10.7	H1820-303
285.1028 -24.7620   11.5  26.2   32.1  -0.1021  -1.0   10.2	HT1900.1-2455
288.8810  11.0989   15.3  10.3 -129.6  -0.0582  -0.8   10.4	GRS 1915+105
299.5936  35.1988   24.6  36.3 -129.0   0.0624   0.5    0.2	Cyg X-1
308.3035  40.8610   10.1  44.5 -124.0   0.3672   1.1   10.3	Cyg X-3
263.2298 -33.8916    7.2  41.0   59.9  -0.5293  -1.6   12.5	GX 354-0
276.3386 -31.9180    0.3  34.4   45.1   6.0967  37.6 ------	UNKNOWN
319.8216 -28.1196    2.3  44.2  -14.2   0.6879   5.0 ------	UNKNOWN
320.7015 -23.8997    2.1  42.6  -20.0   0.7171   5.4 ------	UNKNOWN
Post-slew image of 15-350 keV band
Time interval of the image:
76.868590 323.268600

# RAcent  DECcent POSerr Theta    Phi  PeakCts   SNR AngSep     Name
#  [deg]    [deg]    ['] [deg]  [deg]                   [']
244.9769 -15.6454    0.5  32.8  106.7  15.7815  23.0    0.3	Sco X-1
255.9501 -37.8602    1.0  17.7   59.0   3.5919  11.0    2.0	4U 1700-377
256.4351 -36.4299    5.2  17.0   63.5   0.7315   2.3    0.4	GX 349+2
263.0398 -24.7067   24.5  13.7  112.7   0.1783   0.5    2.9	GX 1+4
264.5383 -44.4364    7.0  15.5   27.2   0.5599   1.6    8.8	4U 1735-44
268.3188  -1.3545   12.8  31.5  158.9  -0.4401  -0.9    6.6	SW J1753.5-0127
270.3196 -25.0793    2.3   8.6  135.3   1.8923   5.1    1.9	GX 5-1
270.3090 -25.8378    7.0   8.0  132.0   0.5982   1.6    5.7	GRS 1758-258
273.8555 -14.0493    4.0  18.0  166.6   0.9932   2.9    8.8	GX 17+2
275.8075 -30.2057   10.8   1.8  160.3   0.3693   1.1   11.4	H1820-303
285.1972 -25.0744    0.0  10.4 -134.7   0.6199   1.7   12.7	HT1900.1-2455
288.7523  10.9541    2.5  44.5 -168.1   2.8592   4.7    2.8	GRS 1915+105
263.1629 -33.7173    5.3  11.2   71.5   0.7487   2.2   11.2	GX 354-0
275.0765   7.1881    0.3  39.1  172.4  23.8448  44.1 ------	UNKNOWN
183.2047 -86.8680    2.4  58.3   -2.0   9.0636   4.9 ------	UNKNOWN
287.7530  14.2432    2.5  47.4 -170.6   3.1365   4.6 ------	UNKNOWN
304.3883   2.7900    3.2  43.8 -142.9   2.5230   3.7 ------	UNKNOWN
336.8617 -61.4778    3.9  48.4  -39.5   3.8989   3.0 ------	UNKNOWN
314.6948  -0.3046    4.3  48.1 -129.1   5.7508   2.7 ------	UNKNOWN
Plot creation:
Thu May 31 18:06:07 EDT 2018