Special notes of this burst
Image
Pre-slew 15.0-350.0 keV image (Event data)
#   RAcent    DECcent   POSerr    Theta     Phi              Peak Cts       SNR   Name
  201.9396    21.4043   0.0162    34.1447    10.3286         0.9422493     11.893 TRIG_00832119

Foreground time interval of the image:
 29.000  55.000 (delta_t =  26.000 [sec])
Background time interval of the image:
-239.000  29.000 (delta_t = 268.000 [sec])
Lightcurves
Notes:
- 1) The mask-weighted light curves are using the flight position.
- 2) Multiple plots of different time binning/intervals are shown to cover all scenarios of short/long GRBs, rate/image triggers, and real/false positives.
- 3) For all the mask-weighted lightcurves, the y-axis units are counts/sec/det where a det is 0.4 x 0.4 = 0.16 sq cm.
- 4) The verticle lines correspond to following: green dotted lines are T50 interval, black dotted lines are T90 interval, blue solid line(s) is a spacecraft slew start time, and orange solid line(s) is a spacecraft slew end time.
- 5) Time of each bin is in the middle of the bin.
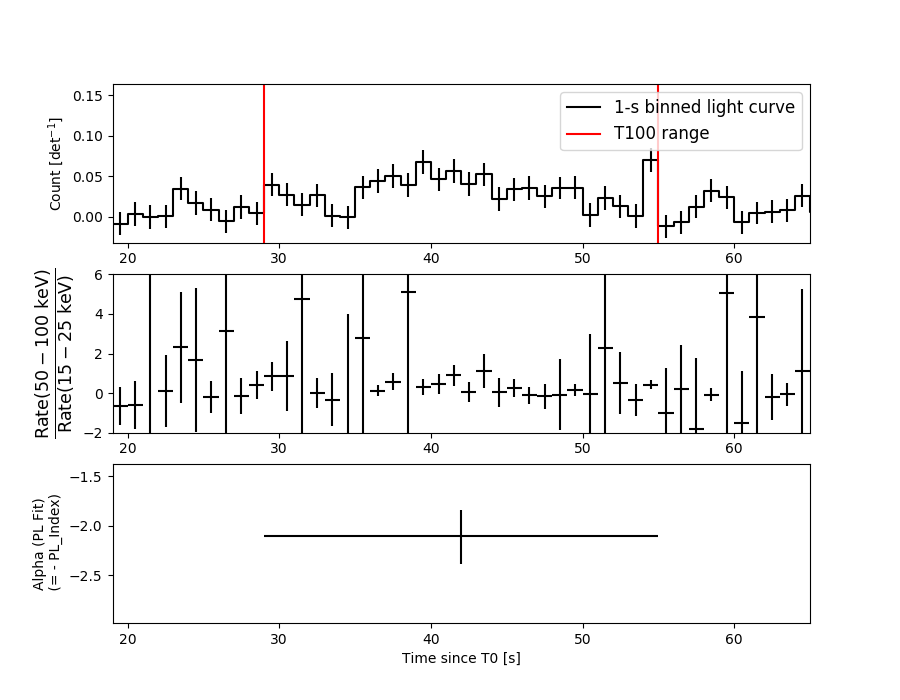
1 s binning
From T0-310 s to T0+310 s
From T100_start - 20 s to T100_end + 30 s
Full time interval
64 ms binning
Full time interval
From T100_start to T100_end
From T0-5 sec to T0+5 sec

16 ms binning
From T100_start-5 s to T100_start+5 s
8 ms binning
From T100_start-3 s to T100_start+3 s
2 ms binning
From T100_start-1 s to T100_start+1 s
SN=5 or 10 sec. binning (whichever binning is satisfied first)
SN=5 or 10 sec. binning (T < 200 sec)
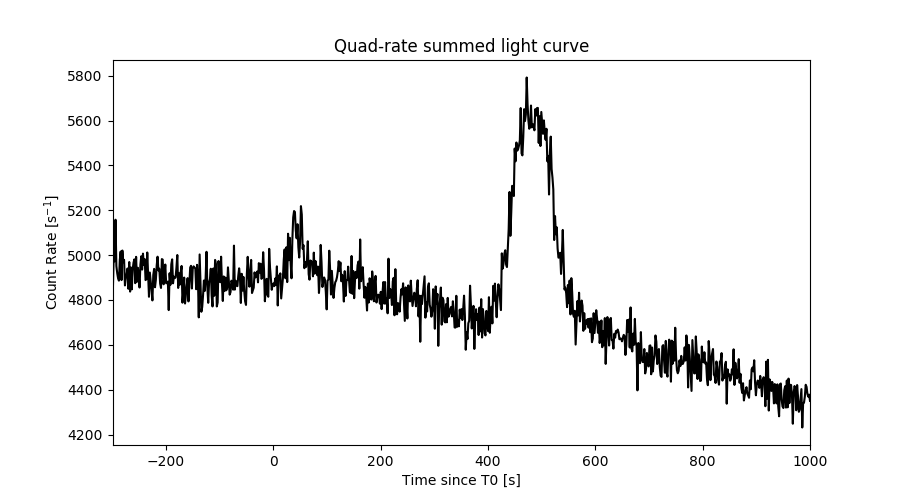
Quad-rate summed light curves (from T0-300s to T0+1000s)
Spectral Evolution
Spectra
Notes:
- 1) The fitting includes the systematic errors.
- 2) When the burst includes telescope slew time periods, the fitting uses an average response file made from multiple 5-s response files through out the slew time plus single time preiod for the non-slew times, and weighted by the total counts in the corresponding time period using addrmf. An average response file is needed becuase a spectral fit using the pre-slew DRM will introduce some errors in both a spectral shape and a normalization if the PHA file contains a lot of the slew/post-slew time interval.
- 3) For fits to more complicated models (e.g. a power-law over a cutoff power-law), the BAT team has decided to require a chi-square improvement of more than 6 for each extra dof.
Time averaged spectrum fit using the average DRM
Power-law model
Time interval is from   29.000 sec. to   55.000 sec.

Spectral model in power-law:
------------------------------------------------------------
Parameters  : value       lower 90%   higher 90%
Photon index: 2.10065     ( -0.261723   0.283929 )
Norm@50keV  : 1.75668E-03    ( -0.00034457   0.000335489 )
------------------------------------------------------------
#Fit statistic : Chi-Squared =          54.88 using 59 PHA bins.
# Reduced chi-squared =         0.9628 for     57 degrees of freedom
# Null hypothesis probability =   5.551419e-01

Photon flux (15-150 keV)    in 26 sec: 0.276483 ( -0.038983  0.038983 ) ph/cm2/s
Energy fluence (15-150 keV)             : 4.24466e-07 ( -7.35899e-08  7.61602e-08 ) ergs/cm2
Cutoff power-law model
Time interval is from   29.000 sec. to   55.000 sec.
Spectral model in the cutoff power-law:
------------------------------------------------------------
Parameters  : value       lower 90%   higher 90%
Photon index: 1.36653     ( -2.28795   0.709577 )
Epeak [keV] : 31.6550      (   )
Norm@50keV  : 5.08059E-03    (     )
------------------------------------------------------------
#Fit statistic : Chi-Squared =          54.02 using 59 PHA bins.
# Reduced chi-squared =         0.9646 for     56 degrees of freedom
# Null hypothesis probability =   5.503599e-01

Photon flux (15-150 keV)    in 26 sec: 0.276930 ( -0.039485  0.038562 ) ph/cm2/s
Energy fluence (15-150 keV)             : 3.85003e-07 ( -9.17426e-08  1.02294e-07 ) ergs/cm2
Band function

Time interval is from   29.000 sec. to   55.000 sec.


Spectral model in the Band function:
------------------------------------------------------------
Parameters  : value       lower 90%   higher 90%
alpha       :    (     )
beta        :     (     )
Epeak [keV] :       (   )
Norm@50keV   :     (     )
------------------------------------------------------------

Photon flux (15-150 keV)    in  sec:  (    ) ph/cm2/s
Energy fluence (15-150 keV)             : 0 ( 0  0 ) ergs/cm2
Single BB
Spectral model blackbody:
------------------------------------------------------------
Parameters  : value    Lower 90%  Upper 90%
kT [keV]    : 8.11461  (-1.15912  1.38288)
R^2/D10^2   : 0.292084  (-0.136208   0.248648)
(R is the radius in km and D10 is the distance to the source in units of 10 kpc)
------------------------------------------------------------
#Fit statistic : Chi-Squared =          58.12 using 59 PHA bins.
# Reduced chi-squared =          1.020 for     57 degrees of freedom
# Null hypothesis probability =   4.337911e-01

Energy  Fluence     90% Error
[keV]   [erg/cm2]   [erg/cm2]
15- 25  9.137e-08   2.384e-08
25- 50  1.639e-07   3.626e-08
50-150  4.508e-08   1.963e-08
15-150  3.003e-07   5.620e-08
Thermal bremsstrahlung (OTTB)

Spectral model: thermal bremsstrahlung
------------------------------------------------------------
Parameters  : value         Lower 90%    Upper 90%
kT [keV]    : 50.0785       (-16.5935      31.6678)
Norm        : 1.57340       (-0.3577     0.503881)
------------------------------------------------------------
#Fit statistic : Chi-Squared =          53.96 using 59 PHA bins.
# Reduced chi-squared =         0.9466 for     57 degrees of freedom
# Null hypothesis probability =   5.899135e-01

Energy  Fluence     90% Error
[keV]   [erg/cm2]   [erg/cm2]
15- 25  1.001e-07   1.820e-08
25- 50  1.438e-07   2.386e-08
50-150  1.398e-07   5.817e-08
15-150  3.837e-07   8.359e-08
Double BB
Spectral model: bbodyrad<1> + bbodyrad<2>
------------------------------------------------------------
Parameters  : value         Lower 90%    Upper 90%
kT1 [keV]   : 6.86005        (-1.53527      1.55435)
R1^2/D10^2  : 0.505838        (-0.243266      0.428535)
kT2 [keV]   : 35.8178        (-27.6432      -43.8869)
R2^2/D10^2  : 5.82399E-04    (-0.000338359   0.00988244)
------------------------------------------------------------
#Fit statistic : Chi-Squared =          49.96 using 59 PHA bins.
# Reduced chi-squared =         0.9083 for     55 degrees of freedom
# Null hypothesis probability =   6.671812e-01

Energy  Fluence     90% Error
[keV]   [erg/cm2]   [erg/cm2]
15- 25  1.000e-07   4.602e-08
25- 50  1.460e-07   6.620e-08
50-150  1.675e-07   9.686e-08
15-150  4.135e-07   1.942e-07
Peak spectrum fit
Power-law model
Time interval is from   54.000 sec. to   55.000 sec.

Spectral model in power-law:
------------------------------------------------------------
Parameters  : value       lower 90%   higher 90%
Photon index: 2.80234     ( -0.823817   1.33003 )
Norm@50keV  : 2.68782E-03    ( -0.00268692   0.00201436 )
------------------------------------------------------------
#Fit statistic : Chi-Squared =          77.84 using 59 PHA bins.
# Reduced chi-squared =          1.366 for     57 degrees of freedom
# Null hypothesis probability =   3.475302e-02

Photon flux (15-150 keV)    in 1 sec: 0.642855 ( -0.204729  0.204721 ) ph/cm2/s
Energy fluence (15-150 keV)             : 2.96982e-08 ( -1.25148e-08  1.447e-08 ) ergs/cm2
Cutoff power-law model
Time interval is from   54.000 sec. to   55.000 sec.
Spectral model in the cutoff power-law:
------------------------------------------------------------
Parameters  : value       lower 90%   higher 90%
Photon index: 3.43502     ( -1.38463   0.0321507 )
Epeak [keV] : 411.272      ( -93.2369 -412.095 )
Norm@50keV  : 1.33210E-03    ( -0.00132215   0.00313651 )
------------------------------------------------------------
#Fit statistic : Chi-Squared =          77.53 using 59 PHA bins.
# Reduced chi-squared =          1.384 for     56 degrees of freedom
# Null hypothesis probability =   2.998592e-02

Photon flux (15-150 keV)    in 1 sec:  (    ) ph/cm2/s
Energy fluence (15-150 keV)             : 0 ( 0  0 ) ergs/cm2
Band function

Time interval is from   54.000 sec. to   55.000 sec.


Spectral model in the Band function:
------------------------------------------------------------
Parameters  : value       lower 90%   higher 90%
alpha       :    (     )
beta        :     (     )
Epeak [keV] :       (   )
Norm@50keV   :     (     )
------------------------------------------------------------

Photon flux (15-150 keV)    in  sec:  (    ) ph/cm2/s
Energy fluence (15-150 keV)             : 0 ( 0  0 ) ergs/cm2
Single BB
Spectral model blackbody:
------------------------------------------------------------
Parameters  : value    Lower 90%  Upper 90%
kT [keV]    : 4.01813  (-1.34451  3.01746)
R^2/D10^2   : 14.2413  (-14.2627   130.828)
(R is the radius in km and D10 is the distance to the source in units of 10 kpc)
------------------------------------------------------------
#Fit statistic : Chi-Squared =          81.58 using 59 PHA bins.
# Reduced chi-squared =          1.431 for     57 degrees of freedom
# Null hypothesis probability =   1.803240e-02

Energy  Fluence     90% Error
[keV]   [erg/cm2]   [erg/cm2]
15- 25  1.324e-08   7.795e-09
25- 50  4.842e-09   3.244e-09
50-150  6.048e-11   7.055e-11
15-150  1.814e-08   1.111e-08
Thermal bremsstrahlung (OTTB)
Spectral model: thermal bremsstrahlung
------------------------------------------------------------
Parameters  : value         Lower 90%    Upper 90%
kT [keV]    : 25.2852       (-18.9275      69.3082)
Norm        : 5.82045       (-3.38062     41.1616)
------------------------------------------------------------
#Fit statistic : Chi-Squared =          79.64 using 59 PHA bins.
# Reduced chi-squared =          1.397 for     57 degrees of freedom
# Null hypothesis probability =   2.549317e-02

Energy  Fluence     90% Error
[keV]   [erg/cm2]   [erg/cm2]
15- 25  1.074e-08   6.585e-09
25- 50  1.109e-08   7.093e-09
50-150  4.793e-09   4.255e-09
15-150  2.662e-08   1.654e-08
Double BB
Spectral model: bbodyrad<1> + bbodyrad<2>
------------------------------------------------------------
Parameters  : value         Lower 90%    Upper 90%
kT1 [keV]   : 3.10108        (-1.27481      1.71306)
R1^2/D10^2  : 48.6657        (-44.1251      1581.32)
kT2 [keV]   : 16.6457        (-7.74182      21.7906)
R2^2/D10^2  : 2.61529E-02    (-0.0244038   0.134227)
------------------------------------------------------------
#Fit statistic : Chi-Squared =          75.57 using 59 PHA bins.
# Reduced chi-squared =          1.374 for     55 degrees of freedom
# Null hypothesis probability =   3.431632e-02

Energy  Fluence     90% Error
[keV]   [erg/cm2]   [erg/cm2]
15- 25  1.263e-08   7.625e-09
25- 50  8.276e-09   4.444e-09
50-150  1.269e-08   9.420e-09
15-150  3.359e-08   1.791e-08
Pre-slew spectrum (Pre-slew PHA with pre-slew DRM)
Power-law model
Spectral model in power-law:
------------------------------------------------------------
Parameters  : value       lower 90%   higher 90%
Photon index: 2.10065     ( -0.261723   0.283929 )
Norm@50keV  : 1.75668E-03    ( -0.00034457   0.000335489 )
------------------------------------------------------------
#Fit statistic : Chi-Squared =          54.88 using 59 PHA bins.
# Reduced chi-squared =         0.9628 for     57 degrees of freedom
# Null hypothesis probability =   5.551419e-01

Photon flux (15-150 keV)    in 26 sec: 0.276459 ( -0.0389795  0.0389795 ) ph/cm2/s
Energy fluence (15-150 keV)             : 4.24382e-07 ( -7.35194e-08  7.61917e-08 ) ergs/cm2
Cutoff power-law model

Spectral model in the cutoff power-law:
------------------------------------------------------------
Parameters  : value       lower 90%   higher 90%
Photon index: 1.36988     ( -2.29056   0.708981 )
Epeak [keV] : 31.6458      (   )
Norm@50keV  : 5.05479E-03    (     )
------------------------------------------------------------
#Fit statistic : Chi-Squared =          54.02 using 59 PHA bins.
# Reduced chi-squared =         0.9646 for     56 degrees of freedom
# Null hypothesis probability =   5.503589e-01

Photon flux (15-150 keV)    in 26 sec: 0.269844 ( -0.040982  0.040814 ) ph/cm2/s
Energy fluence (15-150 keV)             : 3.85112e-07 ( -9.18268e-08  1.01993e-07 ) ergs/cm2
Band function
Spectral model in the Band function:
------------------------------------------------------------
Parameters  : value       lower 90%   higher 90%
alpha       :    (     )
beta        :     (     )
Epeak [keV] :       (   )
Norm@50keV   :     (     )
------------------------------------------------------------

Photon flux (15-150 keV)    in  sec:  (    ) ph/cm2/s
Energy fluence (15-150 keV)             : 0 ( 0  0 ) ergs/cm2
S(25-50 keV) vs. S(50-100 keV) plot
S(25-50 keV)  = 1.31e-07
S(50-100 keV) = 1.22e-07
T90 vs. Hardness ratio plot
T90                                   = 24 sec.
Hardness ratio (energy fluence ratio) = 0.931298
Color vs. Color plot
Count Ratio  (25-50 keV) / (15-25 keV) = 1.2056
Count Ratio (50-100 keV) / (15-25 keV) = 0.421398
Mask shadow pattern
IMX = 6.671994961526532E-01, IMY = -1.215945848633981E-01
TIME vs. PHA plot around the trigger time
TIME vs. DetID plot around the trigger time
100 us light curve (15-350 keV)
Spacecraft aspect plot
Bright source in the pre-burst/pre-slew/post-slew images
Pre-burst image of 15-350 keV band
Time interval of the image:
-239.000000 29.000000

# RAcent  DECcent POSerr Theta    Phi  PeakCts   SNR AngSep     Name
#  [deg]    [deg]    ['] [deg]  [deg]                   [']
135.4833 -40.5410   10.7  55.0 -148.4   2.0475   1.1    2.2	Vela X-1
170.3697 -60.5679    8.3  52.6  175.2   1.2692   1.4    3.7	Cen X-3
186.6104 -62.7474    7.7  53.3  165.2   1.8696   1.5    1.9	GX 301-2
216.6622  32.1777    2.2  50.3   18.0   3.3723   5.3 ------	UNKNOWN
195.2707  13.2413    3.1  24.1    5.1   0.9938   3.7 ------	UNKNOWN
138.9448 -24.0844    3.0  48.0 -129.0   4.9432   3.9 ------	UNKNOWN
Pre-slew background subtracted image of 15-350 keV band
Time interval of the image:
29.000000 55.000000

# RAcent  DECcent POSerr Theta    Phi  PeakCts   SNR AngSep     Name
#  [deg]    [deg]    ['] [deg]  [deg]                   [']
135.5470 -40.5226    6.5  55.0 -148.4   0.6044   1.8    2.1	Vela X-1
170.4517 -60.6406    4.0  52.7  175.1   0.6452   2.9    4.1	Cen X-3
186.4649 -62.7346   10.2  53.3  165.3   0.3266   1.1    5.7	GX 301-2
190.0561 -44.1808    2.6  34.9  161.2   0.3818   4.4 ------	UNKNOWN
201.9396  21.4045    1.0  34.1   10.3   0.9417  11.9 ------	UNKNOWN
192.9440  26.8005    2.9  36.7   -6.1   0.3159   4.0 ------	UNKNOWN
Post-slew image of 15-350 keV band
Time interval of the image:
196.300590 383.700610

# RAcent  DECcent POSerr Theta    Phi  PeakCts   SNR AngSep     Name
#  [deg]    [deg]    ['] [deg]  [deg]                   [']
254.4403  35.2339   14.4  47.7    7.8  -0.2833  -0.8    6.6	Her X-1
204.5790 -10.3928    2.5  31.9  121.7   1.4150   4.6 ------	UNKNOWN
237.0891  12.7835    2.6  34.6   45.2   1.4547   4.5 ------	UNKNOWN
161.0449  -4.9617    2.6  48.0 -172.0   1.8514   4.5 ------	UNKNOWN
254.0456  53.8988    2.6  50.8  -16.5   1.7962   4.5 ------	UNKNOWN
Plot creation:
Thu May 31 18:03:35 EDT 2018