Estimated redshift from machine learning (Ukwatta et al. 2016) - may take a few minute to calcaulte
Image
Pre-slew 15.0-350.0 keV image (Event data)

#   RAcent    DECcent   POSerr    Theta     Phi              Peak Cts       SNR   Name
  197.3846    36.9706   0.0091    15.6440    47.0382         1.5743042     21.119 TRIG_00832368

Foreground time interval of the image:
 -8.360  28.600 (delta_t =  36.960 [sec])
Background time interval of the image:
-657.231 -643.404 (delta_t =  13.828 [sec])
-239.432  -8.360 (delta_t = 231.072 [sec])
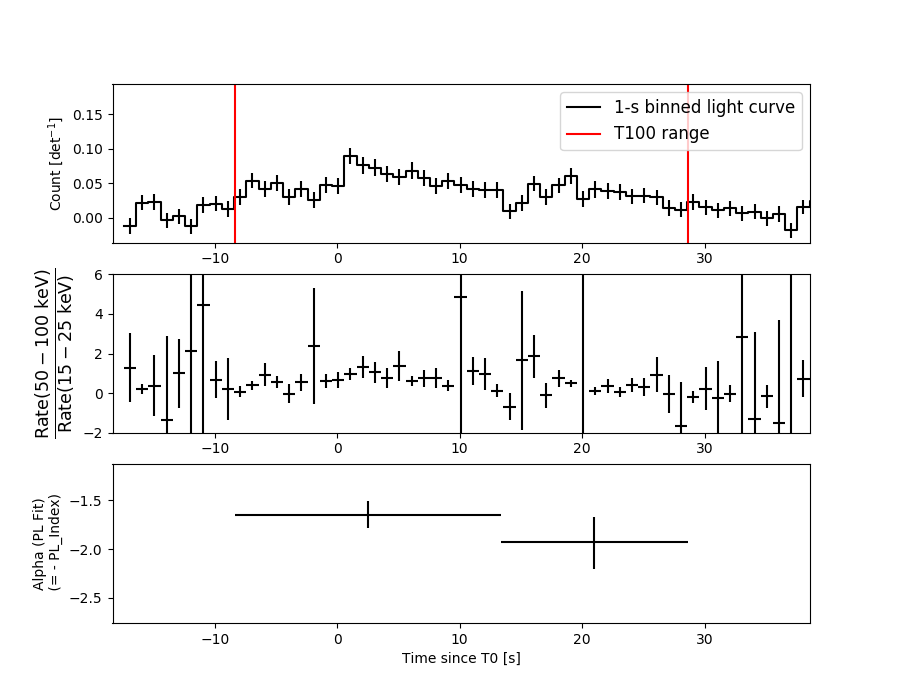
Lightcurves
Notes:
- 1) The mask-weighted light curves are using the flight position.
- 2) Multiple plots of different time binning/intervals are shown to cover all scenarios of short/long GRBs, rate/image triggers, and real/false positives.
- 3) For all the mask-weighted lightcurves, the y-axis units are counts/sec/det where a det is 0.4 x 0.4 = 0.16 sq cm.
- 4) The verticle lines correspond to following: green dotted lines are T50 interval, black dotted lines are T90 interval, blue solid line(s) is a spacecraft slew start time, and orange solid line(s) is a spacecraft slew end time.
- 5) Time of each bin is in the middle of the bin.
1 s binning
From T0-310 s to T0+310 s

From T100_start - 20 s to T100_end + 30 s

Full time interval

64 ms binning
Full time interval

From T100_start to T100_end

From T0-5 sec to T0+5 sec

16 ms binning
From T100_start-5 s to T100_start+5 s

Blue+Cyan dotted lines: Time interval of the scaled map
From 0.000000 to 2.048000
8 ms binning
From T100_start-3 s to T100_start+3 s

Blue+Cyan dotted lines: Time interval of the scaled map
From 0.000000 to 2.048000
2 ms binning
From T100_start-1 s to T100_start+1 s

Blue+Cyan dotted lines: Time interval of the scaled map
From 0.000000 to 2.048000
SN=5 or 10 sec. binning (whichever binning is satisfied first)

SN=5 or 10 sec. binning (T < 200 sec)

Quad-rate summed light curves (from T0-300s to T0+1000s)

Spectral Evolution
Spectra
Notes:
- 1) The fitting includes the systematic errors.
- 2) When the burst includes telescope slew time periods, the fitting uses an average response file made from multiple 5-s response files through out the slew time plus single time preiod for the non-slew times, and weighted by the total counts in the corresponding time period using addrmf. An average response file is needed becuase a spectral fit using the pre-slew DRM will introduce some errors in both a spectral shape and a normalization if the PHA file contains a lot of the slew/post-slew time interval.
- 3) For fits to more complicated models (e.g. a power-law over a cutoff power-law), the BAT team has decided to require a chi-square improvement of more than 6 for each extra dof.
Time averaged spectrum fit using the average DRM
Power-law model

Time interval is from   -8.360 sec. to   28.600 sec.

Spectral model in power-law:
------------------------------------------------------------
Parameters  : value       lower 90%   higher 90%
Photon index: 1.74574     ( -0.128477   0.131162 )
Norm@50keV  : 2.64188E-03    ( -0.000213084   0.000210625 )
------------------------------------------------------------
#Fit statistic : Chi-Squared =          57.47 using 59 PHA bins.
# Reduced chi-squared =          1.008 for     57 degrees of freedom
# Null hypothesis probability =   4.574790e-01

Photon flux (15-150 keV)    in 36.96 sec: 0.356684 ( -0.025593  0.025606 ) ph/cm2/s
Energy fluence (15-150 keV)             : 9.01347e-07 ( -7.51153e-08  7.61195e-08 ) ergs/cm2
Cutoff power-law model

Time interval is from   -8.360 sec. to   28.600 sec.
Spectral model in the cutoff power-law:
------------------------------------------------------------
Parameters  : value       lower 90%   higher 90%
Photon index: 1.26751     ( -0.596717   0.516255 )
Epeak [keV] : 68.3793      ( -17.8582 -68.3793 )
Norm@50keV  : 4.84475E-03    ( -0.00226496   0.00538008 )
------------------------------------------------------------
#Fit statistic : Chi-Squared =          55.02 using 59 PHA bins.
# Reduced chi-squared =         0.9825 for     56 degrees of freedom
# Null hypothesis probability =   5.120749e-01

Photon flux (15-150 keV)    in 36.96 sec: 0.349020 ( -0.02698  0.026884 ) ph/cm2/s
Energy fluence (15-150 keV)             : 8.57298e-07 ( -8.76684e-08  8.92048e-08 ) ergs/cm2
Band function

Time interval is from   -8.360 sec. to   28.600 sec.


Spectral model in the Band function:
------------------------------------------------------------
Parameters  : value       lower 90%   higher 90%
alpha       :    (     )
beta        :     (     )
Epeak [keV] :       (   )
Norm@50keV   :     (     )
------------------------------------------------------------

Photon flux (15-150 keV)    in  sec:  (    ) ph/cm2/s
Energy fluence (15-150 keV)             : 0 ( 0  0 ) ergs/cm2
Single BB

Spectral model blackbody:
------------------------------------------------------------
Parameters  : value    Lower 90%  Upper 90%
kT [keV]    : 11.8972  (-1.01054  1.1177)
R^2/D10^2   : 8.83139E-02  (-0.0249621   0.0343969)
(R is the radius in km and D10 is the distance to the source in units of 10 kpc)
------------------------------------------------------------
#Fit statistic : Chi-Squared =          90.89 using 59 PHA bins.
# Reduced chi-squared =          1.595 for     57 degrees of freedom
# Null hypothesis probability =   2.885094e-03

Energy  Fluence     90% Error
[keV]   [erg/cm2]   [erg/cm2]
15- 25  9.764e-08   1.379e-08
25- 50  3.042e-07   2.683e-08
50-150  2.574e-07   4.760e-08
15-150  6.592e-07   6.043e-08
Thermal bremsstrahlung (OTTB)

Spectral model: thermal bremsstrahlung
------------------------------------------------------------
Parameters  : value         Lower 90%    Upper 90%
kT [keV]    : 112.005       (-29.1137      44.5928)
Norm        : 1.53251       (-0.139962     0.172201)
------------------------------------------------------------
#Fit statistic : Chi-Squared =          54.99 using 59 PHA bins.
# Reduced chi-squared =         0.9647 for     57 degrees of freedom
# Null hypothesis probability =   5.509578e-01

Energy  Fluence     90% Error
[keV]   [erg/cm2]   [erg/cm2]
15- 25  1.479e-07   1.573e-08
25- 50  2.613e-07   2.358e-08
50-150  4.503e-07   1.547e-07
15-150  8.595e-07   1.818e-07
Double BB

Spectral model: bbodyrad<1> + bbodyrad<2>
------------------------------------------------------------
Parameters  : value         Lower 90%    Upper 90%
kT1 [keV]   : 5.54559        (-1.36984      2.03105)
R1^2/D10^2  : 0.881131        (-0.559127      1.72546)
kT2 [keV]   : 18.7627        (-3.48153      8.07158)
R2^2/D10^2  : 1.29399E-02    (-0.00982524   0.0119703)
------------------------------------------------------------
#Fit statistic : Chi-Squared =          56.39 using 59 PHA bins.
# Reduced chi-squared =          1.025 for     55 degrees of freedom
# Null hypothesis probability =   4.229029e-01

Energy  Fluence     90% Error
[keV]   [erg/cm2]   [erg/cm2]
15- 25  1.510e-07   6.198e-08
25- 50  2.569e-07   6.978e-08
50-150  4.154e-07   1.405e-07
15-150  8.234e-07   2.325e-07
Peak spectrum fit
Power-law model

Time interval is from    0.292 sec. to    1.292 sec.

Spectral model in power-law:
------------------------------------------------------------
Parameters  : value       lower 90%   higher 90%
Photon index: 1.75359     ( -0.362931   0.392687 )
Norm@50keV  : 5.42522E-03    ( -0.00135494   0.00129461 )
------------------------------------------------------------
#Fit statistic : Chi-Squared =          49.44 using 59 PHA bins.
# Reduced chi-squared =         0.8673 for     57 degrees of freedom
# Null hypothesis probability =   7.514427e-01

Photon flux (15-150 keV)    in 1 sec: 0.734589 ( -0.148766  0.148768 ) ph/cm2/s
Energy fluence (15-150 keV)             : 5.00587e-08 ( -1.24845e-08  1.29746e-08 ) ergs/cm2
Cutoff power-law model

Time interval is from    0.292 sec. to    1.292 sec.
Spectral model in the cutoff power-law:
------------------------------------------------------------
Parameters  : value       lower 90%   higher 90%
Photon index: 1.74090     ( -1.428   1.05029 )
Epeak [keV] : 801.898      ( -894.124 -894.134 )
Norm@50keV  : 5.51814E-03    ( -0.00144527   0.0320243 )
------------------------------------------------------------
#Fit statistic : Chi-Squared =          49.44 using 59 PHA bins.
# Reduced chi-squared =         0.8828 for     56 degrees of freedom
# Null hypothesis probability =   7.198564e-01

Photon flux (15-150 keV)    in 1 sec: 0.734298 ( -0.150589  0.149018 ) ph/cm2/s
Energy fluence (15-150 keV)             : 4.99839e-08 ( -1.42903e-08  1.08576e-08 ) ergs/cm2
Band function

Time interval is from    0.292 sec. to    1.292 sec.


Spectral model in the Band function:
------------------------------------------------------------
Parameters  : value       lower 90%   higher 90%
alpha       :    (     )
beta        :     (     )
Epeak [keV] :       (   )
Norm@50keV   :     (     )
------------------------------------------------------------

Photon flux (15-150 keV)    in  sec:  (    ) ph/cm2/s
Energy fluence (15-150 keV)             : 0 ( 0  0 ) ergs/cm2
Single BB

Spectral model blackbody:
------------------------------------------------------------
Parameters  : value    Lower 90%  Upper 90%
kT [keV]    : 9.16883  (-2.48532  4.70273)
R^2/D10^2   : 0.463455  (-0.354405   1.06949)
(R is the radius in km and D10 is the distance to the source in units of 10 kpc)
------------------------------------------------------------
#Fit statistic : Chi-Squared =          58.15 using 59 PHA bins.
# Reduced chi-squared =          1.020 for     57 degrees of freedom
# Null hypothesis probability =   4.326887e-01

Energy  Fluence     90% Error
[keV]   [erg/cm2]   [erg/cm2]
15- 25  7.657e-09   3.351e-09
25- 50  1.675e-08   7.468e-09
50-150  6.762e-09   4.102e-09
15-150  3.117e-08   1.271e-08
Thermal bremsstrahlung (OTTB)

Spectral model: thermal bremsstrahlung
------------------------------------------------------------
Parameters  : value         Lower 90%    Upper 90%
kT [keV]    : 108.046       (-58.8979      -108.433)
Norm        : 3.20028       (-0.756794     1.14816)
------------------------------------------------------------
#Fit statistic : Chi-Squared =          49.77 using 59 PHA bins.
# Reduced chi-squared =         0.8732 for     57 degrees of freedom
# Null hypothesis probability =   7.404513e-01

Energy  Fluence     90% Error
[keV]   [erg/cm2]   [erg/cm2]
15- 25  8.360e-09   3.659e-09
25- 50  1.468e-08   8.561e-09
50-150  2.482e-08   1.829e-08
15-150  4.785e-08   3.016e-08
Double BB

Spectral model: bbodyrad<1> + bbodyrad<2>
------------------------------------------------------------
Parameters  : value         Lower 90%    Upper 90%
kT1 [keV]   : 5.84403        (-1.63511      2.13485)
R1^2/D10^2  : 2.00070        (-1.37733      2.8083)
kT2 [keV]   : 27.2192        (-10.8543      53.4958)
R2^2/D10^2  : 7.10433E-03    (-0.00661755   0.0337273)
------------------------------------------------------------
#Fit statistic : Chi-Squared =          46.78 using 59 PHA bins.
# Reduced chi-squared =         0.8506 for     55 degrees of freedom
# Null hypothesis probability =   7.769585e-01

Energy  Fluence     90% Error
[keV]   [erg/cm2]   [erg/cm2]
15- 25  9.606e-09   5.530e-09
25- 50  1.338e-08   7.015e-09
50-150  2.854e-08   1.726e-08
15-150  5.152e-08   2.827e-08
Pre-slew spectrum (Pre-slew PHA with pre-slew DRM)
Power-law model
Spectral model in power-law:
------------------------------------------------------------
Parameters  : value       lower 90%   higher 90%
Photon index: 1.74574     ( -0.128477   0.131162 )
Norm@50keV  : 2.64188E-03    ( -0.000213084   0.000210625 )
------------------------------------------------------------
#Fit statistic : Chi-Squared =          57.47 using 59 PHA bins.
# Reduced chi-squared =          1.008 for     57 degrees of freedom
# Null hypothesis probability =   4.574790e-01

Photon flux (15-150 keV)    in 36.96 sec: 0.356667 ( -0.0255907  0.0256042 ) ph/cm2/s
Energy fluence (15-150 keV)             : 9.01222e-07 ( -7.52021e-08  7.61073e-08 ) ergs/cm2
Cutoff power-law model

Spectral model in the cutoff power-law:
------------------------------------------------------------
Parameters  : value       lower 90%   higher 90%
Photon index: 1.26749     ( -0.596709   0.516263 )
Epeak [keV] : 68.3776      ( -17.8579 -68.379 )
Norm@50keV  : 4.84493E-03    ( -0.00226498   0.00538004 )
------------------------------------------------------------
#Fit statistic : Chi-Squared =          55.02 using 59 PHA bins.
# Reduced chi-squared =         0.9825 for     56 degrees of freedom
# Null hypothesis probability =   5.120749e-01

Photon flux (15-150 keV)    in 36.96 sec: 0.348962 ( -0.026971  0.026875 ) ph/cm2/s
Energy fluence (15-150 keV)             : 8.57564e-07 ( -8.7732e-08  8.92658e-08 ) ergs/cm2
Band function
Spectral model in the Band function:
------------------------------------------------------------
Parameters  : value       lower 90%   higher 90%
alpha       :    (     )
beta        :     (     )
Epeak [keV] :       (   )
Norm@50keV   :     (     )
------------------------------------------------------------

Photon flux (15-150 keV)    in  sec:  (    ) ph/cm2/s
Energy fluence (15-150 keV)             : 0 ( 0  0 ) ergs/cm2
S(25-50 keV) vs. S(50-100 keV) plot

S(25-50 keV)  = 2.48e-07
S(50-100 keV) = 2.96e-07
T90 vs. Hardness ratio plot

T90                                   = 31.1599999666214 sec.
Hardness ratio (energy fluence ratio) = 1.19355
Color vs. Color plot

Count Ratio  (25-50 keV) / (15-25 keV) = 1.11969
Count Ratio (50-100 keV) / (15-25 keV) = 0.668857
Mask shadow pattern

IMX = 1.908452745266090E-01, IMY = -2.049304000518498E-01
TIME vs. PHA plot around the trigger time
Blue+Cyan dotted lines: Time interval of the scaled map
From 0.000000 to 2.048000
TIME vs. DetID plot around the trigger time

Blue+Cyan dotted lines: Time interval of the scaled map
From 0.000000 to 2.048000
100 us light curve (15-350 keV)

Blue+Cyan dotted lines: Time interval of the scaled map
From 0.000000 to 2.048000
Spacecraft aspect plot
Bright source in the pre-burst/pre-slew/post-slew images
Pre-burst image of 15-350 keV band
Time interval of the image:
-657.231410 -643.403600
-239.432000 -8.360000

# RAcent  DECcent POSerr Theta    Phi  PeakCts   SNR AngSep     Name
#  [deg]    [deg]    ['] [deg]  [deg]                   [']
201.5431   4.2131    3.3  40.9   98.2   3.5463   3.6 ------	UNKNOWN
174.7324  21.2045    2.0  17.8  145.2   1.1532   5.7 ------	UNKNOWN
120.7975  27.9075    2.2  47.9 -129.0   5.3238   5.3 ------	UNKNOWN
Pre-slew background subtracted image of 15-350 keV band
Time interval of the image:
-8.360000 28.600000

# RAcent  DECcent POSerr Theta    Phi  PeakCts   SNR AngSep     Name
#  [deg]    [deg]    ['] [deg]  [deg]                   [']
197.3846  36.9706    0.5  15.6   47.0   1.5744  21.1 ------	UNKNOWN
262.2776  68.8225    2.2  52.3  -16.7   0.9669   5.2 ------	UNKNOWN
Post-slew image of 15-350 keV band
Time interval of the image:
66.868590 962.718600

# RAcent  DECcent POSerr Theta    Phi  PeakCts   SNR AngSep     Name
#  [deg]    [deg]    ['] [deg]  [deg]                   [']
254.3553  35.4343   21.2  45.3   20.1   0.6038   0.5    7.4	Her X-1
215.2220  -0.3716    3.3  40.8   98.2   8.1671   3.5 ------	UNKNOWN
189.5543  -3.0865    2.3  40.7  138.2   7.0190   5.0 ------	UNKNOWN
232.1036  39.6414    3.2  27.2   19.8   2.0851   3.6 ------	UNKNOWN
276.4572  47.6576    3.8  56.9   -1.7   7.9561   3.0 ------	UNKNOWN
143.6725  10.7124    2.9  54.8 -158.1   9.5664   4.0 ------	UNKNOWN
157.4111  50.8047    3.6  31.5 -105.0   3.2032   3.2 ------	UNKNOWN
152.7710  69.0212    4.8  40.1  -76.9   5.8557   2.4 ------	UNKNOWN
137.6944  33.6866    3.6  48.0 -129.0   9.0523   3.2 ------	UNKNOWN
Plot creation:
Thu May 31 18:02:07 EDT 2018