Estimated redshift from machine learning (Ukwatta et al. 2016) - may take a few minute to calcaulte
Image
Pre-slew 15.0-350.0 keV image (Event data)
#   RAcent    DECcent   POSerr    Theta     Phi              Peak Cts       SNR   Name
  169.9449    73.8245   0.0114    29.7905    20.6860         0.7302472     16.873 TRIG_00842475

Foreground time interval of the image:
 -0.056   9.077 (delta_t =   9.133 [sec])
Background time interval of the image:
-239.224  -0.056 (delta_t = 239.168 [sec])
Lightcurves
Notes:
- 1) The mask-weighted light curves are using the flight position.
- 2) Multiple plots of different time binning/intervals are shown to cover all scenarios of short/long GRBs, rate/image triggers, and real/false positives.
- 3) For all the mask-weighted lightcurves, the y-axis units are counts/sec/det where a det is 0.4 x 0.4 = 0.16 sq cm.
- 4) The verticle lines correspond to following: green dotted lines are T50 interval, black dotted lines are T90 interval, blue solid line(s) is a spacecraft slew start time, and orange solid line(s) is a spacecraft slew end time.
- 5) Time of each bin is in the middle of the bin.
1 s binning
From T0-310 s to T0+310 s
From T100_start - 20 s to T100_end + 30 s

Full time interval
64 ms binning
Full time interval
From T100_start to T100_end

From T0-5 sec to T0+5 sec

16 ms binning
From T100_start-5 s to T100_start+5 s
Blue+Cyan dotted lines: Time interval of the scaled map
From 0.000000 to 0.064000
8 ms binning
From T100_start-3 s to T100_start+3 s
Blue+Cyan dotted lines: Time interval of the scaled map
From 0.000000 to 0.064000
2 ms binning
From T100_start-1 s to T100_start+1 s
Blue+Cyan dotted lines: Time interval of the scaled map
From 0.000000 to 0.064000
SN=5 or 10 sec. binning (whichever binning is satisfied first)
SN=5 or 10 sec. binning (T < 200 sec)
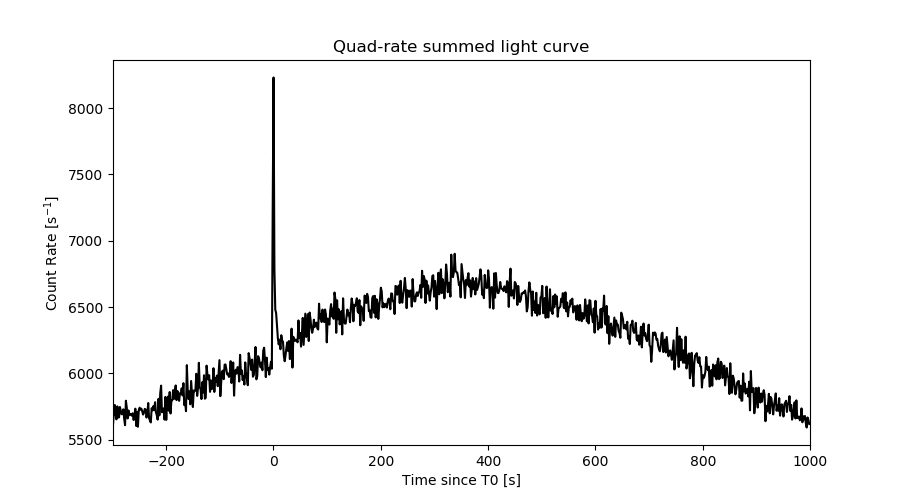
Quad-rate summed light curves (from T0-300s to T0+1000s)
Spectral Evolution

Spectra
Notes:
- 1) The fitting includes the systematic errors.
- 2) When the burst includes telescope slew time periods, the fitting uses an average response file made from multiple 5-s response files through out the slew time plus single time preiod for the non-slew times, and weighted by the total counts in the corresponding time period using addrmf. An average response file is needed becuase a spectral fit using the pre-slew DRM will introduce some errors in both a spectral shape and a normalization if the PHA file contains a lot of the slew/post-slew time interval.
- 3) For fits to more complicated models (e.g. a power-law over a cutoff power-law), the BAT team has decided to require a chi-square improvement of more than 6 for each extra dof.
Time averaged spectrum fit using the average DRM
Power-law model
Time interval is from   -0.056 sec. to   56.328 sec.

Spectral model in power-law:
------------------------------------------------------------
Parameters  : value       lower 90%   higher 90%
Photon index: 1.37712     ( -0.264578   0.265877 )
Norm@50keV  : 1.23322E-03    ( -0.000167555   0.000167033 )
------------------------------------------------------------
#Fit statistic : Chi-Squared =          74.85 using 59 PHA bins.
# Reduced chi-squared =          1.313 for     57 degrees of freedom
# Null hypothesis probability =   5.649312e-02

Photon flux (15-150 keV)    in 56.38 sec: 0.149423 ( -0.020925  0.020997 ) ph/cm2/s
Energy fluence (15-150 keV)             : 6.75139e-07 ( -1.02745e-07  1.03875e-07 ) ergs/cm2
Cutoff power-law model
Time interval is from   -0.056 sec. to   56.328 sec.
Spectral model in the cutoff power-law:
------------------------------------------------------------
Parameters  : value       lower 90%   higher 90%
Photon index: 3.59894     ( -0.608048   0.258003 )
Epeak [keV] : 401.812      ( -9999.36 -9999.36 )
Norm@50keV  : 1.12729E-04    ( -0.000113308   0.000499455 )
------------------------------------------------------------
#Fit statistic : Chi-Squared =          72.93 using 59 PHA bins.
# Reduced chi-squared =          1.302 for     56 degrees of freedom
# Null hypothesis probability =   6.382077e-02

Photon flux (15-150 keV)    in 56.38 sec: 0.149429 ( -0.020957  0.020967 ) ph/cm2/s
Energy fluence (15-150 keV)             : 6.7899e-07 ( 0  0 ) ergs/cm2
Band function

Time interval is from   -0.056 sec. to   56.328 sec.


Spectral model in the Band function:
------------------------------------------------------------
Parameters  : value       lower 90%   higher 90%
alpha       :    (     )
beta        :     (     )
Epeak [keV] :       (   )
Norm@50keV   :     (     )
------------------------------------------------------------

Photon flux (15-150 keV)    in  sec:  (    ) ph/cm2/s
Energy fluence (15-150 keV)             : 0 ( 0  0 ) ergs/cm2
Single BB
Spectral model blackbody:
------------------------------------------------------------
Parameters  : value    Lower 90%  Upper 90%
kT [keV]    : 19.3911  (-3.52971  4.50394)
R^2/D10^2   : 7.01200E-03  (-0.00344861   0.00667542)
(R is the radius in km and D10 is the distance to the source in units of 10 kpc)
------------------------------------------------------------
#Fit statistic : Chi-Squared =          93.26 using 59 PHA bins.
# Reduced chi-squared =          1.636 for     57 degrees of freedom
# Null hypothesis probability =   1.733379e-03

Energy  Fluence     90% Error
[keV]   [erg/cm2]   [erg/cm2]
15- 25  2.900e-08   8.635e-09
25- 50  1.415e-07   3.143e-08
50-150  3.924e-07   1.097e-07
15-150  5.629e-07   1.309e-07
Thermal bremsstrahlung (OTTB)
Spectral model: thermal bremsstrahlung
------------------------------------------------------------
Parameters  : value         Lower 90%    Upper 90%
kT [keV]    : 200.000       (-60.4343      -200)
Norm        : 0.614893       (-0.0835412     0.0835412)
------------------------------------------------------------
#Fit statistic : Chi-Squared =          77.73 using 59 PHA bins.
# Reduced chi-squared =          1.364 for     57 degrees of freedom
# Null hypothesis probability =   3.535510e-02

Energy  Fluence     90% Error
[keV]   [erg/cm2]   [erg/cm2]
15- 25  8.636e-08   4.820e-08
25- 50  1.661e-07   9.221e-08
50-150  3.643e-07   2.034e-07
15-150  6.168e-07   3.431e-07
Double BB

Spectral model: bbodyrad<1> + bbodyrad<2>
------------------------------------------------------------
Parameters  : value         Lower 90%    Upper 90%
kT1 [keV]   : 3.84430        (-1.70535      2.69928)
R1^2/D10^2  : 1.92062        (-1.71574      63.2413)
kT2 [keV]   : 25.4124        (-5.61322      10.614)
R2^2/D10^2  : 2.67576E-03    (-0.00178556   0.00331003)
------------------------------------------------------------
#Fit statistic : Chi-Squared =          72.21 using 59 PHA bins.
# Reduced chi-squared =          1.313 for     55 degrees of freedom
# Null hypothesis probability =   5.968144e-02

Energy  Fluence     90% Error
[keV]   [erg/cm2]   [erg/cm2]
15- 25  9.776e-08   4.994e-08
25- 50  1.220e-07   4.379e-08
50-150  4.587e-07   1.961e-07
15-150  6.785e-07   1.911e-07
Peak spectrum fit
Power-law model
Time interval is from   -0.076 sec. to    0.924 sec.

Spectral model in power-law:
------------------------------------------------------------
Parameters  : value       lower 90%   higher 90%
Photon index: 0.978647     ( -0.177312   0.172939 )
Norm@50keV  : 1.87269E-02    ( -0.00184947   0.00184358 )
------------------------------------------------------------
#Fit statistic : Chi-Squared =          45.94 using 59 PHA bins.
# Reduced chi-squared =         0.8059 for     57 degrees of freedom
# Null hypothesis probability =   8.527779e-01

Photon flux (15-150 keV)    in 1 sec: 2.15380 ( -0.21545  0.21595 ) ph/cm2/s
Energy fluence (15-150 keV)             : 2.0408e-07 ( -2.19129e-08  2.20301e-08 ) ergs/cm2
Cutoff power-law model
Time interval is from   -0.076 sec. to    0.924 sec.
Spectral model in the cutoff power-law:
------------------------------------------------------------
Parameters  : value       lower 90%   higher 90%
Photon index: 0.969446     ( -0.666754   0.177339 )
Epeak [keV] : 9981.02      ( -9817.35 -9817.35 )
Norm@50keV  : 1.88792E-02    ( -0.00183715   0.0178274 )
------------------------------------------------------------
#Fit statistic : Chi-Squared =          45.94 using 59 PHA bins.
# Reduced chi-squared =         0.8203 for     56 degrees of freedom
# Null hypothesis probability =   8.290496e-01

Photon flux (15-150 keV)    in 1 sec: 2.15258 ( -0.21998  0.21604 ) ph/cm2/s
Energy fluence (15-150 keV)             : 2.03915e-07 ( -2.20789e-08  2.09697e-08 ) ergs/cm2
Band function

Time interval is from   -0.076 sec. to    0.924 sec.


Spectral model in the Band function:
------------------------------------------------------------
Parameters  : value       lower 90%   higher 90%
alpha       :    (     )
beta        :     (     )
Epeak [keV] :       (   )
Norm@50keV   :     (     )
------------------------------------------------------------

Photon flux (15-150 keV)    in  sec:  (    ) ph/cm2/s
Energy fluence (15-150 keV)             : 0 ( 0  0 ) ergs/cm2
Single BB
Spectral model blackbody:
------------------------------------------------------------
Parameters  : value    Lower 90%  Upper 90%
kT [keV]    : 22.9691  (-3.16786  3.87485)
R^2/D10^2   : 6.71473E-02  (-0.0253883   0.0392711)
(R is the radius in km and D10 is the distance to the source in units of 10 kpc)
------------------------------------------------------------
#Fit statistic : Chi-Squared =          68.45 using 59 PHA bins.
# Reduced chi-squared =          1.201 for     57 degrees of freedom
# Null hypothesis probability =   1.423404e-01

Energy  Fluence     90% Error
[keV]   [erg/cm2]   [erg/cm2]
15- 25  6.424e-09   1.386e-09
25- 50  3.483e-08   5.765e-09
50-150  1.373e-07   2.260e-08
15-150  1.785e-07   2.500e-08
Thermal bremsstrahlung (OTTB)
Spectral model: thermal bremsstrahlung
------------------------------------------------------------
Parameters  : value         Lower 90%    Upper 90%
kT [keV]    : 200.000       (-19.5068      -200)
Norm        : 8.66978       (-0.888555     0.888555)
------------------------------------------------------------
#Fit statistic : Chi-Squared =          74.83 using 59 PHA bins.
# Reduced chi-squared =          1.313 for     57 degrees of freedom
# Null hypothesis probability =   5.670561e-02

Energy  Fluence     90% Error
[keV]   [erg/cm2]   [erg/cm2]
15- 25  2.159e-08   1.188e-08
25- 50  4.154e-08   2.286e-08
50-150  9.109e-08   4.946e-08
15-150  1.542e-07   8.040e-08
Double BB
Spectral model: bbodyrad<1> + bbodyrad<2>
------------------------------------------------------------
Parameters  : value         Lower 90%    Upper 90%
kT1 [keV]   : 41.5080        (-11.4731      39.9011)
R1^2/D10^2  : 9.82137E-03        (-0.007911      0.0120237)
kT2 [keV]   : 8.45594        (-2.10183      3.08443)
R2^2/D10^2  : 0.941980    (-0.572135   1.45126)
------------------------------------------------------------
#Fit statistic : Chi-Squared =          43.09 using 59 PHA bins.
# Reduced chi-squared =         0.7834 for     55 degrees of freedom
# Null hypothesis probability =   8.780638e-01

Energy  Fluence     90% Error
[keV]   [erg/cm2]   [erg/cm2]
15- 25  1.478e-08   7.650e-09
25- 50  3.898e-08   1.548e-08
50-150  1.541e-07   7.685e-08
15-150  2.079e-07   9.178e-08
Pre-slew spectrum (Pre-slew PHA with pre-slew DRM)
Power-law model
Spectral model in power-law:
------------------------------------------------------------
Parameters  : value       lower 90%   higher 90%
Photon index: 1.27632     ( -0.183533   0.181712 )
Norm@50keV  : 5.05452E-03    ( -0.000489485   0.000489442 )
------------------------------------------------------------
#Fit statistic : Chi-Squared =          58.06 using 59 PHA bins.
# Reduced chi-squared =          1.019 for     57 degrees of freedom
# Null hypothesis probability =   4.359739e-01

Photon flux (15-150 keV)    in 9.133 sec: 0.600466 ( -0.0605853  0.0609073 ) ph/cm2/s
Energy fluence (15-150 keV)             : 4.58865e-07 ( -4.94159e-08  4.97709e-08 ) ergs/cm2
Cutoff power-law model

Spectral model in the cutoff power-law:
------------------------------------------------------------
Parameters  : value       lower 90%   higher 90%
Photon index: 2.34067     ( -0.190652   0.177324 )
Epeak [keV] : 116.555      ( -9999.36 -9999.36 )
Norm@50keV  : 1.25533E-03    ( -0.000476693   0.000833427 )
------------------------------------------------------------
#Fit statistic : Chi-Squared =          56.38 using 59 PHA bins.
# Reduced chi-squared =          1.007 for     56 degrees of freedom
# Null hypothesis probability =   4.605112e-01

Photon flux (15-150 keV)    in 9.133 sec: 0.601437 ( -0.061732  0.059755 ) ph/cm2/s
Energy fluence (15-150 keV)             : 4.56565e-07 ( -2.37138e-08  5.19147e-08 ) ergs/cm2
Band function
Spectral model in the Band function:
------------------------------------------------------------
Parameters  : value       lower 90%   higher 90%
alpha       :    (     )
beta        :     (     )
Epeak [keV] :       (   )
Norm@50keV   :     (     )
------------------------------------------------------------

Photon flux (15-150 keV)    in  sec:  (    ) ph/cm2/s
Energy fluence (15-150 keV)             : 0 ( 0  0 ) ergs/cm2
S(25-50 keV) vs. S(50-100 keV) plot
S(25-50 keV)  = 1.57e-07
S(50-100 keV) = 2.41e-07
T90 vs. Hardness ratio plot
T90                                   = 47.4239999055862 sec.
Hardness ratio (energy fluence ratio) = 1.53503
Color vs. Color plot

Count Ratio  (25-50 keV) / (15-25 keV) = 0.862633
Count Ratio (50-100 keV) / (15-25 keV) = 0.994833
Mask shadow pattern

IMX = 5.355770161809943E-01, IMY = -2.022278593502041E-01
TIME vs. PHA plot around the trigger time

Blue+Cyan dotted lines: Time interval of the scaled map
From 0.000000 to 0.064000
TIME vs. DetID plot around the trigger time
Blue+Cyan dotted lines: Time interval of the scaled map
From 0.000000 to 0.064000
100 us light curve (15-350 keV)
Blue+Cyan dotted lines: Time interval of the scaled map
From 0.000000 to 0.064000
Spacecraft aspect plot

Bright source in the pre-burst/pre-slew/post-slew images
Pre-burst image of 15-350 keV band
Time interval of the image:
-239.224000 -0.056000

# RAcent  DECcent POSerr Theta    Phi  PeakCts   SNR AngSep     Name
#  [deg]    [deg]    ['] [deg]  [deg]                   [']
  8.2040  77.4659    2.8  51.6   -8.1   2.1409   4.0 ------	UNKNOWN
103.1265  12.2964    2.2  46.1 -123.3   5.9589   5.2 ------	UNKNOWN
Pre-slew background subtracted image of 15-350 keV band
Time interval of the image:
-0.056000 9.076600

# RAcent  DECcent POSerr Theta    Phi  PeakCts   SNR AngSep     Name
#  [deg]    [deg]    ['] [deg]  [deg]                   [']
169.9450  73.8246    0.7  29.8   20.7   0.7302  16.9 ------	UNKNOWN
137.8565  -9.0339    2.3  56.3 -174.6   0.8579   5.0 ------	UNKNOWN
Post-slew image of 15-350 keV band
Time interval of the image:
65.876610 962.802300

# RAcent  DECcent POSerr Theta    Phi  PeakCts   SNR AngSep     Name
#  [deg]    [deg]    ['] [deg]  [deg]                   [']
174.9005  17.1063    2.8  56.8  173.9  18.2196   4.1 ------	UNKNOWN
141.0397  30.0846    2.6  46.2 -145.1   6.4529   4.4 ------	UNKNOWN
 71.2723  51.2226    3.8  43.7  -64.1  11.7969   3.0 ------	UNKNOWN
Plot creation:
Fri Jul  6 14:37:48 EDT 2018