Estimated redshift from machine learning (Ukwatta et al. 2016) - may take a few minute to calcaulte
Image
Pre-slew 15.0-350.0 keV image (Event data)
#   RAcent    DECcent   POSerr    Theta     Phi              Peak Cts       SNR   Name
  357.5116   -57.9551   0.0044    30.3956  -176.7104        10.2661375     43.486 TRIG_00843211

Foreground time interval of the image:
-158.203  16.797 (delta_t = 175.000 [sec])
Background time interval of the image:
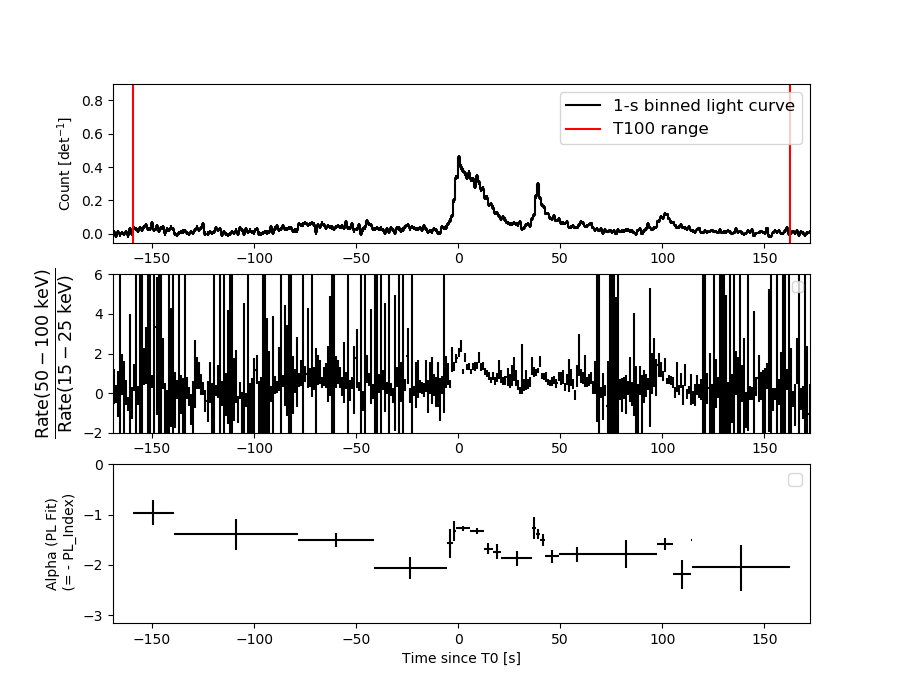
Lightcurves
Notes:
- 1) The mask-weighted light curves are using the flight position.
- 2) Multiple plots of different time binning/intervals are shown to cover all scenarios of short/long GRBs, rate/image triggers, and real/false positives.
- 3) For all the mask-weighted lightcurves, the y-axis units are counts/sec/det where a det is 0.4 x 0.4 = 0.16 sq cm.
- 4) The verticle lines correspond to following: green dotted lines are T50 interval, black dotted lines are T90 interval, blue solid line(s) is a spacecraft slew start time, and orange solid line(s) is a spacecraft slew end time.
- 5) Time of each bin is in the middle of the bin.
1 s binning
From T0-310 s to T0+310 s
From T100_start - 20 s to T100_end + 30 s
Full time interval
64 ms binning
Full time interval
From T100_start to T100_end

From T0-5 sec to T0+5 sec
16 ms binning
From T100_start-5 s to T100_start+5 s
8 ms binning
From T100_start-3 s to T100_start+3 s
2 ms binning
From T100_start-1 s to T100_start+1 s
SN=5 or 10 sec. binning (whichever binning is satisfied first)
SN=5 or 10 sec. binning (T < 200 sec)
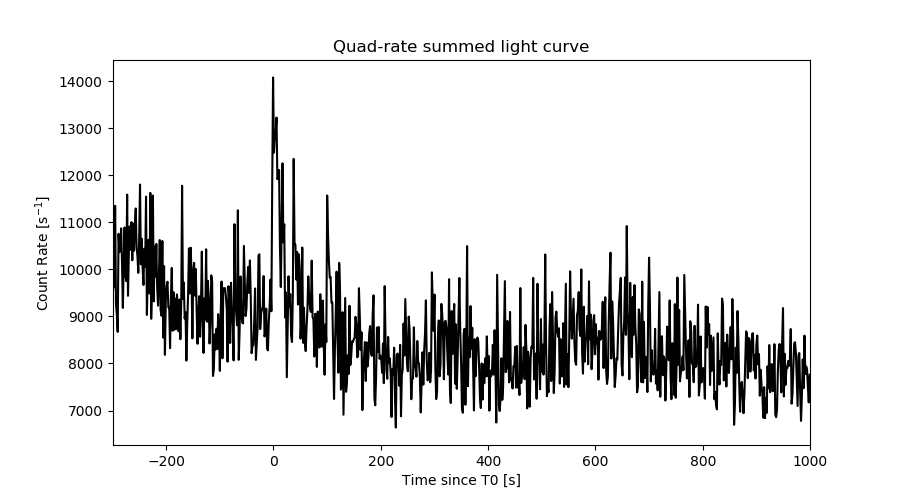
Quad-rate summed light curves (from T0-300s to T0+1000s)
Spectral Evolution
Spectra
Notes:
- 1) The fitting includes the systematic errors.
- 2) When the burst includes telescope slew time periods, the fitting uses an average response file made from multiple 5-s response files through out the slew time plus single time preiod for the non-slew times, and weighted by the total counts in the corresponding time period using addrmf. An average response file is needed becuase a spectral fit using the pre-slew DRM will introduce some errors in both a spectral shape and a normalization if the PHA file contains a lot of the slew/post-slew time interval.
- 3) For fits to more complicated models (e.g. a power-law over a cutoff power-law), the BAT team has decided to require a chi-square improvement of more than 6 for each extra dof.
Time averaged spectrum fit using the average DRM
Power-law model

Time interval is from -159.376 sec. to  162.428 sec.

Spectral model in power-law:
------------------------------------------------------------
Parameters  : value       lower 90%   higher 90%
Photon index: 1.58023     ( -0.0476638   0.0476839 )
Norm@50keV  : 3.37104E-03    ( -8.35712e-05   8.35664e-05 )
------------------------------------------------------------
#Fit statistic : Chi-Squared =          65.94 using 59 PHA bins.
# Reduced chi-squared =          1.157 for     57 degrees of freedom
# Null hypothesis probability =   1.950995e-01

Photon flux (15-150 keV)    in 321.8 sec: 0.430598 ( -0.012073  0.012118 ) ph/cm2/s
Energy fluence (15-150 keV)             : 1.01717e-05 ( -2.62374e-07  2.62862e-07 ) ergs/cm2
Cutoff power-law model
Time interval is from -159.376 sec. to  162.428 sec.
Spectral model in the cutoff power-law:
------------------------------------------------------------
Parameters  : value       lower 90%   higher 90%
Photon index: 1.30546     ( -0.197141   0.188844 )
Epeak [keV] : 137.135      ( -35.5131 166.33 )
Norm@50keV  : 4.51152E-03    ( -0.000799035   0.00101921 )
------------------------------------------------------------
#Fit statistic : Chi-Squared =          59.67 using 59 PHA bins.
# Reduced chi-squared =          1.066 for     56 degrees of freedom
# Null hypothesis probability =   3.438031e-01

Photon flux (15-150 keV)    in 321.8 sec: 0.421092 ( -0.01353  0.013599 ) ph/cm2/s
Energy fluence (15-150 keV)             : 9.96911e-06 ( -2.97112e-07  2.96297e-07 ) ergs/cm2
Band function

Time interval is from -159.376 sec. to  162.428 sec.


Spectral model in the Band function:
------------------------------------------------------------
Parameters  : value       lower 90%   higher 90%
alpha       :    (     )
beta        :     (     )
Epeak [keV] :       (   )
Norm@50keV   :     (     )
------------------------------------------------------------

Photon flux (15-150 keV)    in  sec:  (    ) ph/cm2/s
Energy fluence (15-150 keV)             : 0 ( 0  0 ) ergs/cm2
Single BB
Spectral model blackbody:
------------------------------------------------------------
Parameters  : value    Lower 90%  Upper 90%
kT [keV]    : 16.0694  (  )
R^2/D10^2   : 3.58698E-02  (   )
(R is the radius in km and D10 is the distance to the source in units of 10 kpc)
------------------------------------------------------------
#Fit statistic : Chi-Squared =         375.33 using 59 PHA bins.
# Reduced chi-squared =         6.5847 for     57 degrees of freedom
# Null hypothesis probability =   2.117418e-48

Energy  Fluence     90% Error
[keV]   [erg/cm2]   [erg/cm2]
15- 25  6.157e-07   2.928e-08
25- 50  2.600e-06   9.268e-08
50-150  4.701e-06   2.253e-07
15-150  7.918e-06   2.156e-07
Thermal bremsstrahlung (OTTB)
Spectral model: thermal bremsstrahlung
------------------------------------------------------------
Parameters  : value         Lower 90%    Upper 90%
kT [keV]    : 200.000       (-22.9148      -200)
Norm        : 1.73150       (-0.0428522     0.0428522)
------------------------------------------------------------
#Fit statistic : Chi-Squared =          59.84 using 59 PHA bins.
# Reduced chi-squared =          1.050 for     57 degrees of freedom
# Null hypothesis probability =   3.729318e-01

Energy  Fluence     90% Error
[keV]   [erg/cm2]   [erg/cm2]
15- 25  1.388e-06   4.183e-08
25- 50  2.670e-06   7.482e-08
50-150  5.855e-06   1.641e-07
15-150  9.913e-06   2.944e-07
Double BB
Spectral model: bbodyrad<1> + bbodyrad<2>
------------------------------------------------------------
Parameters  : value         Lower 90%    Upper 90%
kT1 [keV]   : 7.54517        (-0.670889      0.70902)
R1^2/D10^2  : 0.339717        (-0.0887463      0.130759)
kT2 [keV]   : 27.2494        (-2.35292      3.01799)
R2^2/D10^2  : 4.38601E-03    (-0.00139309   0.0017645)
------------------------------------------------------------
#Fit statistic : Chi-Squared =          60.22 using 59 PHA bins.
# Reduced chi-squared =          1.095 for     55 degrees of freedom
# Null hypothesis probability =   2.925912e-01

Energy  Fluence     90% Error
[keV]   [erg/cm2]   [erg/cm2]
15- 25  1.247e-06   1.015e-07
25- 50  2.720e-06   1.511e-07
50-150  5.923e-06   4.344e-07
15-150  9.890e-06   5.632e-07
Peak spectrum fit
Power-law model
Time interval is from   -0.332 sec. to    0.668 sec.

Spectral model in power-law:
------------------------------------------------------------
Parameters  : value       lower 90%   higher 90%
Photon index: 1.09862     ( -0.104505   0.103499 )
Norm@50keV  : 3.14154E-02    ( -0.00190835   0.0019053 )
------------------------------------------------------------
#Fit statistic : Chi-Squared =          53.15 using 59 PHA bins.
# Reduced chi-squared =         0.9324 for     57 degrees of freedom
# Null hypothesis probability =   6.203525e-01

Photon flux (15-150 keV)    in 1 sec: 3.64350 ( -0.22821  0.22853 ) ph/cm2/s
Energy fluence (15-150 keV)             : 3.28632e-07 ( -2.14753e-08  2.1555e-08 ) ergs/cm2
Cutoff power-law model
Time interval is from   -0.332 sec. to    0.668 sec.
Spectral model in the cutoff power-law:
------------------------------------------------------------
Parameters  : value       lower 90%   higher 90%
Photon index: 0.799176     ( -0.428472   0.341989 )
Epeak [keV] : 231.874      (   )
Norm@50keV  : 4.27352E-02    (     )
------------------------------------------------------------
#Fit statistic : Chi-Squared =          51.47 using 59 PHA bins.
# Reduced chi-squared =         0.9190 for     56 degrees of freedom
# Null hypothesis probability =   6.469605e-01

Photon flux (15-150 keV)    in 1 sec: 3.60317 ( -0.23406  0.23429 ) ph/cm2/s
Energy fluence (15-150 keV)             : 3.25095e-07 ( -2.22782e-08  2.22012e-08 ) ergs/cm2
Band function

Time interval is from   -0.332 sec. to    0.668 sec.


Spectral model in the Band function:
------------------------------------------------------------
Parameters  : value       lower 90%   higher 90%
alpha       :    (     )
beta        :     (     )
Epeak [keV] :       (   )
Norm@50keV   :     (     )
------------------------------------------------------------

Photon flux (15-150 keV)    in  sec:  (    ) ph/cm2/s
Energy fluence (15-150 keV)             : 0 ( 0  0 ) ergs/cm2
Single BB
Spectral model blackbody:
------------------------------------------------------------
Parameters  : value    Lower 90%  Upper 90%
kT [keV]    : 21.3442  (-1.70124  1.89869)
R^2/D10^2   : 0.141240  (-0.0338165   0.0434561)
(R is the radius in km and D10 is the distance to the source in units of 10 kpc)
------------------------------------------------------------
#Fit statistic : Chi-Squared =          99.11 using 59 PHA bins.
# Reduced chi-squared =          1.739 for     57 degrees of freedom
# Null hypothesis probability =   4.633599e-04

Energy  Fluence     90% Error
[keV]   [erg/cm2]   [erg/cm2]
15- 25  1.207e-08   1.560e-09
25- 50  6.267e-08   5.505e-09
50-150  2.131e-07   2.015e-08
15-150  2.878e-07   2.065e-08
Thermal bremsstrahlung (OTTB)
Spectral model: thermal bremsstrahlung
------------------------------------------------------------
Parameters  : value         Lower 90%    Upper 90%
kT [keV]    : 200.000       (-9.07239      -200)
Norm        : 15.0546       (-0.939847     0.939847)
------------------------------------------------------------
#Fit statistic : Chi-Squared =         104.69 using 59 PHA bins.
# Reduced chi-squared =         1.8367 for     57 degrees of freedom
# Null hypothesis probability =   1.214563e-04

Energy  Fluence     90% Error
[keV]   [erg/cm2]   [erg/cm2]
15- 25  3.750e-08   2.660e-09
25- 50  7.213e-08   5.940e-09
50-150  1.582e-07   3.300e-08
15-150  2.678e-07   4.515e-08
Double BB
Spectral model: bbodyrad<1> + bbodyrad<2>
------------------------------------------------------------
Parameters  : value         Lower 90%    Upper 90%
kT1 [keV]   : 8.23156        (-1.75138      2.1323)
R1^2/D10^2  : 1.60951        (-0.797715      1.87656)
kT2 [keV]   : 33.1665        (-5.43916      9.61547)
R2^2/D10^2  : 2.93653E-02    (-0.0162622   0.0241451)
------------------------------------------------------------
#Fit statistic : Chi-Squared =          49.65 using 59 PHA bins.
# Reduced chi-squared =         0.9027 for     55 degrees of freedom
# Null hypothesis probability =   6.785260e-01

Energy  Fluence     90% Error
[keV]   [erg/cm2]   [erg/cm2]
15- 25  2.487e-08   9.179e-09
25- 50  6.740e-08   1.660e-08
50-150  2.363e-07   7.035e-08
15-150  3.286e-07   8.645e-08
Pre-slew spectrum (Pre-slew PHA with pre-slew DRM)
Power-law model
Spectral model in power-law:
------------------------------------------------------------
Parameters  : value       lower 90%   higher 90%
Photon index: 1.44365     ( -0.0550475   0.0549411 )
Norm@50keV  : 3.89529E-03    ( -0.000116192   0.00011619 )
------------------------------------------------------------
#Fit statistic : Chi-Squared =          66.07 using 59 PHA bins.
# Reduced chi-squared =          1.159 for     57 degrees of freedom
# Null hypothesis probability =   1.922042e-01

Photon flux (15-150 keV)    in 175 sec: 0.479289 ( -0.0157844  0.0158333 ) ph/cm2/s
Energy fluence (15-150 keV)             : 6.53082e-06 ( -2.0457e-07  2.0485e-07 ) ergs/cm2
Cutoff power-law model
Spectral model in the cutoff power-law:
------------------------------------------------------------
Parameters  : value       lower 90%   higher 90%
Photon index: 0.987859     ( -0.237353   0.225495 )
Epeak [keV] : 122.548      ( -24.0577 63.6598 )
Norm@50keV  : 6.28203E-03    ( -0.00129042   0.00171938 )
------------------------------------------------------------
#Fit statistic : Chi-Squared =          53.56 using 59 PHA bins.
# Reduced chi-squared =         0.9565 for     56 degrees of freedom
# Null hypothesis probability =   5.676334e-01

Photon flux (15-150 keV)    in 175 sec: 0.464239 ( -0.017193  0.017263 ) ph/cm2/s
Energy fluence (15-150 keV)             : 6.34678e-06 ( -2.25593e-07  2.24945e-07 ) ergs/cm2
Band function
Spectral model in the Band function:
------------------------------------------------------------
Parameters  : value       lower 90%   higher 90%
alpha       :    (     )
beta        :     (     )
Epeak [keV] :       (   )
Norm@50keV   :     (     )
------------------------------------------------------------

Photon flux (15-150 keV)    in  sec:  (    ) ph/cm2/s
Energy fluence (15-150 keV)             : 0 ( 0  0 ) ergs/cm2
S(25-50 keV) vs. S(50-100 keV) plot
S(25-50 keV)  = 2.61e-06
S(50-100 keV) = 3.51e-06
T90 vs. Hardness ratio plot
T90                                   = 223.96799993515 sec.
Hardness ratio (energy fluence ratio) = 1.34483
Color vs. Color plot

Count Ratio  (25-50 keV) / (15-25 keV) = 1.37005
Count Ratio (50-100 keV) / (15-25 keV) = 1.00309
Mask shadow pattern
IMX = -5.856277205807686E-01, IMY = 3.366015288200561E-02
TIME vs. PHA plot around the trigger time

TIME vs. DetID plot around the trigger time
100 us light curve (15-350 keV)
Spacecraft aspect plot

Bright source in the pre-burst/pre-slew/post-slew images
Pre-burst image of 15-350 keV band
Time interval of the image:
Pre-slew background subtracted image of 15-350 keV band
Time interval of the image:
-158.203400 16.796600

# RAcent  DECcent POSerr Theta    Phi  PeakCts   SNR AngSep     Name
#  [deg]    [deg]    ['] [deg]  [deg]                   [']
170.3036 -60.6104    2.1  32.3  -20.0   1.2916   5.5    0.8	Cen X-3
186.5955 -62.6226    5.1  29.0   -5.7   0.5148   2.2    9.0	GX 301-2
215.3303 -62.6987    2.0  26.3   22.1   1.3681   5.9 ------	UNKNOWN
357.5116 -57.9551    0.3  30.4 -176.7  10.2658  43.5 ------	UNKNOWN
Post-slew image of 15-350 keV band
Time interval of the image:
71.996590 842.808900

# RAcent  DECcent POSerr Theta    Phi  PeakCts   SNR AngSep     Name
#  [deg]    [deg]    ['] [deg]  [deg]                   [']
345.6194 -40.7620    2.9  18.8  162.8   2.1724   4.0 ------	UNKNOWN
 56.3049 -39.6568    3.7  41.2  -78.2   8.7968   3.1 ------	UNKNOWN
Plot creation:
Fri Jul  6 14:34:33 EDT 2018