Estimated redshift from machine learning (Ukwatta et al. 2016) - may take a few minute to calcaulte
Image
Pre-slew 15.0-350.0 keV image (Event data)

#   RAcent    DECcent   POSerr    Theta     Phi              Peak Cts       SNR   Name
  212.6047   -11.6384   0.0191    47.5446    -3.2952         3.2970167     10.082 TRIG_00846299

Foreground time interval of the image:
  0.260 133.044 (delta_t = 132.784 [sec])
Background time interval of the image:
-239.000   0.260 (delta_t = 239.260 [sec])
Lightcurves
Notes:
- 1) The mask-weighted light curves are using the flight position.
- 2) Multiple plots of different time binning/intervals are shown to cover all scenarios of short/long GRBs, rate/image triggers, and real/false positives.
- 3) For all the mask-weighted lightcurves, the y-axis units are counts/sec/det where a det is 0.4 x 0.4 = 0.16 sq cm.
- 4) The verticle lines correspond to following: green dotted lines are T50 interval, black dotted lines are T90 interval, blue solid line(s) is a spacecraft slew start time, and orange solid line(s) is a spacecraft slew end time.
- 5) Time of each bin is in the middle of the bin.
1 s binning
From T0-310 s to T0+310 s

From T100_start - 20 s to T100_end + 30 s

Full time interval

64 ms binning
Full time interval

From T100_start to T100_end

From T0-5 sec to T0+5 sec

16 ms binning
From T100_start-5 s to T100_start+5 s

8 ms binning
From T100_start-3 s to T100_start+3 s

2 ms binning
From T100_start-1 s to T100_start+1 s
SN=5 or 10 sec. binning (whichever binning is satisfied first)

SN=5 or 10 sec. binning (T < 200 sec)

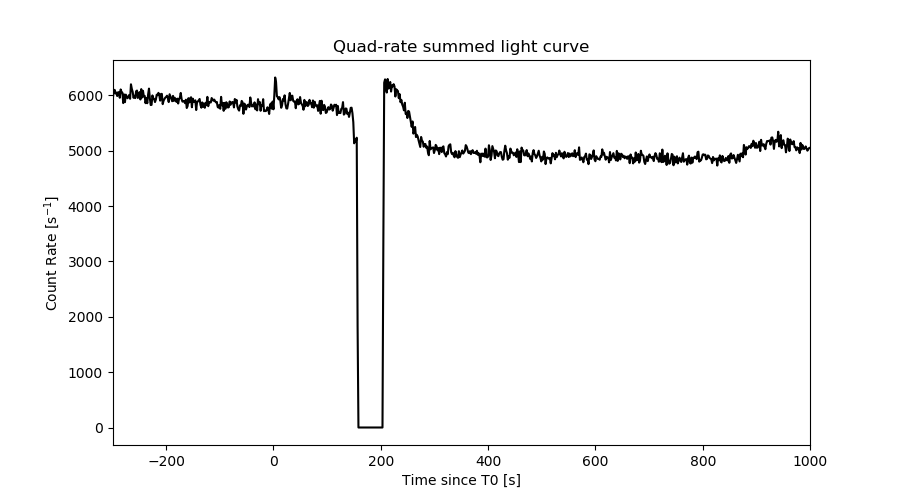
Quad-rate summed light curves (from T0-300s to T0+1000s)
Spectral Evolution

Spectra
Notes:
- 1) The fitting includes the systematic errors.
- 2) When the burst includes telescope slew time periods, the fitting uses an average response file made from multiple 5-s response files through out the slew time plus single time preiod for the non-slew times, and weighted by the total counts in the corresponding time period using addrmf. An average response file is needed becuase a spectral fit using the pre-slew DRM will introduce some errors in both a spectral shape and a normalization if the PHA file contains a lot of the slew/post-slew time interval.
- 3) For fits to more complicated models (e.g. a power-law over a cutoff power-law), the BAT team has decided to require a chi-square improvement of more than 6 for each extra dof.
Time averaged spectrum fit using the average DRM
Power-law model

Time interval is from    0.260 sec. to  133.044 sec.

Spectral model in power-law:
------------------------------------------------------------
Parameters  : value       lower 90%   higher 90%
Photon index: 1.62525     ( -0.216248   0.218807 )
Norm@50keV  : 1.64702E-03    ( -0.00020974   0.000209006 )
------------------------------------------------------------
#Fit statistic : Chi-Squared =          52.32 using 59 PHA bins.
# Reduced chi-squared =         0.9179 for     57 degrees of freedom
# Null hypothesis probability =   6.508868e-01

Photon flux (15-150 keV)    in 132.8 sec: 0.213347 ( -0.028502  0.028673 ) ph/cm2/s
Energy fluence (15-150 keV)             : 2.03985e-06 ( -2.70888e-07  2.7226e-07 ) ergs/cm2
Cutoff power-law model

Time interval is from    0.260 sec. to  133.044 sec.
Spectral model in the cutoff power-law:
------------------------------------------------------------
Parameters  : value       lower 90%   higher 90%
Photon index: 1.12341     ( -1.03814   0.668672 )
Epeak [keV] : 90.8202      ( -38.0095 -90.8203 )
Norm@50keV  : 2.89880E-03    ( -0.000927615   0.00612164 )
------------------------------------------------------------
#Fit statistic : Chi-Squared =          51.36 using 59 PHA bins.
# Reduced chi-squared =         0.9171 for     56 degrees of freedom
# Null hypothesis probability =   6.509487e-01

Photon flux (15-150 keV)    in 132.8 sec: 0.208131 ( -0.029936  0.030037 ) ph/cm2/s
Energy fluence (15-150 keV)             : 1.98503e-06 ( -2.90698e-07  2.89011e-07 ) ergs/cm2
Band function

Time interval is from    0.260 sec. to  133.044 sec.


Spectral model in the Band function:
------------------------------------------------------------
Parameters  : value       lower 90%   higher 90%
alpha       :    (     )
beta        :     (     )
Epeak [keV] :       (   )
Norm@50keV   :     (     )
------------------------------------------------------------

Photon flux (15-150 keV)    in  sec:  (    ) ph/cm2/s
Energy fluence (15-150 keV)             : 0 ( 0  0 ) ergs/cm2
Single BB

Spectral model blackbody:
------------------------------------------------------------
Parameters  : value    Lower 90%  Upper 90%
kT [keV]    : 15.1579  (-2.14654  2.53338)
R^2/D10^2   : 2.27177E-02  (-0.00980763   0.0168952)
(R is the radius in km and D10 is the distance to the source in units of 10 kpc)
------------------------------------------------------------
#Fit statistic : Chi-Squared =          63.60 using 59 PHA bins.
# Reduced chi-squared =          1.116 for     57 degrees of freedom
# Null hypothesis probability =   2.552810e-01

Energy  Fluence     90% Error
[keV]   [erg/cm2]   [erg/cm2]
15- 25  1.449e-07   3.572e-08
25- 50  5.812e-07   9.993e-08
50-150  9.130e-07   2.110e-07
15-150  1.639e-06   2.870e-07
Thermal bremsstrahlung (OTTB)

Spectral model: thermal bremsstrahlung
------------------------------------------------------------
Parameters  : value         Lower 90%    Upper 90%
kT [keV]    : 170.134       (-70.4875      -169.058)
Norm        : 0.870666       (-0.120106     0.144548)
------------------------------------------------------------
#Fit statistic : Chi-Squared =          51.43 using 59 PHA bins.
# Reduced chi-squared =         0.9023 for     57 degrees of freedom
# Null hypothesis probability =   6.831677e-01

Energy  Fluence     90% Error
[keV]   [erg/cm2]   [erg/cm2]
15- 25  2.934e-07   1.629e-07
25- 50  5.534e-07   2.977e-07
50-150  1.148e-06   6.387e-07
15-150  1.995e-06   1.078e-06
Double BB
Spectral model: bbodyrad<1> + bbodyrad<2>
------------------------------------------------------------
Parameters  : value         Lower 90%    Upper 90%
kT1 [keV]   : 6.37226        (-2.62948      4.04114)
R1^2/D10^2  : 0.292696        (-0.228717      2.19693)
kT2 [keV]   : 22.2479        (-5.52282      21.4944)
R2^2/D10^2  : 4.57917E-03    (-0.00419402   0.00971332)
------------------------------------------------------------
#Fit statistic : Chi-Squared =          51.61 using 59 PHA bins.
# Reduced chi-squared =         0.9384 for     55 degrees of freedom
# Null hypothesis probability =   6.049515e-01

Energy  Fluence     90% Error
[keV]   [erg/cm2]   [erg/cm2]
15- 25  2.829e-07   1.575e-07
25- 50  5.529e-07   2.760e-07
50-150  1.121e-06   6.280e-07
15-150  1.957e-06   1.015e-06
Peak spectrum fit
Power-law model
Time interval is from    3.264 sec. to    4.264 sec.

Spectral model in power-law:
------------------------------------------------------------
Parameters  : value       lower 90%   higher 90%
Photon index: 1.74466     ( -0.704125   0.853307 )
Norm@50keV  : 5.90895E-03    ( -0.00273216   0.00254552 )
------------------------------------------------------------
#Fit statistic : Chi-Squared =          42.32 using 59 PHA bins.
# Reduced chi-squared =         0.7424 for     57 degrees of freedom
# Null hypothesis probability =   9.265787e-01

Photon flux (15-150 keV)    in 1 sec: 0.797461 ( -0.328344  0.331099 ) ph/cm2/s
Energy fluence (15-150 keV)             : 5.45494e-08 ( -2.42475e-08  2.51784e-08 ) ergs/cm2
Cutoff power-law model

Time interval is from    3.264 sec. to    4.264 sec.
Spectral model in the cutoff power-law:
------------------------------------------------------------
Parameters  : value       lower 90%   higher 90%
Photon index: 0.808361     ( -8.09071   1.42233 )
Epeak [keV] : 69.6172      ( -69.7456 -69.7456 )
Norm@50keV  : 1.62446E-02    ( -0.0162466   8.91626 )
------------------------------------------------------------
#Fit statistic : Chi-Squared =          41.98 using 59 PHA bins.
# Reduced chi-squared =         0.7497 for     56 degrees of freedom
# Null hypothesis probability =   9.177562e-01

Photon flux (15-150 keV)    in 1 sec: 0.759325 (    ) ph/cm2/s
Energy fluence (15-150 keV)             : 5.31153e-08 ( -2.32078e-08  2.55005e-08 ) ergs/cm2
Band function

Time interval is from    3.264 sec. to    4.264 sec.


Spectral model in the Band function:
------------------------------------------------------------
Parameters  : value       lower 90%   higher 90%
alpha       :    (     )
beta        :     (     )
Epeak [keV] :       (   )
Norm@50keV   :     (     )
------------------------------------------------------------

Photon flux (15-150 keV)    in  sec:  (    ) ph/cm2/s
Energy fluence (15-150 keV)             : 0 ( 0  0 ) ergs/cm2
Single BB

Spectral model blackbody:
------------------------------------------------------------
Parameters  : value    Lower 90%  Upper 90%
kT [keV]    : 16.7066  (-6.17426  8.75247)
R^2/D10^2   : 6.15830E-02  (-0.0615837   0.240297)
(R is the radius in km and D10 is the distance to the source in units of 10 kpc)
------------------------------------------------------------
#Fit statistic : Chi-Squared =          42.69 using 59 PHA bins.
# Reduced chi-squared =         0.7490 for     57 degrees of freedom
# Null hypothesis probability =   9.204712e-01

Energy  Fluence     90% Error
[keV]   [erg/cm2]   [erg/cm2]
15- 25  3.517e-09   2.367e-09
25- 50  1.534e-08   9.980e-09
50-150  3.040e-08   2.105e-08
15-150  4.926e-08   3.142e-08
Thermal bremsstrahlung (OTTB)

Spectral model: thermal bremsstrahlung
------------------------------------------------------------
Parameters  : value         Lower 90%    Upper 90%
kT [keV]    : 148.300       (-101.67      -137.178)
Norm        : 3.20313       (-1.39774     2.6186)
------------------------------------------------------------
#Fit statistic : Chi-Squared =          42.11 using 59 PHA bins.
# Reduced chi-squared =         0.7387 for     57 degrees of freedom
# Null hypothesis probability =   9.299040e-01

Energy  Fluence     90% Error
[keV]   [erg/cm2]   [erg/cm2]
15- 25  7.989e-09   4.918e-09
25- 50  1.524e-08   9.280e-09
50-150  3.265e-08   2.016e-08
15-150  5.588e-08   3.413e-08
Double BB

Spectral model: bbodyrad<1> + bbodyrad<2>
------------------------------------------------------------
Parameters  : value         Lower 90%    Upper 90%
kT1 [keV]   : 3.81668        (-3.76431      15.6514)
R1^2/D10^2  : 10.9970        (-11.5467      69.7937)
kT2 [keV]   : 19.6116        (-7.09873      15.3362)
R2^2/D10^2  : 3.08840E-02    (-0.0314062   0.126762)
------------------------------------------------------------
#Fit statistic : Chi-Squared =          40.37 using 59 PHA bins.
# Reduced chi-squared =         0.7339 for     55 degrees of freedom
# Null hypothesis probability =   9.302315e-01

Energy  Fluence     90% Error
[keV]   [erg/cm2]   [erg/cm2]
15- 25  1.024e-08   6.645e-09
25- 50  1.384e-08   7.830e-09
50-150  3.227e-08   2.058e-08
15-150  5.635e-08   3.237e-08
Pre-slew spectrum (Pre-slew PHA with pre-slew DRM)
Power-law model

Spectral model in power-law:
------------------------------------------------------------
Parameters  : value       lower 90%   higher 90%
Photon index: 1.62525     ( -0.216248   0.218807 )
Norm@50keV  : 1.64702E-03    ( -0.00020974   0.000209006 )
------------------------------------------------------------
#Fit statistic : Chi-Squared =          52.32 using 59 PHA bins.
# Reduced chi-squared =         0.9179 for     57 degrees of freedom
# Null hypothesis probability =   6.508868e-01

Photon flux (15-150 keV)    in 132.8 sec: 0.213340 ( -0.0285001  0.0286695 ) ph/cm2/s
Energy fluence (15-150 keV)             : 2.03954e-06 ( -2.70847e-07  2.72316e-07 ) ergs/cm2
Cutoff power-law model
Spectral model in the cutoff power-law:
------------------------------------------------------------
Parameters  : value       lower 90%   higher 90%
Photon index: 1.12341     ( -1.03814   0.668672 )
Epeak [keV] : 90.8204      ( -38.0117 -90.8204 )
Norm@50keV  : 2.89880E-03    ( -0.000927614   0.00612164 )
------------------------------------------------------------
#Fit statistic : Chi-Squared =          51.36 using 59 PHA bins.
# Reduced chi-squared =         0.9171 for     56 degrees of freedom
# Null hypothesis probability =   6.509487e-01

Photon flux (15-150 keV)    in 132.8 sec: 0.208104 ( -0.029926  0.030009 ) ph/cm2/s
Energy fluence (15-150 keV)             : 1.98575e-06 ( -2.90819e-07  2.89225e-07 ) ergs/cm2
Band function

Spectral model in the Band function:
------------------------------------------------------------
Parameters  : value       lower 90%   higher 90%
alpha       :    (     )
beta        :     (     )
Epeak [keV] :       (   )
Norm@50keV   :     (     )
------------------------------------------------------------

Photon flux (15-150 keV)    in  sec:  (    ) ph/cm2/s
Energy fluence (15-150 keV)             : 0 ( 0  0 ) ergs/cm2
S(25-50 keV) vs. S(50-100 keV) plot

S(25-50 keV)  = 5.35e-07
S(50-100 keV) = 6.93e-07
T90 vs. Hardness ratio plot

T90                                   = 106.783999919891 sec.
Hardness ratio (energy fluence ratio) = 1.29533
Color vs. Color plot

Count Ratio  (25-50 keV) / (15-25 keV) = 1.28447
Count Ratio (50-100 keV) / (15-25 keV) = 1.21453
Mask shadow pattern

IMX = 1.091209393467349E+00, IMY = 6.282735345596860E-02
TIME vs. PHA plot around the trigger time

TIME vs. DetID plot around the trigger time

100 us light curve (15-350 keV)
Spacecraft aspect plot

Bright source in the pre-burst/pre-slew/post-slew images
Pre-burst image of 15-350 keV band
Time interval of the image:
-239.000000 0.260000

# RAcent  DECcent POSerr Theta    Phi  PeakCts   SNR AngSep     Name
#  [deg]    [deg]    ['] [deg]  [deg]                   [']
170.4856 -60.5900    4.4  38.8  -92.5   2.7541   2.7    5.4	Cen X-3
186.7897 -62.7882    3.7  30.8  -92.9   1.2443   3.1    3.8	GX 301-2
244.9918 -15.6305    0.6  36.8   42.1   8.7873  19.4    0.9	Sco X-1
256.0225 -38.0265    3.8  17.0   76.3   0.8129   3.1   11.1	4U 1700-377
256.4310 -36.3873    3.5  18.6   74.8   0.9121   3.3    2.2	GX 349+2
262.9824 -24.6580   14.9  31.6   75.3   0.3449   0.8    5.4	GX 1+4
264.6674 -44.2715   13.7  16.4  108.0  -0.2041  -0.8   11.2	4U 1735-44
270.1614 -25.1713    4.6  34.0   86.4   1.3921   2.5    8.7	GX 5-1
270.2266 -25.6206   16.9  33.7   86.9  -0.4022  -0.7    8.4	GRS 1758-258
275.8907 -30.1774    5.2  32.7   99.2  -1.0758  -2.2   11.5	H1820-303
262.8867 -33.8552   11.2  23.3   84.3   0.3257   1.0    5.3	GX 354-0
310.7054 -62.5079    3.1  35.9  172.3   1.2984   3.8 ------	UNKNOWN
349.7441 -71.2545    2.7  46.1 -166.3   1.9625   4.3 ------	UNKNOWN
215.2671 -62.7585    2.6  17.9  -97.1   1.1097   4.4 ------	UNKNOWN
 32.1744 -68.2443    4.1  57.2 -154.1   4.5146   2.8 ------	UNKNOWN
 87.2551 -76.4909    3.1  50.2 -133.8   6.4571   3.8 ------	UNKNOWN
Pre-slew background subtracted image of 15-350 keV band
Time interval of the image:
0.260000 133.044000

# RAcent  DECcent POSerr Theta    Phi  PeakCts   SNR AngSep     Name
#  [deg]    [deg]    ['] [deg]  [deg]                   [']
170.4747 -60.7170    4.5  38.7  -92.7  -1.3732  -2.6    7.3	Cen X-3
186.3052 -62.8207   11.2  31.0  -93.0   0.2828   1.0   10.1	GX 301-2
244.9706 -15.8117   28.7  36.6   42.1   0.1347   0.4   10.3	Sco X-1
256.2072 -37.8041    9.8  17.2   76.3  -0.2134  -1.2   10.7	4U 1700-377
256.4477 -36.4955    4.7  18.5   74.9  -0.4736  -2.5    4.4	GX 349+2
262.8893 -24.8211   29.7  31.4   75.2  -0.1205  -0.4    7.9	GX 1+4
264.6948 -44.2424    0.0  16.4  107.9   0.1489   0.8   12.6	4U 1735-44
270.1486 -25.0390   20.5  34.1   86.3  -0.2054  -0.6    7.7	GX 5-1
270.3428 -25.8470   11.1  33.5   87.3  -0.3623  -1.0    6.6	GRS 1758-258
275.7186 -30.4367    0.0  32.4   99.3  -0.7175  -2.2   11.5	H1820-303
263.2054 -33.8268    4.1  23.5   84.8  -0.6043  -2.8   10.8	GX 354-0
216.3679 -17.4226    1.9  40.8   -2.0   1.5407   6.1 ------	UNKNOWN
212.6044 -11.6387    1.1  47.5   -3.3   3.2943  10.1 ------	UNKNOWN
219.2599 -33.3106    2.3  25.6  -12.3   0.8044   5.0 ------	UNKNOWN
356.3107 -59.6778    2.8  55.8 -175.1   3.1511   4.1 ------	UNKNOWN
Post-slew image of 15-350 keV band
Time interval of the image:
300.300580 863.800580

# RAcent  DECcent POSerr Theta    Phi  PeakCts   SNR AngSep     Name
#  [deg]    [deg]    ['] [deg]  [deg]                   [']
254.2425  35.3991    4.8  15.8  144.3  -0.8851  -2.4   11.1	Her X-1
299.7539  35.1378   15.2  31.1   44.8   0.3978   0.8    8.9	Cyg X-1
308.1580  40.9555    5.3  33.0   28.6   1.1631   2.2    2.2	Cyg X-3
326.2534  38.1991   28.3  46.1   19.7   0.3118   0.4    8.3	Cyg X-2
336.6213  34.0717    2.4  55.2   17.1   9.4242   4.7 ------	UNKNOWN
233.9879   7.4959    2.3  48.6  158.8   6.4051   5.0 ------	UNKNOWN
294.5688  38.5031    2.9  25.8   44.8   1.7148   4.0 ------	UNKNOWN
188.9494  49.1184    2.9  45.4 -121.2   8.6854   3.9 ------	UNKNOWN
Plot creation:
Mon Aug  6 22:35:30 EDT 2018