Estimated redshift from machine learning (Ukwatta et al. 2016) - may take a few minute to calcaulte
Image
Pre-slew 15.0-350.0 keV image (Event data)

#   RAcent    DECcent   POSerr    Theta     Phi              Peak Cts       SNR   Name
  181.6826    66.0448   0.0065    20.9124   153.2869         2.4240792     29.696 TRIG_00846395

Foreground time interval of the image:
-15.920  27.269 (delta_t =  43.189 [sec])
Background time interval of the image:
-574.931 -556.881 (delta_t =  18.050 [sec])
-239.632 -15.920 (delta_t = 223.712 [sec])
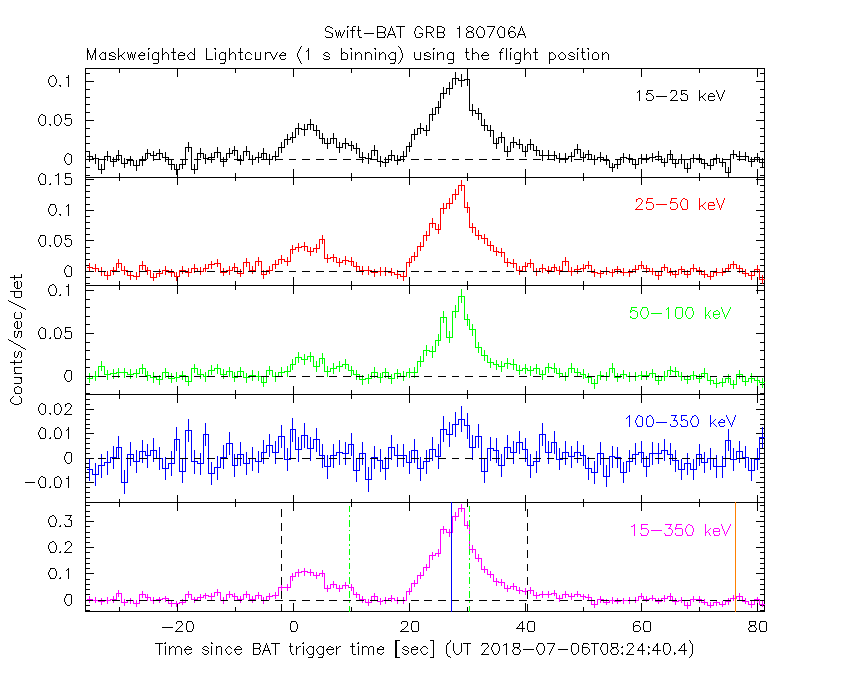
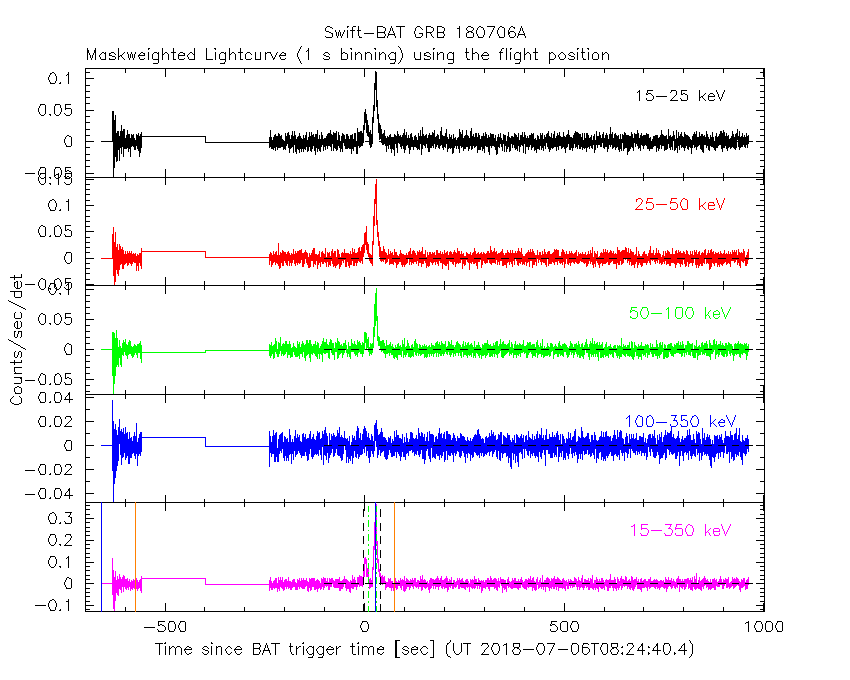
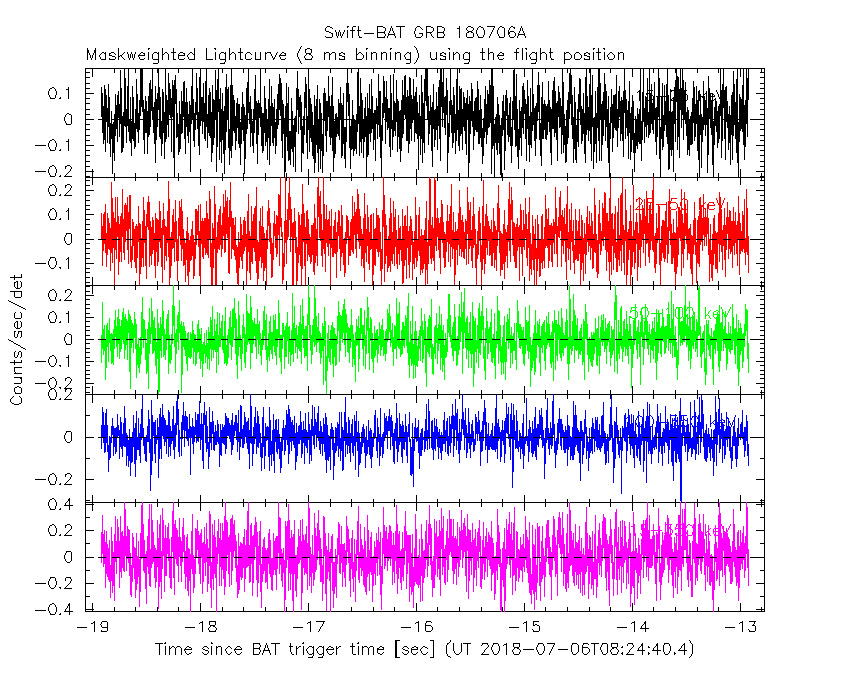
Lightcurves
Notes:
- 1) The mask-weighted light curves are using the flight position.
- 2) Multiple plots of different time binning/intervals are shown to cover all scenarios of short/long GRBs, rate/image triggers, and real/false positives.
- 3) For all the mask-weighted lightcurves, the y-axis units are counts/sec/det where a det is 0.4 x 0.4 = 0.16 sq cm.
- 4) The verticle lines correspond to following: green dotted lines are T50 interval, black dotted lines are T90 interval, blue solid line(s) is a spacecraft slew start time, and orange solid line(s) is a spacecraft slew end time.
- 5) Time of each bin is in the middle of the bin.
1 s binning
From T0-310 s to T0+310 s

From T100_start - 20 s to T100_end + 30 s
Full time interval
64 ms binning
Full time interval

From T100_start to T100_end

From T0-5 sec to T0+5 sec

16 ms binning
From T100_start-5 s to T100_start+5 s

Blue+Cyan dotted lines: Time interval of the scaled map
From 0.000000 to 2.048000
8 ms binning
From T100_start-3 s to T100_start+3 s
Blue+Cyan dotted lines: Time interval of the scaled map
From 0.000000 to 2.048000
2 ms binning
From T100_start-1 s to T100_start+1 s

Blue+Cyan dotted lines: Time interval of the scaled map
From 0.000000 to 2.048000
SN=5 or 10 sec. binning (whichever binning is satisfied first)

SN=5 or 10 sec. binning (T < 200 sec)

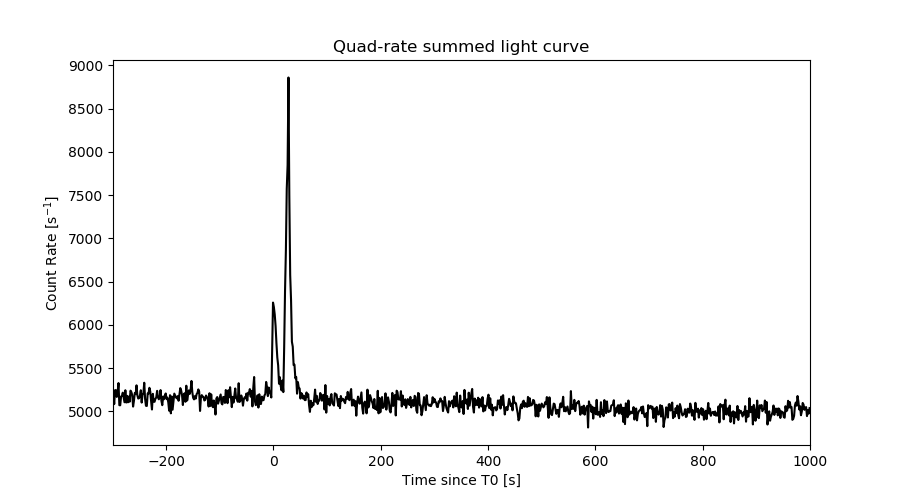
Quad-rate summed light curves (from T0-300s to T0+1000s)
Spectral Evolution

Spectra
Notes:
- 1) The fitting includes the systematic errors.
- 2) When the burst includes telescope slew time periods, the fitting uses an average response file made from multiple 5-s response files through out the slew time plus single time preiod for the non-slew times, and weighted by the total counts in the corresponding time period using addrmf. An average response file is needed becuase a spectral fit using the pre-slew DRM will introduce some errors in both a spectral shape and a normalization if the PHA file contains a lot of the slew/post-slew time interval.
- 3) For fits to more complicated models (e.g. a power-law over a cutoff power-law), the BAT team has decided to require a chi-square improvement of more than 6 for each extra dof.
Time averaged spectrum fit using the average DRM
Power-law model

Time interval is from  -15.920 sec. to   51.168 sec.

Spectral model in power-law:
------------------------------------------------------------
Parameters  : value       lower 90%   higher 90%
Photon index: 1.90941     ( -0.0787018   0.0796954 )
Norm@50keV  : 3.86718E-03    ( -0.000173676   0.000172558 )
------------------------------------------------------------
#Fit statistic : Chi-Squared =          57.69 using 59 PHA bins.
# Reduced chi-squared =          1.012 for     57 degrees of freedom
# Null hypothesis probability =   4.496416e-01

Photon flux (15-150 keV)    in 67.09 sec: 0.557246 ( -0.023687  0.023749 ) ph/cm2/s
Energy fluence (15-150 keV)             : 2.38593e-06 ( -1.05441e-07  1.06013e-07 ) ergs/cm2
Cutoff power-law model

Time interval is from  -15.920 sec. to   51.168 sec.
Spectral model in the cutoff power-law:
------------------------------------------------------------
Parameters  : value       lower 90%   higher 90%
Photon index: 1.51932     ( -0.343696   0.317317 )
Epeak [keV] : 57.0218      ( -10.5804 46.1234 )
Norm@50keV  : 6.21238E-03    ( -0.00194523   0.00315625 )
------------------------------------------------------------
#Fit statistic : Chi-Squared =          53.21 using 59 PHA bins.
# Reduced chi-squared =         0.9502 for     56 degrees of freedom
# Null hypothesis probability =   5.811268e-01

Photon flux (15-150 keV)    in 67.09 sec: 0.542837 ( -0.026253  0.026297 ) ph/cm2/s
Energy fluence (15-150 keV)             : 2.29534e-06 ( -1.26801e-07  1.27513e-07 ) ergs/cm2
Band function

Time interval is from  -15.920 sec. to   51.168 sec.


Spectral model in the Band function:
------------------------------------------------------------
Parameters  : value       lower 90%   higher 90%
alpha       :    (     )
beta        :     (     )
Epeak [keV] :       (   )
Norm@50keV   :     (     )
------------------------------------------------------------

Photon flux (15-150 keV)    in  sec:  (    ) ph/cm2/s
Energy fluence (15-150 keV)             : 0 ( 0  0 ) ergs/cm2
Single BB

Spectral model blackbody:
------------------------------------------------------------
Parameters  : value    Lower 90%  Upper 90%
kT [keV]    : 11.7386  (  )
R^2/D10^2   : 0.135574  (   )
(R is the radius in km and D10 is the distance to the source in units of 10 kpc)
------------------------------------------------------------
#Fit statistic : Chi-Squared =         171.23 using 59 PHA bins.
# Reduced chi-squared =         3.0041 for     57 degrees of freedom
# Null hypothesis probability =   2.337386e-13

Energy  Fluence     90% Error
[keV]   [erg/cm2]   [erg/cm2]
15- 25  2.645e-07   2.033e-08
25- 50  8.110e-07   3.858e-08
50-150  6.619e-07   6.310e-08
15-150  1.737e-06   7.413e-08
Thermal bremsstrahlung (OTTB)

Spectral model: thermal bremsstrahlung
------------------------------------------------------------
Parameters  : value         Lower 90%    Upper 90%
kT [keV]    : 84.9114       (-11.5748      14.6974)
Norm        : 2.51881       (-0.166306     0.182377)
------------------------------------------------------------
#Fit statistic : Chi-Squared =          54.27 using 59 PHA bins.
# Reduced chi-squared =         0.9520 for     57 degrees of freedom
# Null hypothesis probability =   5.783224e-01

Energy  Fluence     90% Error
[keV]   [erg/cm2]   [erg/cm2]
15- 25  4.399e-07   2.784e-08
25- 50  7.344e-07   2.751e-08
50-150  1.078e-06   1.023e-07
15-150  2.253e-06   1.141e-07
Double BB

Spectral model: bbodyrad<1> + bbodyrad<2>
------------------------------------------------------------
Parameters  : value         Lower 90%    Upper 90%
kT1 [keV]   : 5.73657        (-0.840182      0.969555)
R1^2/D10^2  : 1.35268        (-0.579938      1.15787)
kT2 [keV]   : 19.2943        (-2.36607      3.43997)
R2^2/D10^2  : 1.59258E-02    (-0.00775152   0.0114331)
------------------------------------------------------------
#Fit statistic : Chi-Squared =          57.04 using 59 PHA bins.
# Reduced chi-squared =          1.037 for     55 degrees of freedom
# Null hypothesis probability =   3.990965e-01

Energy  Fluence     90% Error
[keV]   [erg/cm2]   [erg/cm2]
15- 25  4.487e-07   6.951e-08
25- 50  7.129e-07   7.977e-08
50-150  1.063e-06   1.577e-07
15-150  2.224e-06   3.006e-07
Peak spectrum fit
Power-law model

Time interval is from   27.824 sec. to   28.824 sec.

Spectral model in power-law:
------------------------------------------------------------
Parameters  : value       lower 90%   higher 90%
Photon index: 1.70298     ( -0.114163   0.116808 )
Norm@50keV  : 2.36545E-02    ( -0.00173064   0.00171535 )
------------------------------------------------------------
#Fit statistic : Chi-Squared =          54.16 using 59 PHA bins.
# Reduced chi-squared =         0.9501 for     57 degrees of freedom
# Null hypothesis probability =   5.824869e-01

Photon flux (15-150 keV)    in 1 sec: 3.14499 ( -0.21153  0.21164 ) ph/cm2/s
Energy fluence (15-150 keV)             : 2.18993e-07 ( -1.67516e-08  1.69027e-08 ) ergs/cm2
Cutoff power-law model

Time interval is from   27.824 sec. to   28.824 sec.
Spectral model in the cutoff power-law:
------------------------------------------------------------
Parameters  : value       lower 90%   higher 90%
Photon index: 0.994779     ( -0.541976   0.481162 )
Epeak [keV] : 67.0482      ( -12.5355 43.1325 )
Norm@50keV  : 5.61007E-02    ( -0.0244647   0.051373 )
------------------------------------------------------------
#Fit statistic : Chi-Squared =          47.52 using 59 PHA bins.
# Reduced chi-squared =         0.8485 for     56 degrees of freedom
# Null hypothesis probability =   7.829541e-01

Photon flux (15-150 keV)    in 1 sec: 3.06011 ( -0.21957  0.21918 ) ph/cm2/s
Energy fluence (15-150 keV)             : 2.07778e-07 ( -1.83605e-08  1.853e-08 ) ergs/cm2
Band function

Time interval is from   27.824 sec. to   28.824 sec.


Spectral model in the Band function:
------------------------------------------------------------
Parameters  : value       lower 90%   higher 90%
alpha       :    (     )
beta        :     (     )
Epeak [keV] :       (   )
Norm@50keV   :     (     )
------------------------------------------------------------

Photon flux (15-150 keV)    in  sec:  (    ) ph/cm2/s
Energy fluence (15-150 keV)             : 0 ( 0  0 ) ergs/cm2
Single BB

Spectral model blackbody:
------------------------------------------------------------
Parameters  : value    Lower 90%  Upper 90%
kT [keV]    : 12.9606  (-1.0248  1.10913)
R^2/D10^2   : 0.587940  (-0.151063   0.20366)
(R is the radius in km and D10 is the distance to the source in units of 10 kpc)
------------------------------------------------------------
#Fit statistic : Chi-Squared =          85.02 using 59 PHA bins.
# Reduced chi-squared =          1.492 for     57 degrees of freedom
# Null hypothesis probability =   9.455654e-03

Energy  Fluence     90% Error
[keV]   [erg/cm2]   [erg/cm2]
15- 25  2.095e-08   2.430e-09
25- 50  7.191e-08   5.230e-09
50-150  7.623e-08   1.121e-08
15-150  1.691e-07   1.345e-08
Thermal bremsstrahlung (OTTB)

Spectral model: thermal bremsstrahlung
------------------------------------------------------------
Parameters  : value         Lower 90%    Upper 90%
kT [keV]    : 127.996       (-31.5117      46.4154)
Norm        : 13.2547       (-1.05835     1.25287)
------------------------------------------------------------
#Fit statistic : Chi-Squared =          48.48 using 59 PHA bins.
# Reduced chi-squared =         0.8505 for     57 degrees of freedom
# Null hypothesis probability =   7.818089e-01

Energy  Fluence     90% Error
[keV]   [erg/cm2]   [erg/cm2]
15- 25  3.442e-08   3.330e-09
25- 50  6.225e-08   6.370e-09
50-150  1.146e-07   3.940e-08
15-150  2.113e-07   4.395e-08
Double BB

Spectral model: bbodyrad<1> + bbodyrad<2>
------------------------------------------------------------
Parameters  : value         Lower 90%    Upper 90%
kT1 [keV]   : 5.56088        (-1.33487      1.71971)
R1^2/D10^2  : 6.91105        (-4.1076      13.5295)
kT2 [keV]   : 18.6856        (-2.72442      4.5076)
R2^2/D10^2  : 0.125112    (-0.0743959   0.0633426)
------------------------------------------------------------
#Fit statistic : Chi-Squared =          47.49 using 59 PHA bins.
# Reduced chi-squared =         0.8635 for     55 degrees of freedom
# Null hypothesis probability =   7.540068e-01

Energy  Fluence     90% Error
[keV]   [erg/cm2]   [erg/cm2]
15- 25  3.389e-08   1.373e-08
25- 50  6.230e-08   1.413e-08
50-150  1.064e-07   3.064e-08
15-150  2.026e-07   4.565e-08
Pre-slew spectrum (Pre-slew PHA with pre-slew DRM)
Power-law model

Spectral model in power-law:
------------------------------------------------------------
Parameters  : value       lower 90%   higher 90%
Photon index: 1.98150     ( -0.108292   0.110916 )
Norm@50keV  : 3.09278E-03    ( -0.00021289   0.000210509 )
------------------------------------------------------------
#Fit statistic : Chi-Squared =          58.47 using 59 PHA bins.
# Reduced chi-squared =          1.026 for     57 degrees of freedom
# Null hypothesis probability =   4.212661e-01

Photon flux (15-150 keV)    in 43.19 sec: 0.460016 ( -0.0266966  0.0267243 ) ph/cm2/s
Energy fluence (15-150 keV)             : 1.23071e-06 ( -8.06185e-08  8.14447e-08 ) ergs/cm2
Cutoff power-law model

Spectral model in the cutoff power-law:
------------------------------------------------------------
Parameters  : value       lower 90%   higher 90%
Photon index: 1.34821     ( -0.533393   0.469446 )
Epeak [keV] : 43.8800      ( -10.0683 14.2347 )
Norm@50keV  : 7.03517E-03    ( -0.00315929   0.00697118 )
------------------------------------------------------------
#Fit statistic : Chi-Squared =          52.96 using 59 PHA bins.
# Reduced chi-squared =         0.9457 for     56 degrees of freedom
# Null hypothesis probability =   5.906151e-01

Photon flux (15-150 keV)    in 43.19 sec: 0.445360 ( -0.028682  0.028672 ) ph/cm2/s
Energy fluence (15-150 keV)             : 1.15156e-06 ( -9.54672e-08  9.82875e-08 ) ergs/cm2
Band function

Spectral model in the Band function:
------------------------------------------------------------
Parameters  : value       lower 90%   higher 90%
alpha       :    (     )
beta        :     (     )
Epeak [keV] :       (   )
Norm@50keV   :     (     )
------------------------------------------------------------

Photon flux (15-150 keV)    in  sec:  (    ) ph/cm2/s
Energy fluence (15-150 keV)             : 0 ( 0  0 ) ergs/cm2
S(25-50 keV) vs. S(50-100 keV) plot

S(25-50 keV)  = 6.98e-07
S(50-100 keV) = 7.45e-07
T90 vs. Hardness ratio plot

T90                                   = 42.444000005722 sec.
Hardness ratio (energy fluence ratio) = 1.06734
Color vs. Color plot

Count Ratio  (25-50 keV) / (15-25 keV) = 1.10176
Count Ratio (50-100 keV) / (15-25 keV) = 0.588725
Mask shadow pattern

IMX = -3.413283865794583E-01, IMY = -1.717678515573294E-01
TIME vs. PHA plot around the trigger time

Blue+Cyan dotted lines: Time interval of the scaled map
From 0.000000 to 2.048000
TIME vs. DetID plot around the trigger time

Blue+Cyan dotted lines: Time interval of the scaled map
From 0.000000 to 2.048000
100 us light curve (15-350 keV)
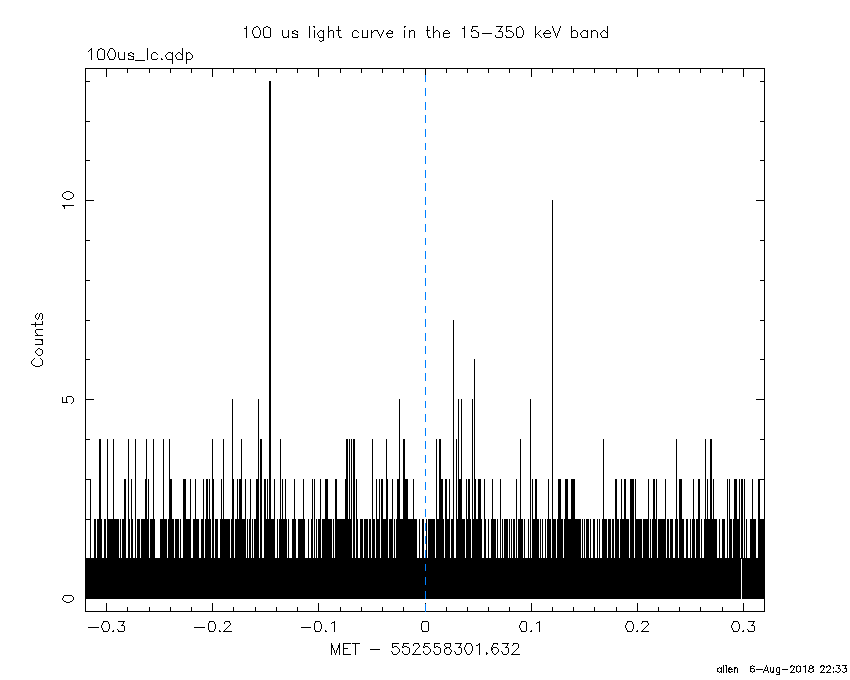
Blue+Cyan dotted lines: Time interval of the scaled map
From 0.000000 to 2.048000
Spacecraft aspect plot

Bright source in the pre-burst/pre-slew/post-slew images
Pre-burst image of 15-350 keV band
Time interval of the image:
-574.931410 -556.881200
-239.632000 -15.920000

# RAcent  DECcent POSerr Theta    Phi  PeakCts   SNR AngSep     Name
#  [deg]    [deg]    ['] [deg]  [deg]                   [']
 41.7063  67.0069    2.3  27.0   19.3   1.0474   4.9 ------	UNKNOWN
 64.4481  76.8308    2.2  16.1   33.0   0.9419   5.2 ------	UNKNOWN
188.7841  52.6484    2.6  33.5  166.2   1.2644   4.3 ------	UNKNOWN
 40.8905  61.4671    1.3  31.4   12.5   2.2635   8.9 ------	UNKNOWN
 52.0073  53.6537    2.6  34.5   -4.7   1.1199   4.4 ------	UNKNOWN
Pre-slew background subtracted image of 15-350 keV band
Time interval of the image:
-15.920000 27.268610

# RAcent  DECcent POSerr Theta    Phi  PeakCts   SNR AngSep     Name
#  [deg]    [deg]    ['] [deg]  [deg]                   [']
325.1661  81.0776    2.2  27.0   70.3   0.5927   5.2 ------	UNKNOWN
221.7312  70.0633    2.3  28.9  121.9   0.6103   5.0 ------	UNKNOWN
181.6826  66.0448    0.4  20.9  153.3   2.4240  29.7 ------	UNKNOWN
 30.7365  37.3354    2.0  55.7    3.5   2.0487   5.7 ------	UNKNOWN
 85.3733  69.6200    2.4  12.5   -2.5   0.3878   4.9 ------	UNKNOWN
Post-slew image of 15-350 keV band
Time interval of the image:
76.068600 718.765300
720.368000 840.348000
840.368000 962.441600

# RAcent  DECcent POSerr Theta    Phi  PeakCts   SNR AngSep     Name
#  [deg]    [deg]    ['] [deg]  [deg]                   [']
212.6119  56.6953    3.2  17.3  110.9   2.0740   3.7 ------	UNKNOWN
351.3062  63.8051    3.8  49.9    9.0   3.9460   3.1 ------	UNKNOWN
 40.9180  61.4355    1.7  49.3  -20.5   7.1343   6.9 ------	UNKNOWN
Plot creation:
Mon Aug  6 22:34:06 EDT 2018