Estimated redshift from machine learning (Ukwatta et al. 2016) - may take a few minute to calcaulte
Image
Pre-slew 15.0-350.0 keV image (Event data)
#   RAcent    DECcent   POSerr    Theta     Phi              Peak Cts       SNR   Name
   38.0855    60.3333   0.0119    20.0126  -117.5140         1.4856785     16.115 TRIG_00846868

Foreground time interval of the image:
  0.596  49.597 (delta_t =  49.001 [sec])
Background time interval of the image:
-239.504   0.596 (delta_t = 240.100 [sec])
Lightcurves
Notes:
- 1) The mask-weighted light curves are using the flight position.
- 2) Multiple plots of different time binning/intervals are shown to cover all scenarios of short/long GRBs, rate/image triggers, and real/false positives.
- 3) For all the mask-weighted lightcurves, the y-axis units are counts/sec/det where a det is 0.4 x 0.4 = 0.16 sq cm.
- 4) The verticle lines correspond to following: green dotted lines are T50 interval, black dotted lines are T90 interval, blue solid line(s) is a spacecraft slew start time, and orange solid line(s) is a spacecraft slew end time.
- 5) Time of each bin is in the middle of the bin.
1 s binning
From T0-310 s to T0+310 s

From T100_start - 20 s to T100_end + 30 s

Full time interval

64 ms binning
Full time interval

From T100_start to T100_end

From T0-5 sec to T0+5 sec
16 ms binning
From T100_start-5 s to T100_start+5 s

Blue+Cyan dotted lines: Time interval of the scaled map
From 0.000000 to 8.192000
8 ms binning
From T100_start-3 s to T100_start+3 s
Blue+Cyan dotted lines: Time interval of the scaled map
From 0.000000 to 8.192000
2 ms binning
From T100_start-1 s to T100_start+1 s

Blue+Cyan dotted lines: Time interval of the scaled map
From 0.000000 to 8.192000
SN=5 or 10 sec. binning (whichever binning is satisfied first)
SN=5 or 10 sec. binning (T < 200 sec)

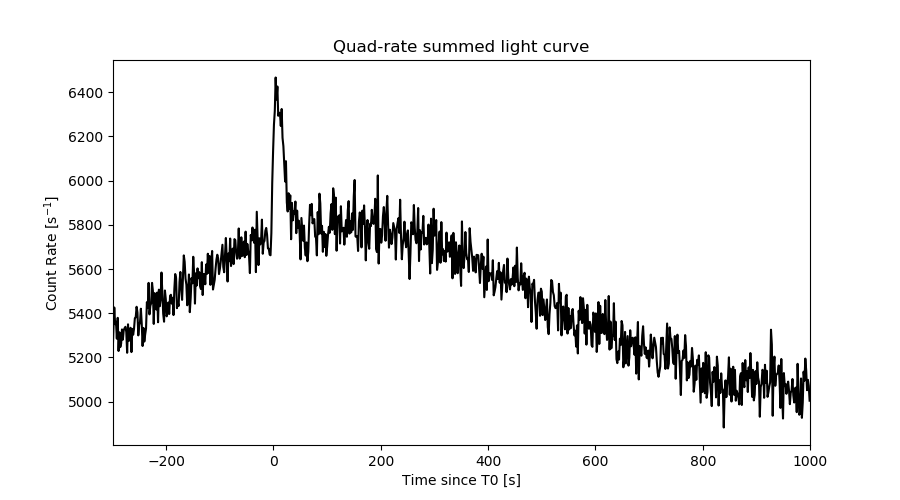
Quad-rate summed light curves (from T0-300s to T0+1000s)
Spectral Evolution

Spectra
Notes:
- 1) The fitting includes the systematic errors.
- 2) When the burst includes telescope slew time periods, the fitting uses an average response file made from multiple 5-s response files through out the slew time plus single time preiod for the non-slew times, and weighted by the total counts in the corresponding time period using addrmf. An average response file is needed becuase a spectral fit using the pre-slew DRM will introduce some errors in both a spectral shape and a normalization if the PHA file contains a lot of the slew/post-slew time interval.
- 3) For fits to more complicated models (e.g. a power-law over a cutoff power-law), the BAT team has decided to require a chi-square improvement of more than 6 for each extra dof.
Time averaged spectrum fit using the average DRM
Power-law model
Time interval is from    0.596 sec. to  223.720 sec.

Spectral model in power-law:
------------------------------------------------------------
Parameters  : value       lower 90%   higher 90%
Photon index: 1.32301     ( -0.239965   0.237634 )
Norm@50keV  : 6.18759E-04    ( -8.0287e-05   7.99674e-05 )
------------------------------------------------------------
#Fit statistic : Chi-Squared =          53.13 using 59 PHA bins.
# Reduced chi-squared =         0.9320 for     57 degrees of freedom
# Null hypothesis probability =   6.211805e-01

Photon flux (15-150 keV)    in 223.1 sec: 7.41425E-02 ( -0.0096543  0.0096772 ) ph/cm2/s
Energy fluence (15-150 keV)             : 1.35681e-06 ( -2.00141e-07  2.02919e-07 ) ergs/cm2
Cutoff power-law model

Time interval is from    0.596 sec. to  223.720 sec.
Spectral model in the cutoff power-law:
------------------------------------------------------------
Parameters  : value       lower 90%   higher 90%
Photon index: 1.31865     ( -0.30439   0.239747 )
Epeak [keV] : 9999.35      ( -9999.36 -9999.36 )
Norm@50keV  : 6.21270E-04    ( -0.00054213   0.000480762 )
------------------------------------------------------------
#Fit statistic : Chi-Squared =          53.14 using 59 PHA bins.
# Reduced chi-squared =         0.9489 for     56 degrees of freedom
# Null hypothesis probability =   5.839117e-01

Photon flux (15-150 keV)    in 223.1 sec: 7.41348E-02 ( -0.0096658  0.0096687 ) ph/cm2/s
Energy fluence (15-150 keV)             : 1.35622e-06 ( -2.00001e-07  2.02866e-07 ) ergs/cm2
Band function

Time interval is from    0.596 sec. to  223.720 sec.


Spectral model in the Band function:
------------------------------------------------------------
Parameters  : value       lower 90%   higher 90%
alpha       :    (     )
beta        :     (     )
Epeak [keV] :       (   )
Norm@50keV   :     (     )
------------------------------------------------------------

Photon flux (15-150 keV)    in  sec:  (    ) ph/cm2/s
Energy fluence (15-150 keV)             : 0 ( 0  0 ) ergs/cm2
Single BB

Spectral model blackbody:
------------------------------------------------------------
Parameters  : value    Lower 90%  Upper 90%
kT [keV]    : 18.1213  (-3.92249  5.02304)
R^2/D10^2   : 4.36670E-03  (-0.00431937   0.00549991)
(R is the radius in km and D10 is the distance to the source in units of 10 kpc)
------------------------------------------------------------
#Fit statistic : Chi-Squared =          77.97 using 59 PHA bins.
# Reduced chi-squared =          1.368 for     57 degrees of freedom
# Null hypothesis probability =   3.396746e-02

Energy  Fluence     90% Error
[keV]   [erg/cm2]   [erg/cm2]
15- 25  6.391e-08   1.731e-08
25- 50  2.971e-07   7.146e-08
50-150  7.093e-07   1.848e-07
15-150  1.070e-06   2.368e-07
Thermal bremsstrahlung (OTTB)

Spectral model: thermal bremsstrahlung
------------------------------------------------------------
Parameters  : value         Lower 90%    Upper 90%
kT [keV]    : 200.000       (-53.9248      -200)
Norm        : 0.304018       (-0.0393092     0.0393092)
------------------------------------------------------------
#Fit statistic : Chi-Squared =          56.76 using 59 PHA bins.
# Reduced chi-squared =         0.9958 for     57 degrees of freedom
# Null hypothesis probability =   4.840538e-01

Energy  Fluence     90% Error
[keV]   [erg/cm2]   [erg/cm2]
15- 25  1.689e-07   9.554e-08
25- 50  3.249e-07   1.803e-07
50-150  7.126e-07   3.888e-07
15-150  1.206e-06   6.645e-07
Double BB

Spectral model: bbodyrad<1> + bbodyrad<2>
------------------------------------------------------------
Parameters  : value         Lower 90%    Upper 90%
kT1 [keV]   : 6.63599        (-1.51491      1.91236)
R1^2/D10^2  : 0.101076        (-0.0609934      0.167519)
kT2 [keV]   : 36.8836        (-10.8337      28.643)
R2^2/D10^2  : 4.00418E-04    (-0.000305151   0.000742649)
------------------------------------------------------------
#Fit statistic : Chi-Squared =          48.64 using 59 PHA bins.
# Reduced chi-squared =         0.8843 for     55 degrees of freedom
# Null hypothesis probability =   7.148512e-01

Energy  Fluence     90% Error
[keV]   [erg/cm2]   [erg/cm2]
15- 25  1.670e-07   8.991e-08
25- 50  2.958e-07   1.350e-07
50-150  9.768e-07   5.337e-07
15-150  1.440e-06   6.763e-07
Peak spectrum fit
Power-law model

Time interval is from    8.732 sec. to    9.732 sec.

Spectral model in power-law:
------------------------------------------------------------
Parameters  : value       lower 90%   higher 90%
Photon index: 1.01119     ( -0.525557   0.48564 )
Norm@50keV  : 5.10118E-03    ( -0.00137742   0.00135702 )
------------------------------------------------------------
#Fit statistic : Chi-Squared =          63.44 using 59 PHA bins.
# Reduced chi-squared =          1.113 for     57 degrees of freedom
# Null hypothesis probability =   2.597716e-01

Photon flux (15-150 keV)    in 1 sec: 0.587655 ( -0.160047  0.161359 ) ph/cm2/s
Energy fluence (15-150 keV)             : 5.49503e-08 ( -1.56958e-08  1.5965e-08 ) ergs/cm2
Cutoff power-law model

Time interval is from    8.732 sec. to    9.732 sec.
Spectral model in the cutoff power-law:
------------------------------------------------------------
Parameters  : value       lower 90%   higher 90%
Photon index: 0.817251     ( -1.97513   -0.830448 )
Epeak [keV] : 362.169      ( -407.436 -407.436 )
Norm@50keV  : 6.17468E-03    ( -0.00214252   0.0258468 )
------------------------------------------------------------
#Fit statistic : Chi-Squared =          63.45 using 59 PHA bins.
# Reduced chi-squared =          1.133 for     56 degrees of freedom
# Null hypothesis probability =   2.305513e-01

Photon flux (15-150 keV)    in 1 sec: 0.584936 ( -0.166451  0.163565 ) ph/cm2/s
Energy fluence (15-150 keV)             : 5.47344e-08 ( -1.62398e-08  1.6096e-08 ) ergs/cm2
Band function

Time interval is from    8.732 sec. to    9.732 sec.


Spectral model in the Band function:
------------------------------------------------------------
Parameters  : value       lower 90%   higher 90%
alpha       :    (     )
beta        :     (     )
Epeak [keV] :       (   )
Norm@50keV   :     (     )
------------------------------------------------------------

Photon flux (15-150 keV)    in  sec:  (    ) ph/cm2/s
Energy fluence (15-150 keV)             : 0 ( 0  0 ) ergs/cm2
Single BB

Spectral model blackbody:
------------------------------------------------------------
Parameters  : value    Lower 90%  Upper 90%
kT [keV]    : 26.0788  (-8.55768  15.0719)
R^2/D10^2   : 1.22663E-02  (-0.0122532   0.0293896)
(R is the radius in km and D10 is the distance to the source in units of 10 kpc)
------------------------------------------------------------
#Fit statistic : Chi-Squared =          66.38 using 59 PHA bins.
# Reduced chi-squared =          1.165 for     57 degrees of freedom
# Null hypothesis probability =   1.850125e-01

Energy  Fluence     90% Error
[keV]   [erg/cm2]   [erg/cm2]
15- 25  1.417e-09   8.940e-10
25- 50  8.207e-09   4.634e-09
50-150  4.109e-08   2.587e-08
15-150  5.071e-08   3.043e-08
Thermal bremsstrahlung (OTTB)

Spectral model: thermal bremsstrahlung
------------------------------------------------------------
Parameters  : value         Lower 90%    Upper 90%
kT [keV]    : 200.000       (-88.4306      -200)
Norm        : 2.41528       (-0.663531     0.663531)
------------------------------------------------------------
#Fit statistic : Chi-Squared =          66.92 using 59 PHA bins.
# Reduced chi-squared =          1.174 for     57 degrees of freedom
# Null hypothesis probability =   1.730677e-01

Energy  Fluence     90% Error
[keV]   [erg/cm2]   [erg/cm2]
15- 25  6.014e-09   3.682e-09
25- 50  1.157e-08   7.175e-09
50-150  2.537e-08   1.539e-08
15-150  4.296e-08   2.548e-08
Double BB

Spectral model: bbodyrad<1> + bbodyrad<2>
------------------------------------------------------------
Parameters  : value         Lower 90%    Upper 90%
kT1 [keV]   : 6.40259        (-2.79397      6.09696)
R1^2/D10^2  : 0.691637        (-0.684431      5.24817)
kT2 [keV]   : 36.3309        (-13.4489      55.8152)
R2^2/D10^2  : 4.13838E-03    (-0.00385798   0.00813379)
------------------------------------------------------------
#Fit statistic : Chi-Squared =          61.64 using 59 PHA bins.
# Reduced chi-squared =          1.121 for     55 degrees of freedom
# Null hypothesis probability =   2.507608e-01

Energy  Fluence     90% Error
[keV]   [erg/cm2]   [erg/cm2]
15- 25  4.866e-09   3.405e-09
25- 50  9.700e-09   5.280e-09
50-150  4.270e-08   2.466e-08
15-150  5.727e-08   3.201e-08
Pre-slew spectrum (Pre-slew PHA with pre-slew DRM)
Power-law model
Spectral model in power-law:
------------------------------------------------------------
Parameters  : value       lower 90%   higher 90%
Photon index: 1.18360     ( -0.178058   0.175331 )
Norm@50keV  : 2.02628E-03    ( -0.000191228   0.000191187 )
------------------------------------------------------------
#Fit statistic : Chi-Squared =          53.29 using 59 PHA bins.
# Reduced chi-squared =         0.9349 for     57 degrees of freedom
# Null hypothesis probability =   6.151411e-01

Photon flux (15-150 keV)    in 49 sec: 0.237308 ( -0.0231735  0.0232777 ) ph/cm2/s
Energy fluence (15-150 keV)             : 1.01205e-06 ( -1.0667e-07  1.07448e-07 ) ergs/cm2
Cutoff power-law model

Spectral model in the cutoff power-law:
------------------------------------------------------------
Parameters  : value       lower 90%   higher 90%
Photon index: 1.17907     ( -0.490086   0.2226 )
Epeak [keV] : 1.00000E+04      ( -10000 -10000 )
Norm@50keV  : 2.03611E-03    (     )
------------------------------------------------------------
#Fit statistic : Chi-Squared =          53.30 using 59 PHA bins.
# Reduced chi-squared =         0.9517 for     56 degrees of freedom
# Null hypothesis probability =   5.778099e-01

Photon flux (15-150 keV)    in 49 sec: 0.237211 ( -0.022969  0.023252 ) ph/cm2/s
Energy fluence (15-150 keV)             : 1.00999e-06 ( -1.051e-07  1.08672e-07 ) ergs/cm2
Band function

Spectral model in the Band function:
------------------------------------------------------------
Parameters  : value       lower 90%   higher 90%
alpha       :    (     )
beta        :     (     )
Epeak [keV] :       (   )
Norm@50keV   :     (     )
------------------------------------------------------------

Photon flux (15-150 keV)    in  sec:  (    ) ph/cm2/s
Energy fluence (15-150 keV)             : 0 ( 0  0 ) ergs/cm2
S(25-50 keV) vs. S(50-100 keV) plot

S(25-50 keV)  = 3.06e-07
S(50-100 keV) = 4.89e-07
T90 vs. Hardness ratio plot

T90                                   = 194.807999968529 sec.
Hardness ratio (energy fluence ratio) = 1.59804
Color vs. Color plot

Count Ratio  (25-50 keV) / (15-25 keV) = 1.23512
Count Ratio (50-100 keV) / (15-25 keV) = 1.18378
Mask shadow pattern

IMX = -1.682567517699103E-01, IMY = 3.230260812799193E-01
TIME vs. PHA plot around the trigger time
Blue+Cyan dotted lines: Time interval of the scaled map
From 0.000000 to 8.192000
TIME vs. DetID plot around the trigger time

Blue+Cyan dotted lines: Time interval of the scaled map
From 0.000000 to 8.192000
100 us light curve (15-350 keV)

Blue+Cyan dotted lines: Time interval of the scaled map
From 0.000000 to 8.192000
Spacecraft aspect plot

Bright source in the pre-burst/pre-slew/post-slew images
Pre-burst image of 15-350 keV band
Time interval of the image:
-239.504000 0.596000

# RAcent  DECcent POSerr Theta    Phi  PeakCts   SNR AngSep     Name
#  [deg]    [deg]    ['] [deg]  [deg]                   [']
307.9621  40.9557    6.4  46.6  134.5   2.0582   1.8    6.7	Cyg X-3
326.1276  38.5227    7.8  35.5  121.1   0.7779   1.5   12.2	Cyg X-2
 43.5284  -1.3199    3.4  54.3  -11.6   2.2636   3.4 ------	UNKNOWN
 40.9030  61.4447    1.5  21.8 -118.0   2.0672   7.7 ------	UNKNOWN
108.4153  71.7943    4.4  48.0 -129.2   3.1107   2.6 ------	UNKNOWN
124.8305  74.6978    2.7  50.9 -135.4   6.5034   4.3 ------	UNKNOWN
Pre-slew background subtracted image of 15-350 keV band
Time interval of the image:
0.596000 49.596610

# RAcent  DECcent POSerr Theta    Phi  PeakCts   SNR AngSep     Name
#  [deg]    [deg]    ['] [deg]  [deg]                   [']
308.0649  40.8255   10.4  46.6  134.3  -0.4669  -1.1    7.9	Cyg X-3
326.1156  38.1769    5.5  35.7  120.5   0.4072   2.1    9.1	Cyg X-2
 38.0855  60.3333    0.7  20.0 -117.5   1.4859  16.1 ------	UNKNOWN
Post-slew image of 15-350 keV band
Time interval of the image:
93.596600 962.592600

# RAcent  DECcent POSerr Theta    Phi  PeakCts   SNR AngSep     Name
#  [deg]    [deg]    ['] [deg]  [deg]                   [']
  5.2484  22.5557    3.2  44.2   40.9   5.8738   3.6 ------	UNKNOWN
 13.1586  11.0476    3.1  52.6   26.3  11.4157   3.8 ------	UNKNOWN
 24.2261  49.3771    3.2  13.5   36.8   2.2738   3.7 ------	UNKNOWN
 40.8688  61.4354    0.8   1.7 -134.4   9.2940  13.6 ------	UNKNOWN
Plot creation:
Mon Aug  6 22:32:22 EDT 2018