Estimated redshift from machine learning (Ukwatta et al. 2016) - may take a few minute to calcaulte
Image
Pre-slew 15.0-350.0 keV image (Event data)

#   RAcent    DECcent   POSerr    Theta     Phi              Peak Cts       SNR   Name
  235.0854    -0.8993   0.0170    24.7069   170.8669         0.1698441     11.286 TRIG_00848048

Foreground time interval of the image:
 -0.144   0.632 (delta_t =   0.776 [sec])
Background time interval of the image:
-239.272  -0.144 (delta_t = 239.128 [sec])
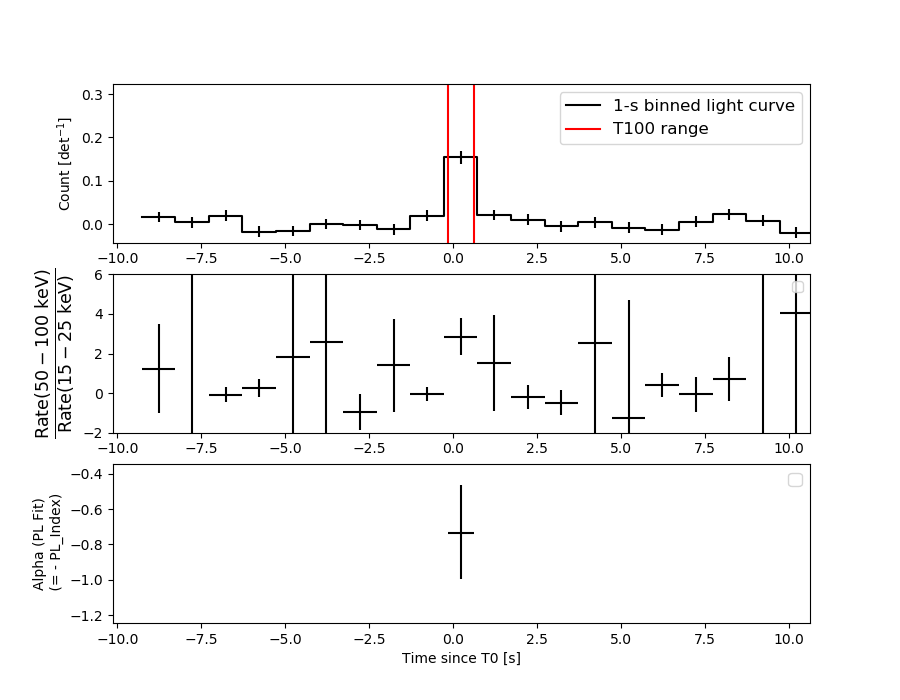
Lightcurves
Notes:
- 1) The mask-weighted light curves are using the flight position.
- 2) Multiple plots of different time binning/intervals are shown to cover all scenarios of short/long GRBs, rate/image triggers, and real/false positives.
- 3) For all the mask-weighted lightcurves, the y-axis units are counts/sec/det where a det is 0.4 x 0.4 = 0.16 sq cm.
- 4) The verticle lines correspond to following: green dotted lines are T50 interval, black dotted lines are T90 interval, blue solid line(s) is a spacecraft slew start time, and orange solid line(s) is a spacecraft slew end time.
- 5) Time of each bin is in the middle of the bin.
1 s binning
From T0-310 s to T0+310 s
From T100_start - 20 s to T100_end + 30 s
Full time interval
64 ms binning
Full time interval

From T100_start to T100_end
From T0-5 sec to T0+5 sec

16 ms binning
From T100_start-5 s to T100_start+5 s
Blue+Cyan dotted lines: Time interval of the scaled map
From 0.000000 to 0.512000
8 ms binning
From T100_start-3 s to T100_start+3 s
Blue+Cyan dotted lines: Time interval of the scaled map
From 0.000000 to 0.512000
2 ms binning
From T100_start-1 s to T100_start+1 s

Blue+Cyan dotted lines: Time interval of the scaled map
From 0.000000 to 0.512000
SN=5 or 10 sec. binning (whichever binning is satisfied first)
SN=5 or 10 sec. binning (T < 200 sec)
Quad-rate summed light curves (from T0-300s to T0+1000s)

Spectral Evolution
Spectra
Notes:
- 1) The fitting includes the systematic errors.
- 2) When the burst includes telescope slew time periods, the fitting uses an average response file made from multiple 5-s response files through out the slew time plus single time preiod for the non-slew times, and weighted by the total counts in the corresponding time period using addrmf. An average response file is needed becuase a spectral fit using the pre-slew DRM will introduce some errors in both a spectral shape and a normalization if the PHA file contains a lot of the slew/post-slew time interval.
- 3) For fits to more complicated models (e.g. a power-law over a cutoff power-law), the BAT team has decided to require a chi-square improvement of more than 6 for each extra dof.
Time averaged spectrum fit using the average DRM
Power-law model

Time interval is from   -0.144 sec. to    0.632 sec.

Spectral model in power-law:
------------------------------------------------------------
Parameters  : value       lower 90%   higher 90%
Photon index: 0.737030     ( -0.273434   0.258844 )
Norm@50keV  : 1.35296E-02    ( -0.00201205   0.00197034 )
------------------------------------------------------------
#Fit statistic : Chi-Squared =          46.03 using 59 PHA bins.
# Reduced chi-squared =         0.8075 for     57 degrees of freedom
# Null hypothesis probability =   8.504854e-01

Photon flux (15-150 keV)    in 0.776 sec: 1.55979 ( -0.22035  0.2215 ) ph/cm2/s
Energy fluence (15-150 keV)             : 1.2607e-07 ( -1.88063e-08  1.89382e-08 ) ergs/cm2
Cutoff power-law model
Time interval is from   -0.144 sec. to    0.632 sec.
Spectral model in the cutoff power-law:
------------------------------------------------------------
Parameters  : value       lower 90%   higher 90%
Photon index: 0.589279     ( -1.23499   0.38463 )
Epeak [keV] : 611.578      ( -611.507 -611.507 )
Norm@50keV  : 1.54616E-02    ( -0.00340321   0.0276541 )
------------------------------------------------------------
#Fit statistic : Chi-Squared =          45.97 using 59 PHA bins.
# Reduced chi-squared =         0.8208 for     56 degrees of freedom
# Null hypothesis probability =   8.282993e-01

Photon flux (15-150 keV)    in 0.776 sec: 1.54914 ( -0.23271  0.2283 ) ph/cm2/s
Energy fluence (15-150 keV)             : 1.25514e-07 ( -1.94688e-08  1.90937e-08 ) ergs/cm2
Band function

Time interval is from   -0.144 sec. to    0.632 sec.


Spectral model in the Band function:
------------------------------------------------------------
Parameters  : value       lower 90%   higher 90%
alpha       :    (     )
beta        :     (     )
Epeak [keV] :       (   )
Norm@50keV   :     (     )
------------------------------------------------------------

Photon flux (15-150 keV)    in  sec:  (    ) ph/cm2/s
Energy fluence (15-150 keV)             : 0 ( 0  0 ) ergs/cm2
Single BB
Spectral model blackbody:
------------------------------------------------------------
Parameters  : value    Lower 90%  Upper 90%
kT [keV]    : 28.6971  (-5.27575  7.46208)
R^2/D10^2   : 2.68032E-02  (-0.0126582   0.0214489)
(R is the radius in km and D10 is the distance to the source in units of 10 kpc)
------------------------------------------------------------
#Fit statistic : Chi-Squared =          51.05 using 59 PHA bins.
# Reduced chi-squared =         0.8956 for     57 degrees of freedom
# Null hypothesis probability =   6.967355e-01

Energy  Fluence     90% Error
[keV]   [erg/cm2]   [erg/cm2]
15- 25  2.753e-09   8.090e-10
25- 50  1.667e-08   4.575e-09
50-150  9.851e-08   2.642e-08
15-150  1.179e-07   2.728e-08
Thermal bremsstrahlung (OTTB)
Spectral model: thermal bremsstrahlung
------------------------------------------------------------
Parameters  : value         Lower 90%    Upper 90%
kT [keV]    : 200.000       (-29.7455      -200)
Norm        : 6.06846       (-0.914759     0.914759)
------------------------------------------------------------
#Fit statistic : Chi-Squared =          72.17 using 59 PHA bins.
# Reduced chi-squared =          1.266 for     57 degrees of freedom
# Null hypothesis probability =   8.491079e-02

Energy  Fluence     90% Error
[keV]   [erg/cm2]   [erg/cm2]
15- 25  1.172e-08   6.740e-09
25- 50  2.255e-08   1.260e-08
50-150  4.945e-08   2.768e-08
15-150  8.372e-08   4.648e-08
Double BB
Spectral model: bbodyrad<1> + bbodyrad<2>
------------------------------------------------------------
Parameters  : value         Lower 90%    Upper 90%
kT1 [keV]   : 5.01341        (-2.62786      5.65148)
R1^2/D10^2  : 2.96854        (-2.77586      120.184)
kT2 [keV]   : 34.0133        (-7.61231      16.3406)
R2^2/D10^2  : 1.58181E-02    (-0.0104519   0.00855313)
------------------------------------------------------------
#Fit statistic : Chi-Squared =          44.01 using 59 PHA bins.
# Reduced chi-squared =         0.8003 for     55 degrees of freedom
# Null hypothesis probability =   8.558618e-01

Energy  Fluence     90% Error
[keV]   [erg/cm2]   [erg/cm2]
15- 25  7.713e-09   4.262e-09
25- 50  1.699e-08   7.355e-09
50-150  1.023e-07   4.396e-08
15-150  1.270e-07   5.333e-08
Peak spectrum fit
Power-law model
Time interval is from   -0.256 sec. to    0.744 sec.

Spectral model in power-law:
------------------------------------------------------------
Parameters  : value       lower 90%   higher 90%
Photon index: 0.677033     ( -0.304706   0.285083 )
Norm@50keV  : 1.02104E-02    ( -0.00174781   0.0016969 )
------------------------------------------------------------
#Fit statistic : Chi-Squared =          53.05 using 59 PHA bins.
# Reduced chi-squared =         0.9308 for     57 degrees of freedom
# Null hypothesis probability =   6.238642e-01

Photon flux (15-150 keV)    in 1 sec: 1.18248 ( -0.186615  0.1878 ) ph/cm2/s
Energy fluence (15-150 keV)             : 1.25951e-07 ( -2.02887e-08  2.03947e-08 ) ergs/cm2
Cutoff power-law model
Time interval is from   -0.256 sec. to    0.744 sec.
Spectral model in the cutoff power-law:
------------------------------------------------------------
Parameters  : value       lower 90%   higher 90%
Photon index: 0.157066     ( -1.89522   0.646902 )
Epeak [keV] : 237.764      ( -237.657 -237.657 )
Norm@50keV  : 1.58420E-02    ( -0.0070746   0.0493481 )
------------------------------------------------------------
#Fit statistic : Chi-Squared =          52.60 using 59 PHA bins.
# Reduced chi-squared =         0.9394 for     56 degrees of freedom
# Null hypothesis probability =   6.041797e-01

Photon flux (15-150 keV)    in 1 sec: 1.15294 ( -0.204763  0.20083 ) ph/cm2/s
Energy fluence (15-150 keV)             : 1.2448e-07 ( -2.12276e-08  2.09118e-08 ) ergs/cm2
Band function

Time interval is from   -0.256 sec. to    0.744 sec.


Spectral model in the Band function:
------------------------------------------------------------
Parameters  : value       lower 90%   higher 90%
alpha       :    (     )
beta        :     (     )
Epeak [keV] :       (   )
Norm@50keV   :     (     )
------------------------------------------------------------

Photon flux (15-150 keV)    in  sec:  (    ) ph/cm2/s
Energy fluence (15-150 keV)             : 0 ( 0  0 ) ergs/cm2
Single BB
Spectral model blackbody:
------------------------------------------------------------
Parameters  : value    Lower 90%  Upper 90%
kT [keV]    : 29.7168  (-5.6667  8.34113)
R^2/D10^2   : 1.88380E-02  (-0.00929075   0.0158673)
(R is the radius in km and D10 is the distance to the source in units of 10 kpc)
------------------------------------------------------------
#Fit statistic : Chi-Squared =          54.20 using 59 PHA bins.
# Reduced chi-squared =         0.9509 for     57 degrees of freedom
# Null hypothesis probability =   5.807440e-01

Energy  Fluence     90% Error
[keV]   [erg/cm2]   [erg/cm2]
15- 25  2.618e-09   8.755e-10
25- 50  1.609e-08   5.187e-09
50-150  1.007e-07   3.192e-08
15-150  1.194e-07   3.188e-08
Thermal bremsstrahlung (OTTB)
Spectral model: thermal bremsstrahlung
------------------------------------------------------------
Parameters  : value         Lower 90%    Upper 90%
kT [keV]    : 200.000       (-32.9266      -200)
Norm        : 4.62340       (-0.783162     0.783162)
------------------------------------------------------------
#Fit statistic : Chi-Squared =          77.99 using 59 PHA bins.
# Reduced chi-squared =          1.368 for     57 degrees of freedom
# Null hypothesis probability =   3.388299e-02

Energy  Fluence     90% Error
[keV]   [erg/cm2]   [erg/cm2]
15- 25  1.151e-08   6.670e-09
25- 50  2.215e-08   1.286e-08
50-150  4.858e-08   2.773e-08
15-150  8.225e-08   4.661e-08
Double BB
Spectral model: bbodyrad<1> + bbodyrad<2>
------------------------------------------------------------
Parameters  : value         Lower 90%    Upper 90%
kT1 [keV]   : 3.48680        (-2.4918      4.5336)
R1^2/D10^2  : 11.3438        (-11.0563      21673.4)
kT2 [keV]   : 32.5167        (-6.76359      11.1962)
R2^2/D10^2  : 1.42403E-02    (-0.00780605   0.0135431)
------------------------------------------------------------
#Fit statistic : Chi-Squared =          49.32 using 59 PHA bins.
# Reduced chi-squared =         0.8967 for     55 degrees of freedom
# Null hypothesis probability =   6.905365e-01

Energy  Fluence     90% Error
[keV]   [erg/cm2]   [erg/cm2]
15- 25  7.330e-09   3.691e-09
25- 50  1.547e-08   6.000e-09
50-150  1.027e-07   3.776e-08
15-150  1.255e-07   4.042e-08
Pre-slew spectrum (Pre-slew PHA with pre-slew DRM)
Power-law model

Spectral model in power-law:
------------------------------------------------------------
Parameters  : value       lower 90%   higher 90%
Photon index: 0.737030     ( -0.273434   0.258844 )
Norm@50keV  : 1.35296E-02    ( -0.00201205   0.00197034 )
------------------------------------------------------------
#Fit statistic : Chi-Squared =          46.03 using 59 PHA bins.
# Reduced chi-squared =         0.8075 for     57 degrees of freedom
# Null hypothesis probability =   8.504854e-01

Photon flux (15-150 keV)    in 0.776 sec: 1.55981 ( -0.22035  0.221498 ) ph/cm2/s
Energy fluence (15-150 keV)             : 1.26058e-07 ( -1.88049e-08  1.89416e-08 ) ergs/cm2
Cutoff power-law model

Spectral model in the cutoff power-law:
------------------------------------------------------------
Parameters  : value       lower 90%   higher 90%
Photon index: 0.589470     ( -1.23503   0.384589 )
Epeak [keV] : 612.051      ( -611.526 -611.526 )
Norm@50keV  : 1.54597E-02    ( -0.0034032   0.0276544 )
------------------------------------------------------------
#Fit statistic : Chi-Squared =          45.97 using 59 PHA bins.
# Reduced chi-squared =         0.8208 for     56 degrees of freedom
# Null hypothesis probability =   8.282993e-01

Photon flux (15-150 keV)    in 0.776 sec: 1.54910 ( -0.23265  0.2283 ) ph/cm2/s
Energy fluence (15-150 keV)             : 1.25575e-07 ( -1.94768e-08  1.92401e-08 ) ergs/cm2
Band function
Spectral model in the Band function:
------------------------------------------------------------
Parameters  : value       lower 90%   higher 90%
alpha       :    (     )
beta        :     (     )
Epeak [keV] :       (   )
Norm@50keV   :     (     )
------------------------------------------------------------

Photon flux (15-150 keV)    in  sec:  (    ) ph/cm2/s
Energy fluence (15-150 keV)             : 0 ( 0  0 ) ergs/cm2
S(25-50 keV) vs. S(50-100 keV) plot

S(25-50 keV)  = 1.94e-08
S(50-100 keV) = 4.66e-08
T90 vs. Hardness ratio plot
T90                                   = 0.684000015258789 sec.
Hardness ratio (energy fluence ratio) = 2.40206
Color vs. Color plot

Count Ratio  (25-50 keV) / (15-25 keV) = 1.8385
Count Ratio (50-100 keV) / (15-25 keV) = 2.72212
Mask shadow pattern

IMX = -4.542611714895851E-01, IMY = -7.302989999228948E-02
TIME vs. PHA plot around the trigger time
Blue+Cyan dotted lines: Time interval of the scaled map
From 0.000000 to 0.512000
TIME vs. DetID plot around the trigger time
Blue+Cyan dotted lines: Time interval of the scaled map
From 0.000000 to 0.512000
100 us light curve (15-350 keV)
Blue+Cyan dotted lines: Time interval of the scaled map
From 0.000000 to 0.512000
Spacecraft aspect plot
Bright source in the pre-burst/pre-slew/post-slew images
Pre-burst image of 15-350 keV band
Time interval of the image:
-239.272000 -0.144000

# RAcent  DECcent POSerr Theta    Phi  PeakCts   SNR AngSep     Name
#  [deg]    [deg]    ['] [deg]  [deg]                   [']
244.9816 -15.6478    0.6  37.9  147.6   9.0611  19.9    0.5	Sco X-1
254.4854  35.3498    2.2  16.0    1.8   1.3002   5.3    1.4	Her X-1
268.5692  -1.4343    0.0  33.7  100.6  -0.2988  -0.5   12.1	SW J1753.5-0127
299.6424  35.1652    5.1  49.8   31.2   2.6847   2.3    3.4	Cyg X-1
256.4114 -22.7493    3.3  46.6  133.3   4.0466   3.5 ------	UNKNOWN
286.1580  61.8600    2.1  48.9   -6.0   2.4700   5.6 ------	UNKNOWN
196.4909  15.1218    3.3  45.4 -121.3   4.8025   3.5 ------	UNKNOWN
Pre-slew background subtracted image of 15-350 keV band
Time interval of the image:
-0.144000 0.632000

# RAcent  DECcent POSerr Theta    Phi  PeakCts   SNR AngSep     Name
#  [deg]    [deg]    ['] [deg]  [deg]                   [']
244.7763 -15.6854    6.4  37.9  147.9  -0.0453  -1.8   12.0	Sco X-1
254.3031  35.4143    6.2  16.0    1.2   0.0241   1.9    8.7	Her X-1
268.2021  -1.4945   25.0  33.5  101.1   0.0121   0.5   10.3	SW J1753.5-0127
299.6277  35.0756    5.4  49.8   31.3   0.1282   2.2    7.8	Cyg X-1
234.3621 -23.0912    2.4  46.3  161.4   0.1670   4.9 ------	UNKNOWN
231.8005 -11.3451    2.5  35.6  169.9   0.0811   4.6 ------	UNKNOWN
235.0855  -0.8992    1.0  24.7  170.9   0.1684  11.2 ------	UNKNOWN
Post-slew image of 15-350 keV band
Time interval of the image:
289.228600 635.028600

# RAcent  DECcent POSerr Theta    Phi  PeakCts   SNR AngSep     Name
#  [deg]    [deg]    ['] [deg]  [deg]                   [']
244.9658 -15.6350    0.8  38.2 -145.1   8.4123  14.7    0.8	Sco X-1
255.9643 -37.8241    1.5  42.0  177.4   4.5287   7.7    1.6	4U 1700-377
256.3721 -36.5053    7.8  40.8  178.3   0.7997   1.5    5.8	GX 349+2
263.1591 -24.6622    8.2  28.0 -175.7   0.5007   1.4    9.6	GX 1+4
264.6385 -44.3669   14.9  44.0  164.1  -0.5671  -0.8    6.7	4U 1735-44
268.5142  -1.3748   62.3  13.1 -116.6   0.0631   0.2    9.9	SW J1753.5-0127
270.3101 -25.1152    3.3  24.6  171.7   1.1558   3.5    2.6	GX 5-1
270.3096 -25.7897    2.4  25.2  171.0   1.6955   4.9    2.8	GRS 1758-258
274.0613 -13.9623    3.6  13.2 -179.8   1.0986   3.1    5.5	GX 17+2
275.6874 -30.4112    0.0  28.0  157.5   0.4400   1.1   12.6	H1820-303
285.1703 -24.9974   74.9  22.3  138.0  -0.0562  -0.2    8.6	HT1900.1-2455
288.7804  10.9649    1.3  15.7   -6.1   2.8037   8.9    1.6	GRS 1915+105
299.6011  35.1591    4.9  41.7  -10.9   1.0716   2.4    2.6	Cyg X-1
307.9894  41.0002   25.8  50.1   -7.4   0.3337   0.4    6.2	Cyg X-3
262.9364 -33.7558    4.0  35.3  174.0   1.3564   2.9    5.4	GX 354-0
329.3168  12.6417    3.5  49.9   37.4   5.7375   3.3 ------	UNKNOWN
303.7417 -33.3167    3.2  36.8  114.9   2.7711   3.6 ------	UNKNOWN
299.1864  27.0781    2.6  34.5   -4.9   1.7950   4.4 ------	UNKNOWN
262.1473 -20.2623    3.0  25.6 -167.2   1.2245   3.8 ------	UNKNOWN
275.0774   7.1803    1.6  12.0  -65.8   2.1647   7.1 ------	UNKNOWN
304.8588  44.7981    4.1  52.1  -12.5   2.4770   2.8 ------	UNKNOWN
	UNKNOWN
	UNKNOWN
	UNKNOWN
Plot creation:
Mon Aug  6 22:30:33 EDT 2018