Special notes of this burst
Image
Pre-slew 15.0-350.0 keV image (Event data)

#   RAcent    DECcent   POSerr    Theta     Phi              Peak Cts       SNR   Name
  346.6387   -63.0661   0.0074    16.9953    53.7999         0.5245691     26.098 TRIG_00850231

Foreground time interval of the image:
 -0.052   1.332 (delta_t =   1.384 [sec])
Background time interval of the image:
-239.016  -0.052 (delta_t = 238.964 [sec])
Lightcurves
Notes:
- 1) The mask-weighted light curves are using the flight position.
- 2) Multiple plots of different time binning/intervals are shown to cover all scenarios of short/long GRBs, rate/image triggers, and real/false positives.
- 3) For all the mask-weighted lightcurves, the y-axis units are counts/sec/det where a det is 0.4 x 0.4 = 0.16 sq cm.
- 4) The verticle lines correspond to following: green dotted lines are T50 interval, black dotted lines are T90 interval, blue solid line(s) is a spacecraft slew start time, and orange solid line(s) is a spacecraft slew end time.
- 5) Time of each bin is in the middle of the bin.
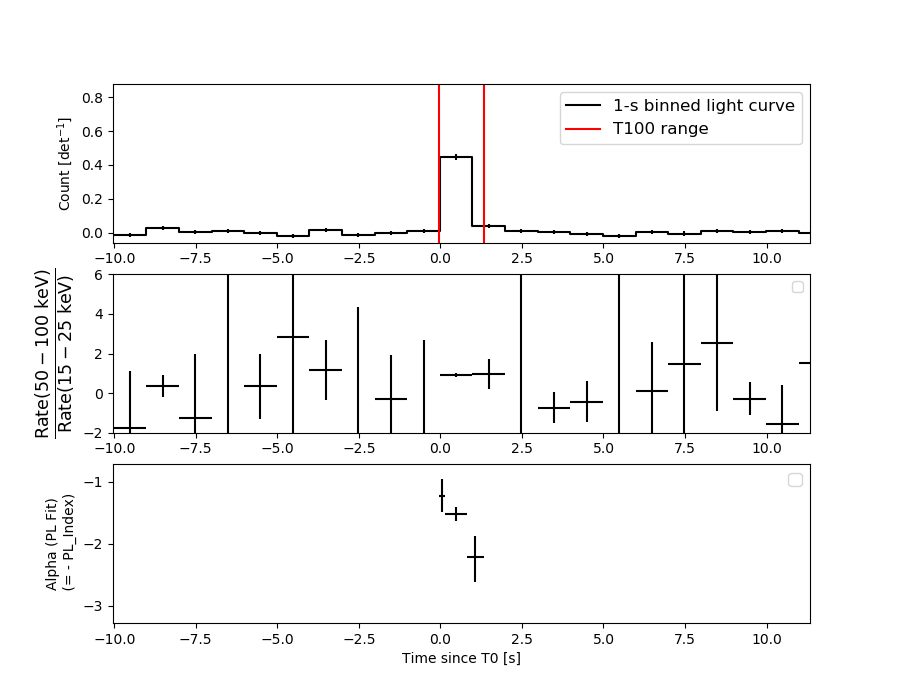
1 s binning
From T0-310 s to T0+310 s

From T100_start - 20 s to T100_end + 30 s

Full time interval

64 ms binning
Full time interval
From T100_start to T100_end

From T0-5 sec to T0+5 sec
16 ms binning
From T100_start-5 s to T100_start+5 s

Blue+Cyan dotted lines: Time interval of the scaled map
From 0.000000 to 1.024000
8 ms binning
From T100_start-3 s to T100_start+3 s

Blue+Cyan dotted lines: Time interval of the scaled map
From 0.000000 to 1.024000
2 ms binning
From T100_start-1 s to T100_start+1 s
Blue+Cyan dotted lines: Time interval of the scaled map
From 0.000000 to 1.024000
SN=5 or 10 sec. binning (whichever binning is satisfied first)
SN=5 or 10 sec. binning (T < 200 sec)
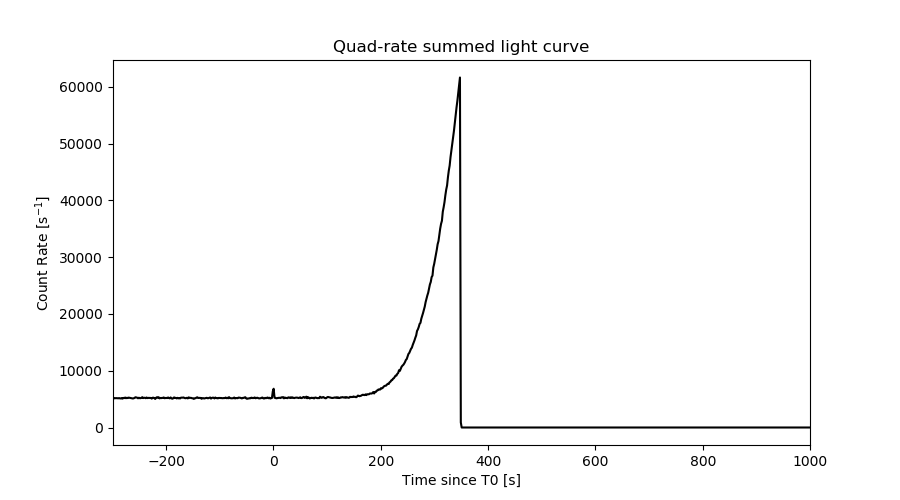
Quad-rate summed light curves (from T0-300s to T0+1000s)
Spectral Evolution
Spectra
Notes:
- 1) The fitting includes the systematic errors.
- 2) When the burst includes telescope slew time periods, the fitting uses an average response file made from multiple 5-s response files through out the slew time plus single time preiod for the non-slew times, and weighted by the total counts in the corresponding time period using addrmf. An average response file is needed becuase a spectral fit using the pre-slew DRM will introduce some errors in both a spectral shape and a normalization if the PHA file contains a lot of the slew/post-slew time interval.
- 3) For fits to more complicated models (e.g. a power-law over a cutoff power-law), the BAT team has decided to require a chi-square improvement of more than 6 for each extra dof.
Time averaged spectrum fit using the average DRM
Power-law model

Time interval is from   -0.052 sec. to    1.332 sec.

Spectral model in power-law:
------------------------------------------------------------
Parameters  : value       lower 90%   higher 90%
Photon index: 1.59876     ( -0.104776   0.106402 )
Norm@50keV  : 2.27103E-02    ( -0.00151234   0.00150414 )
------------------------------------------------------------
#Fit statistic : Chi-Squared =          57.46 using 59 PHA bins.
# Reduced chi-squared =          1.008 for     57 degrees of freedom
# Null hypothesis probability =   4.580432e-01

Photon flux (15-150 keV)    in 1.384 sec: 2.91736 ( -0.18526  0.18537 ) ph/cm2/s
Energy fluence (15-150 keV)             : 2.94034e-07 ( -2.09874e-08  2.11446e-08 ) ergs/cm2
Cutoff power-law model

Time interval is from   -0.052 sec. to    1.332 sec.
Spectral model in the cutoff power-law:
------------------------------------------------------------
Parameters  : value       lower 90%   higher 90%
Photon index: 0.588052     ( -0.545776   0.484203 )
Epeak [keV] : 67.6269      ( -9.58309 20.0558 )
Norm@50keV  : 7.57856E-02    ( -0.0326754   0.0674652 )
------------------------------------------------------------
#Fit statistic : Chi-Squared =          43.23 using 59 PHA bins.
# Reduced chi-squared =         0.7720 for     56 degrees of freedom
# Null hypothesis probability =   8.940943e-01

Photon flux (15-150 keV)    in 1.384 sec: 2.80723 ( -0.19251  0.19236 ) ph/cm2/s
Energy fluence (15-150 keV)             : 2.74377e-07 ( -2.253e-08  2.28968e-08 ) ergs/cm2
Band function

Time interval is from   -0.052 sec. to    1.332 sec.


Spectral model in the Band function:
------------------------------------------------------------
Parameters  : value       lower 90%   higher 90%
alpha       :    (     )
beta        :     (     )
Epeak [keV] :       (   )
Norm@50keV   :     (     )
------------------------------------------------------------

Photon flux (15-150 keV)    in  sec:  (    ) ph/cm2/s
Energy fluence (15-150 keV)             : 0 ( 0  0 ) ergs/cm2
Single BB

Spectral model blackbody:
------------------------------------------------------------
Parameters  : value    Lower 90%  Upper 90%
kT [keV]    : 13.9844  (-0.958851  1.03298)
R^2/D10^2   : 0.432203  (-0.0975403   0.124789)
(R is the radius in km and D10 is the distance to the source in units of 10 kpc)
------------------------------------------------------------
#Fit statistic : Chi-Squared =          71.16 using 59 PHA bins.
# Reduced chi-squared =          1.248 for     57 degrees of freedom
# Null hypothesis probability =   9.827517e-02

Energy  Fluence     90% Error
[keV]   [erg/cm2]   [erg/cm2]
15- 25  2.471e-08   2.927e-09
25- 50  9.181e-08   7.280e-09
50-150  1.182e-07   1.620e-08
15-150  2.347e-07   1.917e-08
Thermal bremsstrahlung (OTTB)

Spectral model: thermal bremsstrahlung
------------------------------------------------------------
Parameters  : value         Lower 90%    Upper 90%
kT [keV]    : 158.672       (-39.0815      -158.868)
Norm        : 12.1290       (-0.842095     0.899479)
------------------------------------------------------------
#Fit statistic : Chi-Squared =          48.88 using 59 PHA bins.
# Reduced chi-squared =         0.8576 for     57 degrees of freedom
# Null hypothesis probability =   7.692299e-01

Energy  Fluence     90% Error
[keV]   [erg/cm2]   [erg/cm2]
15- 25  4.290e-08   3.522e-09
25- 50  8.015e-08   1.262e-08
50-150  1.618e-07   6.202e-08
15-150  2.849e-07   6.989e-08
Double BB

Spectral model: bbodyrad<1> + bbodyrad<2>
------------------------------------------------------------
Parameters  : value         Lower 90%    Upper 90%
kT1 [keV]   : 4.82493        (-1.38644      2.4656)
R1^2/D10^2  : 8.51027        (-6.41697      28.9402)
kT2 [keV]   : 17.3506        (-1.95278      3.62683)
R2^2/D10^2  : 0.174571    (-0.0984789   0.0876741)
------------------------------------------------------------
#Fit statistic : Chi-Squared =          43.24 using 59 PHA bins.
# Reduced chi-squared =         0.7861 for     55 degrees of freedom
# Null hypothesis probability =   8.746339e-01

Energy  Fluence     90% Error
[keV]   [erg/cm2]   [erg/cm2]
15- 25  3.951e-08   1.591e-08
25- 50  8.103e-08   1.841e-08
50-150  1.437e-07   2.686e-08
15-150  2.643e-07   4.588e-08
Peak spectrum fit
Power-law model

Time interval is from   -0.052 sec. to    0.948 sec.

Spectral model in power-law:
------------------------------------------------------------
Parameters  : value       lower 90%   higher 90%
Photon index: 1.54038     ( -0.101711   0.103043 )
Norm@50keV  : 2.86945E-02    ( -0.00188634   0.00187848 )
------------------------------------------------------------
#Fit statistic : Chi-Squared =          69.57 using 59 PHA bins.
# Reduced chi-squared =          1.220 for     57 degrees of freedom
# Null hypothesis probability =   1.227152e-01

Photon flux (15-150 keV)    in 1 sec: 3.62263 ( -0.23014  0.23025 ) ph/cm2/s
Energy fluence (15-150 keV)             : 2.70545e-07 ( -1.92407e-08  1.93695e-08 ) ergs/cm2
Cutoff power-law model

Time interval is from   -0.052 sec. to    0.948 sec.
Spectral model in the cutoff power-law:
------------------------------------------------------------
Parameters  : value       lower 90%   higher 90%
Photon index: 0.449360     ( -0.541507   0.479801 )
Epeak [keV] : 69.6771      ( -9.46611 18.4737 )
Norm@50keV  : 0.104544    ( -0.0445468   0.0910979 )
------------------------------------------------------------
#Fit statistic : Chi-Squared =          52.33 using 59 PHA bins.
# Reduced chi-squared =         0.9344 for     56 degrees of freedom
# Null hypothesis probability =   6.146787e-01

Photon flux (15-150 keV)    in 1 sec: 3.49799 ( -0.23704  0.23674 ) ph/cm2/s
Energy fluence (15-150 keV)             : 2.53087e-07 ( -2.04654e-08  2.07297e-08 ) ergs/cm2
Band function

Time interval is from   -0.052 sec. to    0.948 sec.


Spectral model in the Band function:
------------------------------------------------------------
Parameters  : value       lower 90%   higher 90%
alpha       :    (     )
beta        :     (     )
Epeak [keV] :       (   )
Norm@50keV   :     (     )
------------------------------------------------------------

Photon flux (15-150 keV)    in  sec:  (    ) ph/cm2/s
Energy fluence (15-150 keV)             : 0 ( 0  0 ) ergs/cm2
Single BB

Spectral model blackbody:
------------------------------------------------------------
Parameters  : value    Lower 90%  Upper 90%
kT [keV]    : 14.4569  (-0.973068  1.04748)
R^2/D10^2   : 0.489903  (-0.108146   0.137158)
(R is the radius in km and D10 is the distance to the source in units of 10 kpc)
------------------------------------------------------------
#Fit statistic : Chi-Squared =          77.49 using 59 PHA bins.
# Reduced chi-squared =          1.359 for     57 degrees of freedom
# Null hypothesis probability =   3.683538e-02

Energy  Fluence     90% Error
[keV]   [erg/cm2]   [erg/cm2]
15- 25  2.155e-08   2.440e-09
25- 50  8.271e-08   6.725e-09
50-150  1.157e-07   1.409e-08
15-150  2.199e-07   1.690e-08
Thermal bremsstrahlung (OTTB)

Spectral model: thermal bremsstrahlung
------------------------------------------------------------
Parameters  : value         Lower 90%    Upper 90%
kT [keV]    : 188.446       (-51.5239      -190.109)
Norm        : 14.9433       (-0.960912     1.01694)
------------------------------------------------------------
#Fit statistic : Chi-Squared =          60.72 using 59 PHA bins.
# Reduced chi-squared =          1.065 for     57 degrees of freedom
# Null hypothesis probability =   3.432992e-01

Energy  Fluence     90% Error
[keV]   [erg/cm2]   [erg/cm2]
15- 25  3.748e-08   3.485e-09
25- 50  7.161e-08   2.025e-08
50-150  1.541e-07   6.825e-08
15-150  2.632e-07   8.350e-08
Double BB

Spectral model: bbodyrad<1> + bbodyrad<2>
------------------------------------------------------------
Parameters  : value         Lower 90%    Upper 90%
kT1 [keV]   : 5.05757        (-1.53525      3.27708)
R1^2/D10^2  : 8.03717        (-6.30952      28.8357)
kT2 [keV]   : 17.7664        (-2.01784      4.86941)
R2^2/D10^2  : 0.206171    (-0.136689   0.105412)
------------------------------------------------------------
#Fit statistic : Chi-Squared =          52.94 using 59 PHA bins.
# Reduced chi-squared =         0.9625 for     55 degrees of freedom
# Null hypothesis probability =   5.538890e-01

Energy  Fluence     90% Error
[keV]   [erg/cm2]   [erg/cm2]
15- 25  3.354e-08   1.284e-08
25- 50  7.366e-08   1.469e-08
50-150  1.374e-07   2.641e-08
15-150  2.446e-07   4.440e-08
Pre-slew spectrum (Pre-slew PHA with pre-slew DRM)
Power-law model
Spectral model in power-law:
------------------------------------------------------------
Parameters  : value       lower 90%   higher 90%
Photon index: 1.59876     ( -0.104776   0.106402 )
Norm@50keV  : 2.27103E-02    ( -0.00151234   0.00150414 )
------------------------------------------------------------
#Fit statistic : Chi-Squared =          57.46 using 59 PHA bins.
# Reduced chi-squared =          1.008 for     57 degrees of freedom
# Null hypothesis probability =   4.580432e-01

Photon flux (15-150 keV)    in 1.384 sec: 2.91726 ( -0.185247  0.185356 ) ph/cm2/s
Energy fluence (15-150 keV)             : 2.93993e-07 ( -2.10039e-08  2.11478e-08 ) ergs/cm2
Cutoff power-law model
Spectral model in the cutoff power-law:
------------------------------------------------------------
Parameters  : value       lower 90%   higher 90%
Photon index: 0.588052     ( -0.545776   0.484203 )
Epeak [keV] : 67.6269      ( -9.58309 20.0558 )
Norm@50keV  : 7.57856E-02    ( -0.0326753   0.0674652 )
------------------------------------------------------------
#Fit statistic : Chi-Squared =          43.23 using 59 PHA bins.
# Reduced chi-squared =         0.7720 for     56 degrees of freedom
# Null hypothesis probability =   8.940943e-01

Photon flux (15-150 keV)    in 1.384 sec: 2.80694 ( -0.19247  0.1923 ) ph/cm2/s
Energy fluence (15-150 keV)             : 2.74473e-07 ( -2.25578e-08  2.2908e-08 ) ergs/cm2
Band function

Spectral model in the Band function:
------------------------------------------------------------
Parameters  : value       lower 90%   higher 90%
alpha       :    (     )
beta        :     (     )
Epeak [keV] :       (   )
Norm@50keV   :     (     )
------------------------------------------------------------

Photon flux (15-150 keV)    in  sec:  (    ) ph/cm2/s
Energy fluence (15-150 keV)             : 0 ( 0  0 ) ergs/cm2
S(25-50 keV) vs. S(50-100 keV) plot

S(25-50 keV)  = 7.61e-08
S(50-100 keV) = 1.01e-07
T90 vs. Hardness ratio plot

T90                                   = 1.05599999427795 sec.
Hardness ratio (energy fluence ratio) = 1.3272
Color vs. Color plot

Count Ratio  (25-50 keV) / (15-25 keV) = 1.29594
Count Ratio (50-100 keV) / (15-25 keV) = 0.901899
Mask shadow pattern
IMX = 1.805139349500686E-01, IMY = -2.466397747629926E-01
TIME vs. PHA plot around the trigger time

Blue+Cyan dotted lines: Time interval of the scaled map
From 0.000000 to 1.024000
TIME vs. DetID plot around the trigger time

Blue+Cyan dotted lines: Time interval of the scaled map
From 0.000000 to 1.024000
100 us light curve (15-350 keV)
Blue+Cyan dotted lines: Time interval of the scaled map
From 0.000000 to 1.024000
Spacecraft aspect plot

Bright source in the pre-burst/pre-slew/post-slew images
Pre-burst image of 15-350 keV band
Time interval of the image:
-239.016000 -0.052000

# RAcent  DECcent POSerr Theta    Phi  PeakCts   SNR AngSep     Name
#  [deg]    [deg]    ['] [deg]  [deg]                   [']
170.0935 -60.5779   25.5  58.2  -24.4   0.6764   0.5    7.1	Cen X-3
186.8030 -62.7862    4.4  57.9  -14.8   3.0083   2.6    4.1	GX 301-2
303.6396 -58.1132    2.5  38.2   49.4   2.2344   4.6 ------	UNKNOWN
 56.0102 -39.8771    3.0  29.1 -122.2   1.2008   3.9 ------	UNKNOWN
 68.9322 -48.9315    3.2  29.2  -95.5   1.2710   3.6 ------	UNKNOWN
 60.5981 -16.9365    2.7  50.9 -135.4   6.1991   4.3 ------	UNKNOWN
Pre-slew background subtracted image of 15-350 keV band
Time interval of the image:
-0.052000 1.332000

# RAcent  DECcent POSerr Theta    Phi  PeakCts   SNR AngSep     Name
#  [deg]    [deg]    ['] [deg]  [deg]                   [']
170.5887 -60.5932    3.9  58.3  -24.2  -0.3032  -3.0    8.2	Cen X-3
186.4959 -62.7253    4.7  58.0  -14.9   0.2104   2.4    5.2	GX 301-2
331.1148 -36.1819    2.3  39.2   95.5   0.3598   5.1 ------	UNKNOWN
  7.6073  -9.3519    2.0  50.5  155.6   0.4032   5.7 ------	UNKNOWN
346.6387 -63.0661    0.4  17.0   53.8   0.5246  26.1 ------	UNKNOWN
 55.0236 -36.3595    2.1  31.5 -127.5   0.1300   5.6 ------	UNKNOWN
114.3485 -56.5370    2.3  45.8  -57.3   0.3397   5.0 ------	UNKNOWN
Post-slew image of 15-350 keV band
Time interval of the image:
55.684610 363.104000

# RAcent  DECcent POSerr Theta    Phi  PeakCts   SNR AngSep     Name
#  [deg]    [deg]    ['] [deg]  [deg]                   [']
186.8624 -62.8153    6.1  53.2  -28.0  -1.1028  -1.9    6.3	GX 301-2
264.8770 -44.4279    5.3  47.9   32.9  -1.4674  -2.2    5.9	4U 1735-44
332.4278 -21.8234    3.0  42.4  120.9   2.7713   3.9 ------	UNKNOWN
249.4250 -44.6232    3.0  54.1   21.3   3.9331   3.9 ------	UNKNOWN
  6.6332 -29.9270    2.7  35.5  171.3   1.1076   4.2 ------	UNKNOWN
 72.6127 -55.7787    4.7  41.0  -98.2   2.0539   2.5 ------	UNKNOWN
Plot creation:
Fri Oct 26 17:32:56 EDT 2018