Estimated redshift from machine learning (Ukwatta et al. 2016) - may take a few minute to calcaulte
Image
Pre-slew 15.0-350.0 keV image (Event data)
#   RAcent    DECcent   POSerr    Theta     Phi              Peak Cts       SNR   Name
   25.8683   -17.4814   0.0330    28.7501   -42.1467         0.3396585      5.824 TRIG_00851855

Foreground time interval of the image:
 -0.100  15.445 (delta_t =  15.545 [sec])
Background time interval of the image:
-239.856  -0.100 (delta_t = 239.756 [sec])
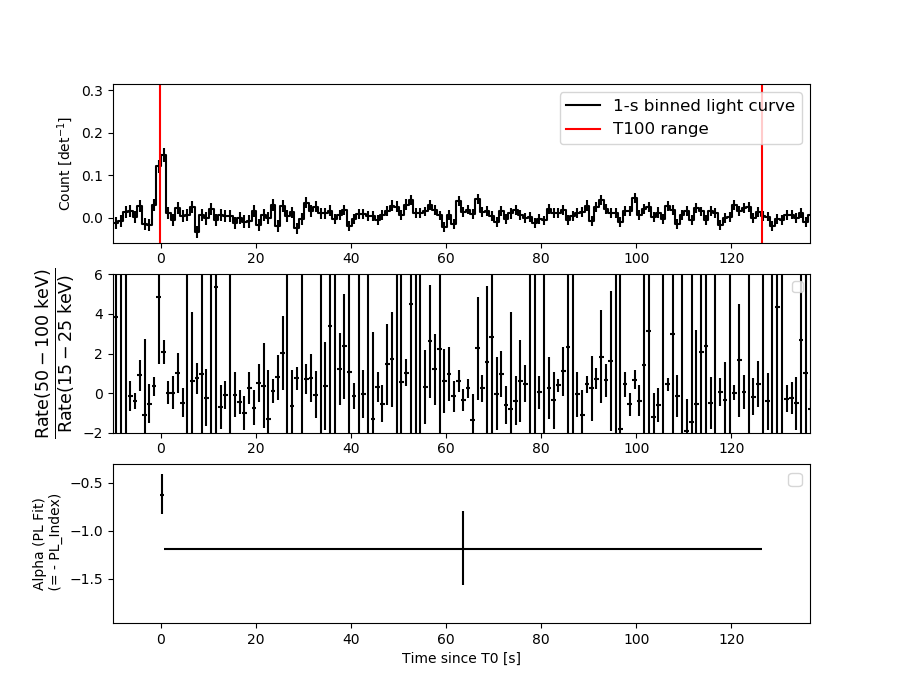
Lightcurves
Notes:
- 1) The mask-weighted light curves are using the flight position.
- 2) Multiple plots of different time binning/intervals are shown to cover all scenarios of short/long GRBs, rate/image triggers, and real/false positives.
- 3) For all the mask-weighted lightcurves, the y-axis units are counts/sec/det where a det is 0.4 x 0.4 = 0.16 sq cm.
- 4) The verticle lines correspond to following: green dotted lines are T50 interval, black dotted lines are T90 interval, blue solid line(s) is a spacecraft slew start time, and orange solid line(s) is a spacecraft slew end time.
- 5) Time of each bin is in the middle of the bin.
1 s binning
From T0-310 s to T0+310 s

From T100_start - 20 s to T100_end + 30 s

Full time interval

64 ms binning
Full time interval

From T100_start to T100_end
From T0-5 sec to T0+5 sec
16 ms binning
From T100_start-5 s to T100_start+5 s
Blue+Cyan dotted lines: Time interval of the scaled map
From 0.000000 to 0.256000
8 ms binning
From T100_start-3 s to T100_start+3 s
Blue+Cyan dotted lines: Time interval of the scaled map
From 0.000000 to 0.256000
2 ms binning
From T100_start-1 s to T100_start+1 s
Blue+Cyan dotted lines: Time interval of the scaled map
From 0.000000 to 0.256000
SN=5 or 10 sec. binning (whichever binning is satisfied first)
SN=5 or 10 sec. binning (T < 200 sec)

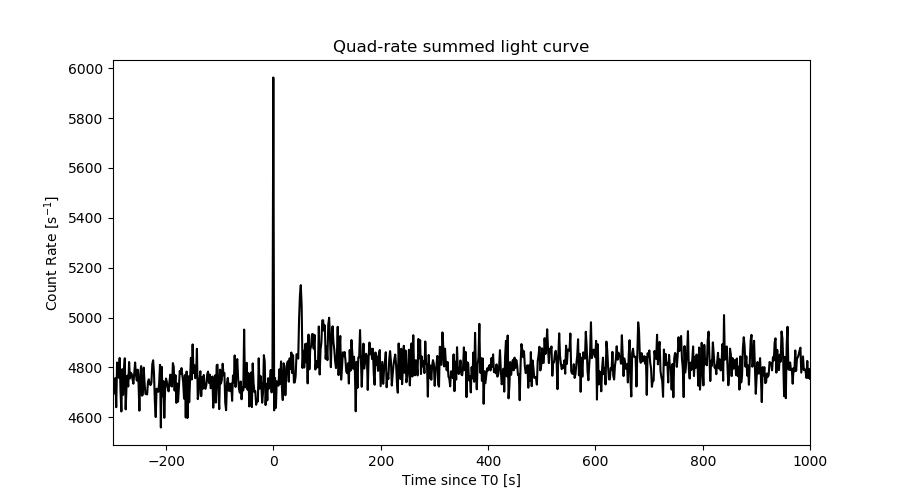
Quad-rate summed light curves (from T0-300s to T0+1000s)
Spectral Evolution
Spectra
Notes:
- 1) The fitting includes the systematic errors.
- 2) When the burst includes telescope slew time periods, the fitting uses an average response file made from multiple 5-s response files through out the slew time plus single time preiod for the non-slew times, and weighted by the total counts in the corresponding time period using addrmf. An average response file is needed becuase a spectral fit using the pre-slew DRM will introduce some errors in both a spectral shape and a normalization if the PHA file contains a lot of the slew/post-slew time interval.
- 3) For fits to more complicated models (e.g. a power-law over a cutoff power-law), the BAT team has decided to require a chi-square improvement of more than 6 for each extra dof.
Time averaged spectrum fit using the average DRM
Power-law model

Time interval is from   -0.100 sec. to  126.532 sec.

Spectral model in power-law:
------------------------------------------------------------
Parameters  : value       lower 90%   higher 90%
Photon index: 1.08548     ( -0.330275   0.311049 )
Norm@50keV  : 6.48936E-04    ( -0.000113679   0.000113388 )
------------------------------------------------------------
#Fit statistic : Chi-Squared =          54.42 using 59 PHA bins.
# Reduced chi-squared =         0.9548 for     57 degrees of freedom
# Null hypothesis probability =   5.723494e-01

Photon flux (15-150 keV)    in 126.6 sec: 7.51699E-02 ( -0.0135163  0.0135796 ) ph/cm2/s
Energy fluence (15-150 keV)             : 8.63065e-07 ( -1.65293e-07  1.67354e-07 ) ergs/cm2
Cutoff power-law model

Time interval is from   -0.100 sec. to  126.532 sec.
Spectral model in the cutoff power-law:
------------------------------------------------------------
Parameters  : value       lower 90%   higher 90%
Photon index: 1.08468     ( -0.335684   0.310154 )
Epeak [keV] : 9999.36      ( -9999.36 -9999.36 )
Norm@50keV  : 6.52062E-04    ( -0.000113513   0.00165585 )
------------------------------------------------------------
#Fit statistic : Chi-Squared =          54.43 using 59 PHA bins.
# Reduced chi-squared =         0.9719 for     56 degrees of freedom
# Null hypothesis probability =   5.346306e-01

Photon flux (15-150 keV)    in 126.6 sec: 7.52970E-02 ( -0.0139106  0.0135709 ) ph/cm2/s
Energy fluence (15-150 keV)             : 8.64875e-07 ( -1.79302e-07  1.67063e-07 ) ergs/cm2
Band function

Time interval is from   -0.100 sec. to  126.532 sec.


Spectral model in the Band function:
------------------------------------------------------------
Parameters  : value       lower 90%   higher 90%
alpha       :    (     )
beta        :     (     )
Epeak [keV] :       (   )
Norm@50keV   :     (     )
------------------------------------------------------------

Photon flux (15-150 keV)    in  sec:  (    ) ph/cm2/s
Energy fluence (15-150 keV)             : 0 ( 0  0 ) ergs/cm2
Single BB

Spectral model blackbody:
------------------------------------------------------------
Parameters  : value    Lower 90%  Upper 90%
kT [keV]    : 20.0665  (-4.54398  6.80574)
R^2/D10^2   : 3.42649E-03  (-0.00206061   0.00452178)
(R is the radius in km and D10 is the distance to the source in units of 10 kpc)
------------------------------------------------------------
#Fit statistic : Chi-Squared =          62.06 using 59 PHA bins.
# Reduced chi-squared =          1.089 for     57 degrees of freedom
# Null hypothesis probability =   3.005787e-01

Energy  Fluence     90% Error
[keV]   [erg/cm2]   [erg/cm2]
15- 25  3.363e-08   1.348e-08
25- 50  1.679e-07   5.920e-08
50-150  5.013e-07   1.846e-07
15-150  7.029e-07   2.122e-07
Thermal bremsstrahlung (OTTB)

Spectral model: thermal bremsstrahlung
------------------------------------------------------------
Parameters  : value         Lower 90%    Upper 90%
kT [keV]    : 200.000       (-56.1154      -200)
Norm        : 0.309130       (-0.0556878     0.0556878)
------------------------------------------------------------
#Fit statistic : Chi-Squared =          60.46 using 59 PHA bins.
# Reduced chi-squared =          1.061 for     57 degrees of freedom
# Null hypothesis probability =   3.519139e-01

Energy  Fluence     90% Error
[keV]   [erg/cm2]   [erg/cm2]
15- 25  9.750e-08   5.632e-08
25- 50  1.875e-07   1.061e-07
50-150  4.113e-07   2.355e-07
15-150  6.964e-07   4.002e-07
Double BB

------------------------------------------------------------
#Fit statistic : Chi-Squared =          54.53 using 59 PHA bins.
#Fit statistic : Chi-Squared =          54.47 using 59 PHA bins.
#Fit statistic : Chi-Squared =          54.45 using 59 PHA bins.
#Fit statistic : Chi-Squared =          54.43 using 59 PHA bins.
# Reduced chi-squared =         0.9914 for     55 degrees of freedom
# Reduced chi-squared =         0.9903 for     55 degrees of freedom
# Reduced chi-squared =         0.9900 for     55 degrees of freedom
# Reduced chi-squared =         0.9897 for     55 degrees of freedom
# Null hypothesis probability =   4.925535e-01
# Null hypothesis probability =   4.949954e-01
# Null hypothesis probability =   4.956578e-01
# Null hypothesis probability =   4.961636e-01

Energy  Fluence     90% Error
[keV]   [erg/cm2]   [erg/cm2]
15- 25  6.794e-08   4.119e-08
25- 50  1.790e-07   9.868e-08
50-150  6.168e-07   3.406e-07
15-150  8.637e-07   4.551e-07
Peak spectrum fit
Power-law model

Time interval is from   -0.108 sec. to    0.892 sec.

Spectral model in power-law:
------------------------------------------------------------
Parameters  : value       lower 90%   higher 90%
Photon index: 0.785931     ( -0.216181   0.205117 )
Norm@50keV  : 1.48578E-02    ( -0.00195805   0.00193259 )
------------------------------------------------------------
#Fit statistic : Chi-Squared =          57.83 using 59 PHA bins.
# Reduced chi-squared =          1.015 for     57 degrees of freedom
# Null hypothesis probability =   4.444942e-01

Photon flux (15-150 keV)    in 1 sec: 1.70854 ( -0.218  0.21897 ) ph/cm2/s
Energy fluence (15-150 keV)             : 1.74679e-07 ( -2.24666e-08  2.25542e-08 ) ergs/cm2
Cutoff power-law model

Time interval is from   -0.108 sec. to    0.892 sec.
Spectral model in the cutoff power-law:
------------------------------------------------------------
Parameters  : value       lower 90%   higher 90%
Photon index: -0.763505     ( -1.61431   1.123 )
Epeak [keV] : 111.252      ( -26.2527 119.964 )
Norm@50keV  : 6.15484E-02    ( -0.0388905   0.170903 )
------------------------------------------------------------
#Fit statistic : Chi-Squared =          51.66 using 59 PHA bins.
# Reduced chi-squared =         0.9225 for     56 degrees of freedom
# Null hypothesis probability =   6.396535e-01

Photon flux (15-150 keV)    in 1 sec: 1.60611 ( -0.23475  0.23344 ) ph/cm2/s
Energy fluence (15-150 keV)             : 1.65863e-07 ( -2.45344e-08  2.42361e-08 ) ergs/cm2
Band function

Time interval is from   -0.108 sec. to    0.892 sec.


Spectral model in the Band function:
------------------------------------------------------------
Parameters  : value       lower 90%   higher 90%
alpha       :    (     )
beta        :     (     )
Epeak [keV] :       (   )
Norm@50keV   :     (     )
------------------------------------------------------------

Photon flux (15-150 keV)    in  sec:  (    ) ph/cm2/s
Energy fluence (15-150 keV)             : 0 ( 0  0 ) ergs/cm2
Single BB

Spectral model blackbody:
------------------------------------------------------------
Parameters  : value    Lower 90%  Upper 90%
kT [keV]    : 25.1154  (-3.44869  4.44229)
R^2/D10^2   : 4.43938E-02  (-0.017265   0.0256828)
(R is the radius in km and D10 is the distance to the source in units of 10 kpc)
------------------------------------------------------------
#Fit statistic : Chi-Squared =          51.98 using 59 PHA bins.
# Reduced chi-squared =         0.9119 for     57 degrees of freedom
# Null hypothesis probability =   6.633855e-01

Energy  Fluence     90% Error
[keV]   [erg/cm2]   [erg/cm2]
15- 25  4.853e-09   1.202e-09
25- 50  2.759e-08   6.650e-09
50-150  1.290e-07   2.634e-08
15-150  1.614e-07   2.985e-08
Thermal bremsstrahlung (OTTB)

Spectral model: thermal bremsstrahlung
------------------------------------------------------------
Parameters  : value         Lower 90%    Upper 90%
kT [keV]    : 200.000       (-21.7067      -200)
Norm        : 6.72948       (-0.913888     0.913889)
------------------------------------------------------------
#Fit statistic : Chi-Squared =          92.85 using 59 PHA bins.
# Reduced chi-squared =          1.629 for     57 degrees of freedom
# Null hypothesis probability =   1.897687e-03

Energy  Fluence     90% Error
[keV]   [erg/cm2]   [erg/cm2]
15- 25  1.675e-08   9.360e-09
25- 50  3.222e-08   1.805e-08
50-150  7.066e-08   3.953e-08
15-150  1.196e-07   6.640e-08
Double BB

Spectral model: bbodyrad<1> + bbodyrad<2>
------------------------------------------------------------
Parameters  : value         Lower 90%    Upper 90%
kT1 [keV]   : 3.51671        (-3.32176      -3.32176)
R1^2/D10^2  : 6.74820        (-8.30631      -8.30631)
kT2 [keV]   : 26.2261        (-3.85465      -26.1062)
R2^2/D10^2  : 3.83064E-02    (-0.0388721   0.0243068)
------------------------------------------------------------
#Fit statistic : Chi-Squared =          50.48 using 59 PHA bins.
# Reduced chi-squared =         0.9179 for     55 degrees of freedom
# Null hypothesis probability =   6.476252e-01

Energy  Fluence     90% Error
[keV]   [erg/cm2]   [erg/cm2]
15- 25  7.633e-09   3.074e-09
25- 50  2.669e-08   6.910e-09
50-150  1.310e-07   2.959e-08
15-150  1.654e-07   4.007e-08
Pre-slew spectrum (Pre-slew PHA with pre-slew DRM)
Power-law model
Spectral model in power-law:
------------------------------------------------------------
Parameters  : value       lower 90%   higher 90%
Photon index: 0.632131     ( -0.775274   0.617746 )
Norm@50keV  : 1.13668E-03    ( -0.000471067   0.000421466 )
------------------------------------------------------------
#Fit statistic : Chi-Squared =          54.58 using 59 PHA bins.
# Reduced chi-squared =         0.9575 for     57 degrees of freedom
# Null hypothesis probability =   5.664855e-01

Photon flux (15-150 keV)    in 15.54 sec: 0.132225 ( -0.0452757  0.0466049 ) ph/cm2/s
Energy fluence (15-150 keV)             : 2.22472e-07 ( -7.13901e-08  7.17776e-08 ) ergs/cm2
Cutoff power-law model

Spectral model in the cutoff power-law:
------------------------------------------------------------
Parameters  : value       lower 90%   higher 90%
Photon index: 0.619942     ( -0.916772   0.623793 )
Epeak [keV] : 9998.80      ( -9999.29 -9999.29 )
Norm@50keV  : 1.14308E-03    ( -0.000450881   0.0203936 )
------------------------------------------------------------
#Fit statistic : Chi-Squared =          54.58 using 59 PHA bins.
# Reduced chi-squared =         0.9746 for     56 degrees of freedom
# Null hypothesis probability =   5.287688e-01

Photon flux (15-150 keV)    in 15.54 sec: 0.132436 ( -0.0460252  0.046263 ) ph/cm2/s
Energy fluence (15-150 keV)             : 2.22537e-07 ( -7.17707e-08  7.15633e-08 ) ergs/cm2
Band function

Spectral model in the Band function:
------------------------------------------------------------
Parameters  : value       lower 90%   higher 90%
alpha       :    (     )
beta        :     (     )
Epeak [keV] :       (   )
Norm@50keV   :     (     )
------------------------------------------------------------

Photon flux (15-150 keV)    in  sec:  (    ) ph/cm2/s
Energy fluence (15-150 keV)             : 0 ( 0  0 ) ergs/cm2
S(25-50 keV) vs. S(50-100 keV) plot

S(25-50 keV)  = 1.68e-07
S(50-100 keV) = 3.19e-07
T90 vs. Hardness ratio plot
T90                                   = 122.239999890327 sec.
Hardness ratio (energy fluence ratio) = 1.89881
Color vs. Color plot

Count Ratio  (25-50 keV) / (15-25 keV) = 1.21954
Count Ratio (50-100 keV) / (15-25 keV) = 1.26306
Mask shadow pattern
IMX = 4.067641114553334E-01, IMY = 3.681423310960769E-01
TIME vs. PHA plot around the trigger time

Blue+Cyan dotted lines: Time interval of the scaled map
From 0.000000 to 0.256000
TIME vs. DetID plot around the trigger time

Blue+Cyan dotted lines: Time interval of the scaled map
From 0.000000 to 0.256000
100 us light curve (15-350 keV)

Blue+Cyan dotted lines: Time interval of the scaled map
From 0.000000 to 0.256000
Spacecraft aspect plot

Bright source in the pre-burst/pre-slew/post-slew images
Pre-burst image of 15-350 keV band
Time interval of the image:
-239.856000 -0.100000

# RAcent  DECcent POSerr Theta    Phi  PeakCts   SNR AngSep     Name
#  [deg]    [deg]    ['] [deg]  [deg]                   [']
326.2718  38.4038    5.2  52.1  161.8   2.3689   2.2    6.8	Cyg X-2
340.2847 -44.0150    3.1  44.8   36.5   2.2151   3.7 ------	UNKNOWN
  8.9877 -27.7380    2.4  26.0   -1.4   1.1075   4.8 ------	UNKNOWN
Pre-slew background subtracted image of 15-350 keV band
Time interval of the image:
-0.100000 15.444590

# RAcent  DECcent POSerr Theta    Phi  PeakCts   SNR AngSep     Name
#  [deg]    [deg]    ['] [deg]  [deg]                   [']
326.1119  38.1971    5.7  52.0  161.5   0.4263   2.0    8.0	Cyg X-2
333.6822  -6.8009    2.1  27.0   96.7   0.3757   5.5 ------	UNKNOWN
 12.5695 -45.1981    2.0  43.5    3.5   0.4426   5.9 ------	UNKNOWN
 25.8683 -17.4814    2.0  28.8  -42.1   0.3398   5.8 ------	UNKNOWN
 47.2112 -26.3316    2.1  50.4  -41.9   1.1314   5.7 ------	UNKNOWN
Post-slew image of 15-350 keV band
Time interval of the image:
65.644590 962.184400

# RAcent  DECcent POSerr Theta    Phi  PeakCts   SNR AngSep     Name
#  [deg]    [deg]    ['] [deg]  [deg]                   [']
 34.8294 -38.9119    4.0  22.8   -6.9   1.7996   2.9 ------	UNKNOWN
 66.9446 -70.1167    3.7  58.2   -3.8  12.9879   3.1 ------	UNKNOWN
 71.3835 -68.8457    3.1  58.6   -6.1  13.6531   3.7 ------	UNKNOWN
Plot creation:
Fri Oct 26 12:42:49 EDT 2018