Estimated redshift from machine learning (Ukwatta et al. 2016) - may take a few minute to calcaulte
Image
Pre-slew 15.0-350.0 keV image (Event data)
#   RAcent    DECcent   POSerr    Theta     Phi              Peak Cts       SNR   Name
  274.2633    46.6427   0.0218    30.3233   -48.3657         0.3432554      8.807 TRIG_00859282

Foreground time interval of the image:
  0.280   6.556 (delta_t =   6.276 [sec])
Background time interval of the image:
-239.952   0.280 (delta_t = 240.232 [sec])
Lightcurves
Notes:
- 1) The mask-weighted light curves are using the flight position.
- 2) Multiple plots of different time binning/intervals are shown to cover all scenarios of short/long GRBs, rate/image triggers, and real/false positives.
- 3) For all the mask-weighted lightcurves, the y-axis units are counts/sec/det where a det is 0.4 x 0.4 = 0.16 sq cm.
- 4) The verticle lines correspond to following: green dotted lines are T50 interval, black dotted lines are T90 interval, blue solid line(s) is a spacecraft slew start time, and orange solid line(s) is a spacecraft slew end time.
- 5) Time of each bin is in the middle of the bin.
1 s binning
From T0-310 s to T0+310 s
From T100_start - 20 s to T100_end + 30 s
Full time interval

64 ms binning
Full time interval
From T100_start to T100_end
From T0-5 sec to T0+5 sec
16 ms binning
From T100_start-5 s to T100_start+5 s
Blue+Cyan dotted lines: Time interval of the scaled map
From 0.000000 to 5.504000
8 ms binning
From T100_start-3 s to T100_start+3 s
Blue+Cyan dotted lines: Time interval of the scaled map
From 0.000000 to 5.504000
2 ms binning
From T100_start-1 s to T100_start+1 s
Blue+Cyan dotted lines: Time interval of the scaled map
From 0.000000 to 5.504000
SN=5 or 10 sec. binning (whichever binning is satisfied first)
SN=5 or 10 sec. binning (T < 200 sec)
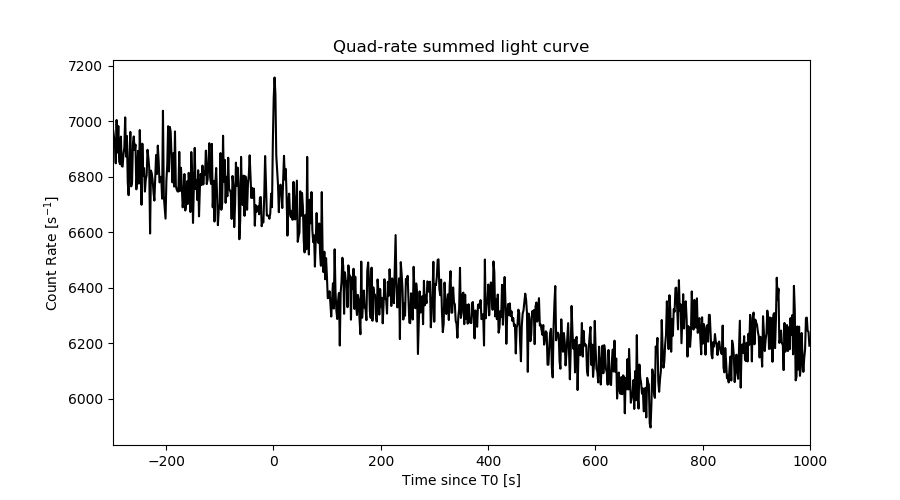
Quad-rate summed light curves (from T0-300s to T0+1000s)
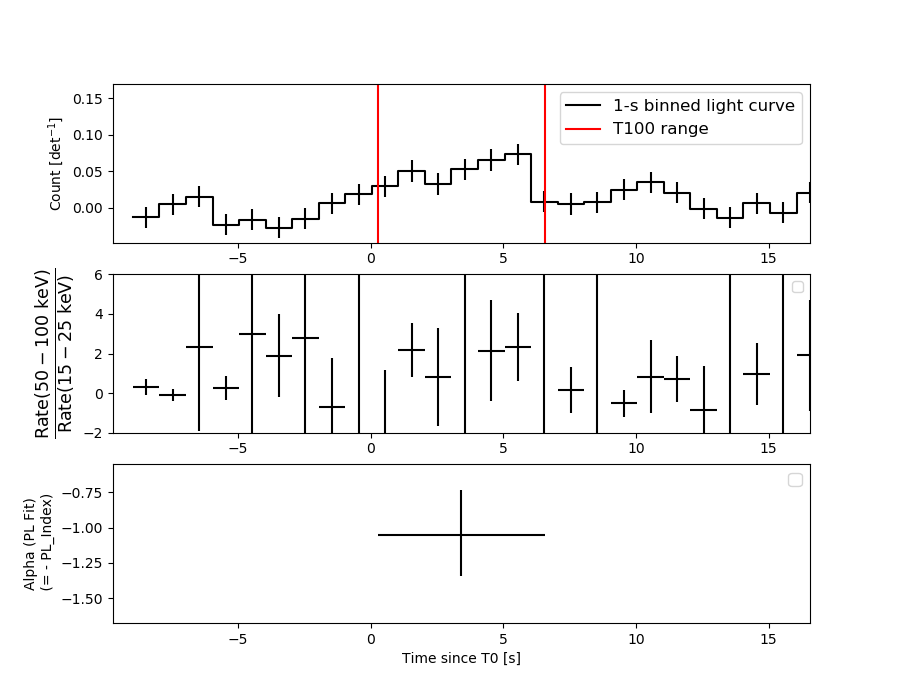
Spectral Evolution
Spectra
Notes:
- 1) The fitting includes the systematic errors.
- 2) When the burst includes telescope slew time periods, the fitting uses an average response file made from multiple 5-s response files through out the slew time plus single time preiod for the non-slew times, and weighted by the total counts in the corresponding time period using addrmf. An average response file is needed becuase a spectral fit using the pre-slew DRM will introduce some errors in both a spectral shape and a normalization if the PHA file contains a lot of the slew/post-slew time interval.
- 3) For fits to more complicated models (e.g. a power-law over a cutoff power-law), the BAT team has decided to require a chi-square improvement of more than 6 for each extra dof.
Time averaged spectrum fit using the average DRM
Power-law model

Time interval is from    0.280 sec. to    6.556 sec.

Spectral model in power-law:
------------------------------------------------------------
Parameters  : value       lower 90%   higher 90%
Photon index: 1.04961     ( -0.313143   0.291899 )
Norm@50keV  : 3.53167E-03    ( -0.000639679   0.000635377 )
------------------------------------------------------------
#Fit statistic : Chi-Squared =          54.81 using 59 PHA bins.
# Reduced chi-squared =         0.9617 for     57 degrees of freedom
# Null hypothesis probability =   5.575284e-01

Photon flux (15-150 keV)    in 6.276 sec: 0.407891 ( -0.075622  0.076209 ) ph/cm2/s
Energy fluence (15-150 keV)             : 2.3562e-07 ( -4.39687e-08  4.4344e-08 ) ergs/cm2
Cutoff power-law model
Time interval is from    0.280 sec. to    6.556 sec.
Spectral model in the cutoff power-law:
------------------------------------------------------------
Parameters  : value       lower 90%   higher 90%
Photon index: 4.62091E-02     ( -1.77992   1.12653 )
Epeak [keV] : 101.946      ( -34.2453 -101.948 )
Norm@50keV  : 1.08115E-02    ( -0.0108112   0.0638063 )
------------------------------------------------------------
#Fit statistic : Chi-Squared =          53.11 using 59 PHA bins.
# Reduced chi-squared =         0.9484 for     56 degrees of freedom
# Null hypothesis probability =   5.850411e-01

Photon flux (15-150 keV)    in 6.276 sec: 0.392608 ( -0.078255  0.078818 ) ph/cm2/s
Energy fluence (15-150 keV)             : 2.18309e-07 ( -5.12184e-08  5.05176e-08 ) ergs/cm2
Band function

Time interval is from    0.280 sec. to    6.556 sec.


Spectral model in the Band function:
------------------------------------------------------------
Parameters  : value       lower 90%   higher 90%
alpha       :    (     )
beta        :     (     )
Epeak [keV] :       (   )
Norm@50keV   :     (     )
------------------------------------------------------------

Photon flux (15-150 keV)    in  sec:  (    ) ph/cm2/s
Energy fluence (15-150 keV)             : 0 ( 0  0 ) ergs/cm2
Single BB

Spectral model blackbody:
------------------------------------------------------------
Parameters  : value    Lower 90%  Upper 90%
kT [keV]    : 18.8170  (-3.75641  5.30323)
R^2/D10^2   : 2.40253E-02  (-0.01343   0.0268055)
(R is the radius in km and D10 is the distance to the source in units of 10 kpc)
------------------------------------------------------------
#Fit statistic : Chi-Squared =          55.36 using 59 PHA bins.
# Reduced chi-squared =         0.9713 for     57 degrees of freedom
# Null hypothesis probability =   5.367612e-01

Energy  Fluence     90% Error
[keV]   [erg/cm2]   [erg/cm2]
15- 25  1.053e-08   3.945e-09
25- 50  5.030e-08   1.662e-08
50-150  1.306e-07   4.622e-08
15-150  1.915e-07   5.554e-08
Thermal bremsstrahlung (OTTB)

Spectral model: thermal bremsstrahlung
------------------------------------------------------------
Parameters  : value         Lower 90%    Upper 90%
kT [keV]    : 200.000       (-51.7784      -200)
Norm        : 1.71342       (-0.315147     0.315147)
------------------------------------------------------------
#Fit statistic : Chi-Squared =          61.56 using 59 PHA bins.
# Reduced chi-squared =          1.080 for     57 degrees of freedom
# Null hypothesis probability =   3.163729e-01

Energy  Fluence     90% Error
[keV]   [erg/cm2]   [erg/cm2]
15- 25  2.678e-08   1.564e-08
25- 50  5.151e-08   2.934e-08
50-150  1.130e-07   6.445e-08
15-150  1.913e-07   1.083e-07
Double BB

#Fit statistic : Chi-Squared =          50.36 using 59 PHA bins.
# Reduced chi-squared =         0.9204 for     55 degrees of freedom
# Reduced chi-squared =         0.9197 for     55 degrees of freedom
# Reduced chi-squared =         0.9193 for     55 degrees of freedom
# Reduced chi-squared =         0.9189 for     55 degrees of freedom
# Reduced chi-squared =         0.9186 for     55 degrees of freedom
# Reduced chi-squared =         0.9155 for     55 degrees of freedom
# Null hypothesis probability =   6.424099e-01
# Null hypothesis probability =   6.437955e-01
# Null hypothesis probability =   6.447357e-01
# Null hypothesis probability =   6.456012e-01
# Null hypothesis probability =   6.461607e-01
# Null hypothesis probability =   6.524409e-01

Energy  Fluence     90% Error
[keV]   [erg/cm2]   [erg/cm2]
15- 25  1.517e-08   8.859e-09
25- 50  5.463e-08   3.163e-08
50-150  1.586e-07   8.281e-08
15-150  2.284e-07   1.083e-07
Peak spectrum fit
Power-law model

Time interval is from    5.136 sec. to    6.136 sec.

Spectral model in power-law:
------------------------------------------------------------
Parameters  : value       lower 90%   higher 90%
Photon index: 1.25720     ( -0.705774   0.672104 )
Norm@50keV  : 4.17168E-03    ( -0.00153365   0.00153332 )
------------------------------------------------------------
#Fit statistic : Chi-Squared =          47.08 using 59 PHA bins.
# Reduced chi-squared =         0.8260 for     57 degrees of freedom
# Null hypothesis probability =   8.226902e-01

Photon flux (15-150 keV)    in 1 sec: 0.493984 ( -0.188272  0.190162 ) ph/cm2/s
Energy fluence (15-150 keV)             : 4.16764e-08 ( -1.65182e-08  1.68754e-08 ) ergs/cm2
Cutoff power-law model

Time interval is from    5.136 sec. to    6.136 sec.
Spectral model in the cutoff power-law:
------------------------------------------------------------
Parameters  : value       lower 90%   higher 90%
Photon index: 0.732676     ( -0.730524   6.48216 )
Epeak [keV] : 133.639      ( -133.244 -133.244 )
Norm@50keV  : 7.28158E-03    (     )
------------------------------------------------------------
#Fit statistic : Chi-Squared =          47.00 using 59 PHA bins.
# Reduced chi-squared =         0.8392 for     56 degrees of freedom
# Null hypothesis probability =   7.988119e-01

Photon flux (15-150 keV)    in 1 sec: 0.481938 ( -0.248521  0.198831 ) ph/cm2/s
Energy fluence (15-150 keV)             : 4.05425e-08 ( -1.74702e-08  1.77282e-08 ) ergs/cm2
Band function

Time interval is from    5.136 sec. to    6.136 sec.


Spectral model in the Band function:
------------------------------------------------------------
Parameters  : value       lower 90%   higher 90%
alpha       :    (     )
beta        :     (     )
Epeak [keV] :       (   )
Norm@50keV   :     (     )
------------------------------------------------------------

Photon flux (15-150 keV)    in  sec:  (    ) ph/cm2/s
Energy fluence (15-150 keV)             : 0 ( 0  0 ) ergs/cm2
Single BB

Spectral model blackbody:
------------------------------------------------------------
Parameters  : value    Lower 90%  Upper 90%
kT [keV]    : 19.3493  (-6.61519  12.248)
R^2/D10^2   : 2.54593E-02  (-0.0254596   0.0774183)
(R is the radius in km and D10 is the distance to the source in units of 10 kpc)
------------------------------------------------------------
#Fit statistic : Chi-Squared =          47.61 using 59 PHA bins.
# Reduced chi-squared =         0.8353 for     57 degrees of freedom
# Null hypothesis probability =   8.076638e-01

Energy  Fluence     90% Error
[keV]   [erg/cm2]   [erg/cm2]
15- 25  1.861e-09   1.188e-09
25- 50  9.066e-09   5.535e-09
50-150  2.503e-08   1.733e-08
15-150  3.596e-08   2.318e-08
Thermal bremsstrahlung (OTTB)

Spectral model: thermal bremsstrahlung
------------------------------------------------------------
Parameters  : value         Lower 90%    Upper 90%
kT [keV]    : 199.363       (-199.363      -199.363)
Norm        : 2.06407       (-0.770054     0.770074)
------------------------------------------------------------
#Fit statistic : Chi-Squared =          47.65 using 59 PHA bins.
# Reduced chi-squared =         0.8361 for     57 degrees of freedom
# Null hypothesis probability =   8.064421e-01

Energy  Fluence     90% Error
[keV]   [erg/cm2]   [erg/cm2]
15- 25  5.140e-09   3.244e-09
25- 50  9.887e-09   6.275e-09
50-150  2.168e-08   1.432e-08
15-150  3.671e-08   2.285e-08
Double BB

------------------------------------------------------------
Parameters  : value         Lower 90%    Upper 90%
kT1 [keV]   : 2.51799        (-3.95827      24.5672)
R1^2/D10^2  : 39.3980        (-52.4299      -52.4299)
kT2 [keV]   : 20.9171        (-7.30398      -20.8018)
R2^2/D10^2  : 1.89130E-02    (-0.0194728   0.049285)
------------------------------------------------------------
#Fit statistic : Chi-Squared =          46.46 using 59 PHA bins.
#Fit statistic : Chi-Squared =          46.43 using 59 PHA bins.
# Reduced chi-squared =         0.8447 for     55 degrees of freedom
# Reduced chi-squared =         0.8442 for     55 degrees of freedom
# Null hypothesis probability =   7.871569e-01
# Null hypothesis probability =   7.879264e-01

Energy  Fluence     90% Error
[keV]   [erg/cm2]   [erg/cm2]
15- 25  4.258e-09   2.252e-09
25- 50  8.437e-09   4.951e-09
50-150  2.652e-08   1.772e-08
15-150  3.921e-08   2.281e-08
Pre-slew spectrum (Pre-slew PHA with pre-slew DRM)
Power-law model

Spectral model in power-law:
------------------------------------------------------------
Parameters  : value       lower 90%   higher 90%
Photon index: 1.04961     ( -0.313143   0.291899 )
Norm@50keV  : 3.53167E-03    ( -0.000639679   0.000635377 )
------------------------------------------------------------
#Fit statistic : Chi-Squared =          54.81 using 59 PHA bins.
# Reduced chi-squared =         0.9617 for     57 degrees of freedom
# Null hypothesis probability =   5.575284e-01

Photon flux (15-150 keV)    in 6.276 sec: 0.407897 ( -0.0756243  0.0762003 ) ph/cm2/s
Energy fluence (15-150 keV)             : 2.356e-07 ( -4.39626e-08  4.43701e-08 ) ergs/cm2
Cutoff power-law model

Spectral model in the cutoff power-law:
------------------------------------------------------------
Parameters  : value       lower 90%   higher 90%
Photon index: 4.59422E-02     ( -1.78007   1.12638 )
Epeak [keV] : 101.949      ( -34.3245 -101.948 )
Norm@50keV  : 1.08126E-02    ( -0.010811   0.0638063 )
------------------------------------------------------------
#Fit statistic : Chi-Squared =          53.11 using 59 PHA bins.
# Reduced chi-squared =         0.9484 for     56 degrees of freedom
# Null hypothesis probability =   5.850410e-01

Photon flux (15-150 keV)    in 6.276 sec: 0.392602 ( -0.078254  0.078797 ) ph/cm2/s
Energy fluence (15-150 keV)             : 2.18397e-07 ( -5.12423e-08  5.06737e-08 ) ergs/cm2
Band function
Spectral model in the Band function:
------------------------------------------------------------
Parameters  : value       lower 90%   higher 90%
alpha       :    (     )
beta        :     (     )
Epeak [keV] :       (   )
Norm@50keV   :     (     )
------------------------------------------------------------

Photon flux (15-150 keV)    in  sec:  (    ) ph/cm2/s
Energy fluence (15-150 keV)             : 0 ( 0  0 ) ergs/cm2
S(25-50 keV) vs. S(50-100 keV) plot
S(25-50 keV)  = 4.51e-08
S(50-100 keV) = 8.72e-08
T90 vs. Hardness ratio plot
T90                                   = 4.63199985027313 sec.
Hardness ratio (energy fluence ratio) = 1.93348
Color vs. Color plot
Count Ratio  (25-50 keV) / (15-25 keV) = 3.3271
Count Ratio (50-100 keV) / (15-25 keV) = 2.92374
Mask shadow pattern
IMX = 3.885904303817314E-01, IMY = 4.371533128550065E-01
TIME vs. PHA plot around the trigger time

Blue+Cyan dotted lines: Time interval of the scaled map
From 0.000000 to 5.504000
TIME vs. DetID plot around the trigger time
Blue+Cyan dotted lines: Time interval of the scaled map
From 0.000000 to 5.504000
100 us light curve (15-350 keV)
Blue+Cyan dotted lines: Time interval of the scaled map
From 0.000000 to 5.504000
Spacecraft aspect plot

Bright source in the pre-burst/pre-slew/post-slew images
Pre-burst image of 15-350 keV band
Time interval of the image:
-239.952000 0.280000

# RAcent  DECcent POSerr Theta    Phi  PeakCts   SNR AngSep     Name
#  [deg]    [deg]    ['] [deg]  [deg]                   [']
254.4651  35.4125    5.2  39.2  -77.5   1.8659   2.2    4.2	Her X-1
268.2934  -1.4814    9.0  37.1 -143.0   0.4602   1.3    4.8	SW J1753.5-0127
270.2991 -25.1455    4.4  54.5 -166.0   2.0289   2.6    4.1	GX 5-1
270.2929 -25.7120    5.1  55.0 -166.3   1.8634   2.3    1.9	GRS 1758-258
273.8797 -14.0864   10.4  43.3 -162.1   0.4310   1.1    7.9	GX 17+2
276.0143 -30.3747   72.3  56.8 -174.3   0.1844   0.2    4.6	H1820-303
285.1582 -24.8964    2.5  49.0  178.3   2.3456   4.5    6.8	HT1900.1-2455
288.8216  10.9612    1.4  14.2 -160.3   1.7804   8.5    1.7	GRS 1915+105
299.6233  35.1849    1.6  12.7   -7.5   1.5651   7.0    1.9	Cyg X-1
308.1557  40.9574    2.5  20.5    7.8   0.9867   4.6    2.1	Cyg X-3
326.4021  38.3710    0.0  29.4   34.7   0.2838   1.1   11.2	Cyg X-2
342.2377  22.0369    3.3  41.4   65.6   3.2079   3.5 ------	UNKNOWN
333.9237   9.4627    2.5  37.5   88.3   2.9443   4.6 ------	UNKNOWN
307.5253 -25.3226    2.6  49.0  151.4   3.7462   4.5 ------	UNKNOWN
356.6704  55.1754    3.3  54.3   21.0   4.5478   3.5 ------	UNKNOWN
309.0589 -16.1098    2.9  40.4  146.1   1.9307   4.0 ------	UNKNOWN
304.0664  -1.2615    2.7  24.8  147.3   1.0428   4.4 ------	UNKNOWN
300.2298  12.1741    2.4  10.8  148.1   0.9310   4.9 ------	UNKNOWN
278.0897  -0.1483    2.2  29.5 -154.4   1.3083   5.2 ------	UNKNOWN
256.5636 -15.3031    3.4  55.0 -146.1   4.9711   3.4 ------	UNKNOWN
Pre-slew background subtracted image of 15-350 keV band
Time interval of the image:
0.280000 6.556000

# RAcent  DECcent POSerr Theta    Phi  PeakCts   SNR AngSep     Name
#  [deg]    [deg]    ['] [deg]  [deg]                   [']
254.3875  35.4221    7.6  39.3  -77.5   0.1422   1.5    5.9	Her X-1
268.3658  -1.5534    3.9  37.1 -143.1  -0.1304  -3.0    6.1	SW J1753.5-0127
270.2085 -25.0540    2.7  54.4 -165.9  -0.4158  -4.2    4.4	GX 5-1
270.3123 -25.6019    5.1  54.9 -166.3   0.2513   2.4    8.5	GRS 1758-258
273.9789 -13.8969    7.2  43.1 -162.1  -0.0764  -1.6    8.5	GX 17+2
275.9188 -30.5246    9.6  57.0 -174.3   0.1924   1.2    9.5	H1820-303
284.9748 -24.9820    8.8  49.1  178.5  -0.1002  -1.3    5.0	HT1900.1-2455
288.6852  10.8679    3.9  14.3 -160.1   0.0785   3.0    8.1	GRS 1915+105
299.7836  35.2152    7.3  12.8   -6.9   0.0424   1.6    9.5	Cyg X-1
308.2545  41.0695    4.6  20.6    7.8  -0.0665  -2.5    9.6	Cyg X-3
326.0859  38.4606    9.1  29.2   34.3   0.0433   1.3    9.3	Cyg X-2
310.9625  22.3919    2.3  12.7   72.2   0.1454   5.1 ------	UNKNOWN
275.6054 -17.3934    2.2  45.3 -166.6   0.2489   5.3 ------	UNKNOWN
279.6239  22.1937    1.9  16.3 -104.5   0.1902   6.2 ------	UNKNOWN
274.2633  46.6427    1.3  30.3  -48.4   0.3433   8.8 ------	UNKNOWN
253.9483  43.5083    2.5  41.2  -65.3   0.4294   4.5 ------	UNKNOWN
Post-slew image of 15-350 keV band
Time interval of the image:
111.948680 694.148610

# RAcent  DECcent POSerr Theta    Phi  PeakCts   SNR AngSep     Name
#  [deg]    [deg]    ['] [deg]  [deg]                   [']
254.2963  35.5093    0.0  18.6 -139.2   1.0125   2.5   12.7	Her X-1
268.3822  -1.3036    6.9  48.2  168.2   1.8098   1.7    9.0	SW J1753.5-0127
288.5999  10.8954    3.5  37.7  136.9   2.8141   3.4   12.1	GRS 1915+105
299.5893  35.2151    1.7  22.1   92.2   3.5621   7.0    0.8	Cyg X-1
308.0745  40.9755    2.4  24.8   71.0   2.4727   4.8    2.1	Cyg X-3
326.2957  38.2151    3.9  38.6   63.5   3.1461   3.0    8.7	Cyg X-2
295.6802  67.0510    2.4  23.3    1.4   1.9369   4.8 ------	UNKNOWN
Plot creation:
Fri Oct 26 12:27:28 EDT 2018