Estimated redshift from machine learning (Ukwatta et al. 2016) - may take a few minute to calcaulte
Image
Pre-slew 15.0-350.0 keV image (Event data)

#   RAcent    DECcent   POSerr    Theta     Phi              Peak Cts       SNR   Name
   91.0384    -4.5922   0.0135    42.8595   162.2173         3.5341083     14.218 TRIG_00859421

Foreground time interval of the image:
-12.499  72.101 (delta_t =  84.600 [sec])
Background time interval of the image:
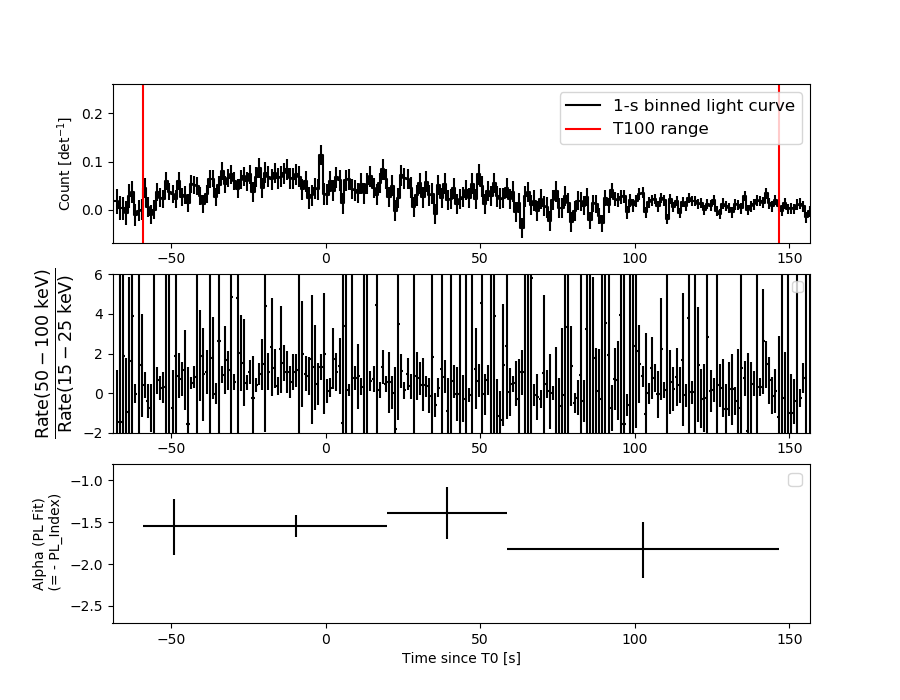
Lightcurves
Notes:
- 1) The mask-weighted light curves are using the flight position.
- 2) Multiple plots of different time binning/intervals are shown to cover all scenarios of short/long GRBs, rate/image triggers, and real/false positives.
- 3) For all the mask-weighted lightcurves, the y-axis units are counts/sec/det where a det is 0.4 x 0.4 = 0.16 sq cm.
- 4) The verticle lines correspond to following: green dotted lines are T50 interval, black dotted lines are T90 interval, blue solid line(s) is a spacecraft slew start time, and orange solid line(s) is a spacecraft slew end time.
- 5) Time of each bin is in the middle of the bin.
1 s binning
From T0-310 s to T0+310 s

From T100_start - 20 s to T100_end + 30 s
Full time interval

64 ms binning
Full time interval

From T100_start to T100_end
From T0-5 sec to T0+5 sec

16 ms binning
From T100_start-5 s to T100_start+5 s

Blue+Cyan dotted lines: Time interval of the scaled map
From 0.000000 to 64.000000
8 ms binning
From T100_start-3 s to T100_start+3 s

Blue+Cyan dotted lines: Time interval of the scaled map
From 0.000000 to 64.000000
2 ms binning
From T100_start-1 s to T100_start+1 s
Blue+Cyan dotted lines: Time interval of the scaled map
From 0.000000 to 64.000000
SN=5 or 10 sec. binning (whichever binning is satisfied first)

SN=5 or 10 sec. binning (T < 200 sec)

Quad-rate summed light curves (from T0-300s to T0+1000s)

Spectral Evolution
Spectra
Notes:
- 1) The fitting includes the systematic errors.
- 2) When the burst includes telescope slew time periods, the fitting uses an average response file made from multiple 5-s response files through out the slew time plus single time preiod for the non-slew times, and weighted by the total counts in the corresponding time period using addrmf. An average response file is needed becuase a spectral fit using the pre-slew DRM will introduce some errors in both a spectral shape and a normalization if the PHA file contains a lot of the slew/post-slew time interval.
- 3) For fits to more complicated models (e.g. a power-law over a cutoff power-law), the BAT team has decided to require a chi-square improvement of more than 6 for each extra dof.
Time averaged spectrum fit using the average DRM
Power-law model

Time interval is from  -58.932 sec. to  146.660 sec.

Spectral model in power-law:
------------------------------------------------------------
Parameters  : value       lower 90%   higher 90%
Photon index: 1.58497     ( -0.117376   0.118228 )
Norm@50keV  : 2.16811E-03    ( -0.000148846   0.000148379 )
------------------------------------------------------------
#Fit statistic : Chi-Squared =          68.61 using 59 PHA bins.
# Reduced chi-squared =          1.204 for     57 degrees of freedom
# Null hypothesis probability =   1.394631e-01

Photon flux (15-150 keV)    in 205.6 sec: 0.277339 ( -0.019338  0.019379 ) ph/cm2/s
Energy fluence (15-150 keV)             : 4.17728e-06 ( -3.05476e-07  3.07212e-07 ) ergs/cm2
Cutoff power-law model

Time interval is from  -58.932 sec. to  146.660 sec.
Spectral model in the cutoff power-law:
------------------------------------------------------------
Parameters  : value       lower 90%   higher 90%
Photon index: 1.17688     ( -0.50541   0.447019 )
Epeak [keV] : 101.576      ( -31.7799 -101.576 )
Norm@50keV  : 3.47509E-03    ( -0.00135783   0.00266961 )
------------------------------------------------------------
#Fit statistic : Chi-Squared =          66.27 using 59 PHA bins.
# Reduced chi-squared =          1.183 for     56 degrees of freedom
# Null hypothesis probability =   1.638715e-01

Photon flux (15-150 keV)    in 205.6 sec: 0.271890 ( -0.020258  0.020273 ) ph/cm2/s
Energy fluence (15-150 keV)             : 4.05922e-06 ( -3.34935e-07  3.34606e-07 ) ergs/cm2
Band function

Time interval is from  -58.932 sec. to  146.660 sec.


Spectral model in the Band function:
------------------------------------------------------------
Parameters  : value       lower 90%   higher 90%
alpha       :    (     )
beta        :     (     )
Epeak [keV] :       (   )
Norm@50keV   :     (     )
------------------------------------------------------------

Photon flux (15-150 keV)    in  sec:  (    ) ph/cm2/s
Energy fluence (15-150 keV)             : 0 ( 0  0 ) ergs/cm2
Single BB
Spectral model blackbody:
------------------------------------------------------------
Parameters  : value    Lower 90%  Upper 90%
kT [keV]    : 14.6129  (-1.23284  1.35985)
R^2/D10^2   : 3.36025E-02  (-0.00922326   0.012581)
(R is the radius in km and D10 is the distance to the source in units of 10 kpc)
------------------------------------------------------------
#Fit statistic : Chi-Squared =         113.56 using 59 PHA bins.
# Reduced chi-squared =         1.9923 for     57 degrees of freedom
# Null hypothesis probability =   1.252223e-05

Energy  Fluence     90% Error
[keV]   [erg/cm2]   [erg/cm2]
15- 25  3.101e-07   4.225e-08
25- 50  1.202e-06   1.137e-07
50-150  1.727e-06   2.297e-07
15-150  3.239e-06   2.858e-07
Thermal bremsstrahlung (OTTB)

Spectral model: thermal bremsstrahlung
------------------------------------------------------------
Parameters  : value         Lower 90%    Upper 90%
kT [keV]    : 185.007       (-53.7714      -185.18)
Norm        : 1.13052       (-0.0802712     0.0901805)
------------------------------------------------------------
#Fit statistic : Chi-Squared =          66.33 using 59 PHA bins.
# Reduced chi-squared =          1.164 for     57 degrees of freedom
# Null hypothesis probability =   1.862246e-01

Energy  Fluence     90% Error
[keV]   [erg/cm2]   [erg/cm2]
15- 25  5.843e-07   6.034e-08
25- 50  1.114e-06   2.861e-07
50-150  2.381e-06   9.985e-07
15-150  4.080e-06   1.343e-06
Double BB
Spectral model: bbodyrad<1> + bbodyrad<2>
------------------------------------------------------------
Parameters  : value         Lower 90%    Upper 90%
kT1 [keV]   : 7.14059        (-1.39325      1.60106)
R1^2/D10^2  : 0.274504        (-0.131817      0.305481)
kT2 [keV]   : 25.4337        (-4.68617      8.36972)
R2^2/D10^2  : 3.58816E-03    (-0.0022974   0.004233)
------------------------------------------------------------
#Fit statistic : Chi-Squared =          64.85 using 59 PHA bins.
# Reduced chi-squared =          1.179 for     55 degrees of freedom
# Null hypothesis probability =   1.708977e-01

Energy  Fluence     90% Error
[keV]   [erg/cm2]   [erg/cm2]
15- 25  5.538e-07   1.801e-07
25- 50  1.141e-06   2.991e-07
50-150  2.368e-06   8.039e-07
15-150  4.063e-06   1.239e-06
Peak spectrum fit
Power-law model

Time interval is from   -2.092 sec. to   -1.092 sec.

Spectral model in power-law:
------------------------------------------------------------
Parameters  : value       lower 90%   higher 90%
Photon index: 1.51796     ( -0.514569   0.516879 )
Norm@50keV  : 7.59880E-03    ( -0.00233441   0.00232394 )
------------------------------------------------------------
#Fit statistic : Chi-Squared =          54.59 using 59 PHA bins.
# Reduced chi-squared =         0.9578 for     57 degrees of freedom
# Null hypothesis probability =   5.659497e-01

Photon flux (15-150 keV)    in 1 sec: 0.953303 ( -0.302154  0.304977 ) ph/cm2/s
Energy fluence (15-150 keV)             : 7.18886e-08 ( -2.31784e-08  2.3503e-08 ) ergs/cm2
Cutoff power-law model

Time interval is from   -2.092 sec. to   -1.092 sec.
Spectral model in the cutoff power-law:
------------------------------------------------------------
Parameters  : value       lower 90%   higher 90%
Photon index: 0.914974     ( -2.3676   1.41406 )
Epeak [keV] : 95.0241      ( -94.9652 -94.9652 )
Norm@50keV  : 1.49423E-02    ( -0.00949984   0.159864 )
------------------------------------------------------------
#Fit statistic : Chi-Squared =          54.21 using 59 PHA bins.
# Reduced chi-squared =         0.9680 for     56 degrees of freedom
# Null hypothesis probability =   5.430155e-01

Photon flux (15-150 keV)    in 1 sec: 0.932796 ( -0.308037  0.310164 ) ph/cm2/s
Energy fluence (15-150 keV)             : 3.94339e-08 ( 0  0 ) ergs/cm2
Band function

Time interval is from   -2.092 sec. to   -1.092 sec.


Spectral model in the Band function:
------------------------------------------------------------
Parameters  : value       lower 90%   higher 90%
alpha       :    (     )
beta        :     (     )
Epeak [keV] :       (   )
Norm@50keV   :     (     )
------------------------------------------------------------

Photon flux (15-150 keV)    in  sec:  (    ) ph/cm2/s
Energy fluence (15-150 keV)             : 0 ( 0  0 ) ergs/cm2
Single BB

Spectral model blackbody:
------------------------------------------------------------
Parameters  : value    Lower 90%  Upper 90%
kT [keV]    : 17.3057  (-6.2619  8.75523)
R^2/D10^2   : 6.60059E-02  (-0.0653702   0.249461)
(R is the radius in km and D10 is the distance to the source in units of 10 kpc)
------------------------------------------------------------
#Fit statistic : Chi-Squared =          56.90 using 59 PHA bins.
# Reduced chi-squared =         0.9982 for     57 degrees of freedom
# Null hypothesis probability =   4.789481e-01

Energy  Fluence     90% Error
[keV]   [erg/cm2]   [erg/cm2]
15- 25  4.006e-09   2.647e-09
25- 50  1.798e-08   1.092e-08
50-150  3.865e-08   2.560e-08
15-150  6.063e-08   3.851e-08
Thermal bremsstrahlung (OTTB)
Spectral model: thermal bremsstrahlung
------------------------------------------------------------
Parameters  : value         Lower 90%    Upper 90%
kT [keV]    : 199.362       (-199.363      -199.363)
Norm        : 3.93897       (-1.19091     1.56746)
------------------------------------------------------------
#Fit statistic : Chi-Squared =          54.33 using 59 PHA bins.
# Reduced chi-squared =         0.9531 for     57 degrees of freedom
# Null hypothesis probability =   5.760244e-01

Energy  Fluence     90% Error
[keV]   [erg/cm2]   [erg/cm2]
15- 25  9.808e-09   6.120e-09
25- 50  1.887e-08   1.151e-08
50-150  4.138e-08   2.473e-08
15-150  7.006e-08   4.256e-08
Double BB

Spectral model: bbodyrad<1> + bbodyrad<2>
------------------------------------------------------------
Parameters  : value         Lower 90%    Upper 90%
kT1 [keV]   : 6.11781        (-2.85407      6.70345)
R1^2/D10^2  : 1.68062        (-1.62636      5.97256)
kT2 [keV]   : 24.9679        (-21.7405      42.3258)
R2^2/D10^2  : 1.51653E-02    (-0.0146245   0.0442699)
------------------------------------------------------------
#Fit statistic : Chi-Squared =          53.04 using 59 PHA bins.
# Reduced chi-squared =         0.9643 for     55 degrees of freedom
# Null hypothesis probability =   5.500587e-01

Energy  Fluence     90% Error
[keV]   [erg/cm2]   [erg/cm2]
15- 25  1.023e-08   6.350e-09
25- 50  1.825e-08   9.625e-09
50-150  4.396e-08   2.862e-08
15-150  7.245e-08   3.819e-08
Pre-slew spectrum (Pre-slew PHA with pre-slew DRM)
Power-law model

Spectral model in power-law:
------------------------------------------------------------
Parameters  : value       lower 90%   higher 90%
Photon index: 1.54379     ( -0.175943   0.17691 )
Norm@50keV  : 2.64276E-03    ( -0.000265735   0.000264555 )
------------------------------------------------------------
#Fit statistic : Chi-Squared =          52.93 using 59 PHA bins.
# Reduced chi-squared =         0.9286 for     57 degrees of freedom
# Null hypothesis probability =   6.285355e-01

Photon flux (15-150 keV)    in 84.6 sec: 0.333960 ( -0.034249  0.0343629 ) ph/cm2/s
Energy fluence (15-150 keV)             : 2.10667e-06 ( -2.27511e-07  2.28997e-07 ) ergs/cm2
Cutoff power-law model
Spectral model in the cutoff power-law:
------------------------------------------------------------
Parameters  : value       lower 90%   higher 90%
Photon index: 1.54799     ( -0.343527   0.174094 )
Epeak [keV] : 9999.36      ( -9999.36 -9999.36 )
Norm@50keV  : 2.64470E-03    (     )
------------------------------------------------------------
#Fit statistic : Chi-Squared =          52.93 using 59 PHA bins.
# Reduced chi-squared =         0.9452 for     56 degrees of freedom
# Null hypothesis probability =   5.917801e-01

Photon flux (15-150 keV)    in 84.6 sec: 0.334076 ( -0.034546  0.033712 ) ph/cm2/s
Energy fluence (15-150 keV)             : 2.10727e-06 ( -2.36347e-07  2.26889e-07 ) ergs/cm2
Band function
Spectral model in the Band function:
------------------------------------------------------------
Parameters  : value       lower 90%   higher 90%
alpha       :    (     )
beta        :     (     )
Epeak [keV] :       (   )
Norm@50keV   :     (     )
------------------------------------------------------------

Photon flux (15-150 keV)    in  sec:  (    ) ph/cm2/s
Energy fluence (15-150 keV)             : 0 ( 0  0 ) ergs/cm2
S(25-50 keV) vs. S(50-100 keV) plot

S(25-50 keV)  = 1.08e-06
S(50-100 keV) = 1.43e-06
T90 vs. Hardness ratio plot
T90                                   = 165.34399998188 sec.
Hardness ratio (energy fluence ratio) = 1.32407
Color vs. Color plot

Count Ratio  (25-50 keV) / (15-25 keV) = 1.40716
Count Ratio (50-100 keV) / (15-25 keV) = 1.0868
Mask shadow pattern
IMX = -8.836050525301786E-01, IMY = -2.833996645354648E-01
TIME vs. PHA plot around the trigger time
Blue+Cyan dotted lines: Time interval of the scaled map
From 0.000000 to 64.000000
TIME vs. DetID plot around the trigger time
Blue+Cyan dotted lines: Time interval of the scaled map
From 0.000000 to 64.000000
100 us light curve (15-350 keV)

Blue+Cyan dotted lines: Time interval of the scaled map
From 0.000000 to 64.000000
Spacecraft aspect plot
Bright source in the pre-burst/pre-slew/post-slew images
Pre-burst image of 15-350 keV band
Time interval of the image:
Pre-slew background subtracted image of 15-350 keV band
Time interval of the image:
-12.499400 72.100590

# RAcent  DECcent POSerr Theta    Phi  PeakCts   SNR AngSep     Name
#  [deg]    [deg]    ['] [deg]  [deg]                   [']
135.4388 -40.5190    1.4  10.8  -15.0   0.8604   8.3    4.6	Vela X-1
170.3449 -60.5058    7.0  39.4    2.2   0.2739   1.6    7.1	Cen X-3
186.3645 -62.6616   10.0  47.3    2.5  -0.2505  -1.2   10.3	GX 301-2
158.0416 -83.9548    2.4  50.8   31.7   2.8035   4.9 ------	UNKNOWN
120.3573 -73.2889    2.5  39.1   37.9   0.9352   4.7 ------	UNKNOWN
 91.0384  -4.5922    0.8  42.9  162.2   3.5351  14.2 ------	UNKNOWN
122.6084  20.6742    3.3  54.9 -146.1   2.4297   3.5 ------	UNKNOWN
Post-slew image of 15-350 keV band
Time interval of the image:
134.500600 363.110000

# RAcent  DECcent POSerr Theta    Phi  PeakCts   SNR AngSep     Name
#  [deg]    [deg]    ['] [deg]  [deg]                   [']
 83.6114  22.0233    1.2  27.6  173.6   5.3819   9.5    1.3	Crab
135.5365 -40.3759    6.8  53.6  -33.0  -3.5772  -1.7   10.7	Vela X-1
113.5346  49.1271    2.8  57.2 -154.1  10.7941   4.1 ------	UNKNOWN
Plot creation:
Fri Oct 26 16:49:31 EDT 2018