Estimated redshift from machine learning (Ukwatta et al. 2016) - may take a few minute to calcaulte
Image
Pre-slew 15.0-350.0 keV image (Event data)

# RAcent DECcent POSerr Theta Phi Peak Cts SNR Name
49.2099 -58.5224 0.0103 8.1964 145.8958 2.8680448 18.726 TRIG_00863186
Foreground time interval of the image:
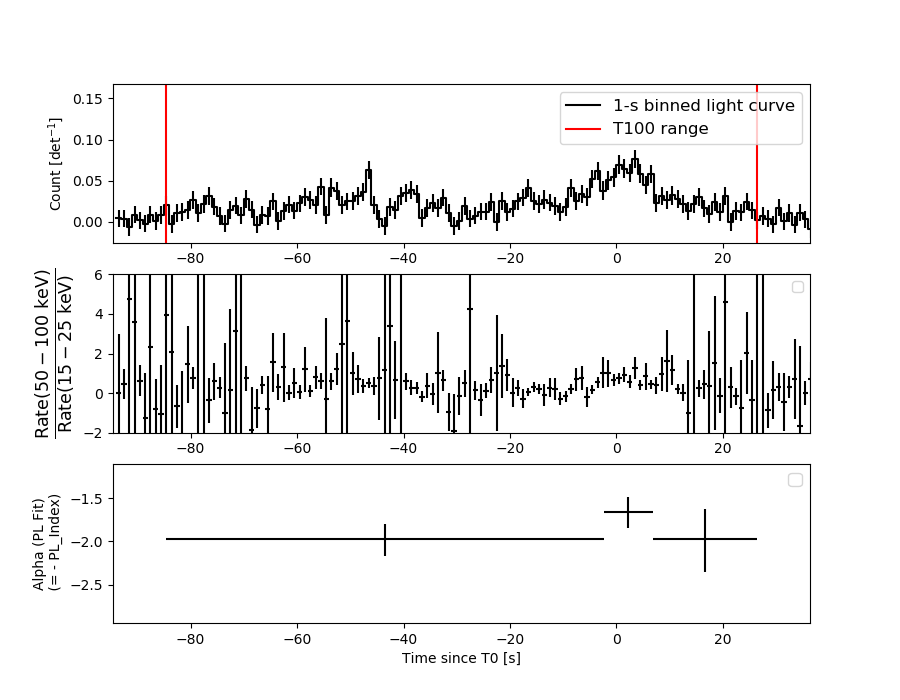
-84.668 26.348 (delta_t = 111.016 [sec])
Background time interval of the image:
-239.032 -84.668 (delta_t = 154.364 [sec])
Lightcurves
Notes:
- 1) The mask-weighted light curves are using the flight position.
- 2) Multiple plots of different time binning/intervals are shown to cover all scenarios of short/long GRBs, rate/image triggers, and real/false positives.
- 3) For all the mask-weighted lightcurves, the y-axis units are counts/sec/det where a det is 0.4 x 0.4 = 0.16 sq cm.
- 4) The verticle lines correspond to following: green dotted lines are T50 interval, black dotted lines are T90 interval, blue solid line(s) is a spacecraft slew start time, and orange solid line(s) is a spacecraft slew end time.
- 5) Time of each bin is in the middle of the bin.
1 s binning
From T0-310 s to T0+310 s

From T100_start - 20 s to T100_end + 30 s

Full time interval

64 ms binning
Full time interval

From T100_start to T100_end

From T0-5 sec to T0+5 sec

16 ms binning
From T100_start-5 s to T100_start+5 s

Blue+Cyan dotted lines: Time interval of the scaled map
From 0.000000 to 4.096000
8 ms binning
From T100_start-3 s to T100_start+3 s

Blue+Cyan dotted lines: Time interval of the scaled map
From 0.000000 to 4.096000
2 ms binning
From T100_start-1 s to T100_start+1 s

Blue+Cyan dotted lines: Time interval of the scaled map
From 0.000000 to 4.096000
SN=5 or 10 sec. binning (whichever binning is satisfied first)
SN=5 or 10 sec. binning (T < 200 sec)

Quad-rate summed light curves (from T0-300s to T0+1000s)

Spectral Evolution
Spectra
Notes:
- 1) The fitting includes the systematic errors.
- 2) When the burst includes telescope slew time periods, the fitting uses an average response file made from multiple 5-s response files through out the slew time plus single time preiod for the non-slew times, and weighted by the total counts in the corresponding time period using addrmf. An average response file is needed becuase a spectral fit using the pre-slew DRM will introduce some errors in both a spectral shape and a normalization if the PHA file contains a lot of the slew/post-slew time interval.
- 3) For fits to more complicated models (e.g. a power-law over a cutoff power-law), the BAT team has decided to require a chi-square improvement of more than 6 for each extra dof.
Time averaged spectrum fit using the average DRM
Power-law model

Time interval is from  -84.668 sec. to   26.348 sec.

Spectral model in power-law:
------------------------------------------------------------
Parameters  : value       lower 90%   higher 90%
Photon index: 1.93334     ( -0.139737   0.144361 )
Norm@50keV  : 1.33307E-03    ( -0.000119449   0.000117395 )
------------------------------------------------------------
#Fit statistic : Chi-Squared =          64.30 using 59 PHA bins.
# Reduced chi-squared =          1.128 for     57 degrees of freedom
# Null hypothesis probability =   2.361537e-01

Photon flux (15-150 keV)    in 111 sec: 0.194088 ( -0.013936  0.013942 ) ph/cm2/s
Energy fluence (15-150 keV)             : 1.36136e-06 ( -1.17152e-07  1.19156e-07 ) ergs/cm2
Cutoff power-law model

Time interval is from  -84.668 sec. to   26.348 sec.
Spectral model in the cutoff power-law:
------------------------------------------------------------
Parameters  : value       lower 90%   higher 90%
Photon index: 1.78511     ( -0.557195   0.448014 )
Epeak [keV] : 61.9635      (   )
Norm@50keV  : 1.61787E-03    (     )
------------------------------------------------------------
#Fit statistic : Chi-Squared =          64.05 using 59 PHA bins.
# Reduced chi-squared =          1.144 for     56 degrees of freedom
# Null hypothesis probability =   2.148604e-01

Photon flux (15-150 keV)    in 111 sec: 0.192641 ( -0.014743  0.014703 ) ph/cm2/s
Energy fluence (15-150 keV)             : 1.33737e-06 ( -1.40899e-07  1.13445e-07 ) ergs/cm2
Band function

Time interval is from  -84.668 sec. to   26.348 sec.


Spectral model in the Band function:
------------------------------------------------------------
Parameters  : value       lower 90%   higher 90%
alpha       :    (     )
beta        :     (     )
Epeak [keV] :       (   )
Norm@50keV   :     (     )
------------------------------------------------------------

Photon flux (15-150 keV)    in  sec:  (    ) ph/cm2/s
Energy fluence (15-150 keV)             : 0 ( 0  0 ) ergs/cm2
Single BB

Spectral model blackbody:
------------------------------------------------------------
Parameters  : value    Lower 90%  Upper 90%
kT [keV]    : 9.75669  (-0.905831  1.03565)
R^2/D10^2   : 9.58635E-02  (-0.0306495   0.0438372)
(R is the radius in km and D10 is the distance to the source in units of 10 kpc)
------------------------------------------------------------
#Fit statistic : Chi-Squared =         111.88 using 59 PHA bins.
# Reduced chi-squared =         1.9629 for     57 degrees of freedom
# Null hypothesis probability =   1.948921e-05

Energy  Fluence     90% Error
[keV]   [erg/cm2]   [erg/cm2]
15- 25  2.045e-07   2.681e-08
25- 50  4.908e-07   4.201e-08
50-150  2.384e-07   4.995e-08
15-150  9.336e-07   8.697e-08
Thermal bremsstrahlung (OTTB)

Spectral model: thermal bremsstrahlung
------------------------------------------------------------
Parameters  : value         Lower 90%    Upper 90%
kT [keV]    : 76.1744       (-17.3234      26.333)
Norm        : 0.916190       (-0.103945     0.123451)
------------------------------------------------------------
#Fit statistic : Chi-Squared =          66.04 using 59 PHA bins.
# Reduced chi-squared =          1.159 for     57 degrees of freedom
# Null hypothesis probability =   1.927934e-01

Energy  Fluence     90% Error
[keV]   [erg/cm2]   [erg/cm2]
15- 25  2.630e-07   2.747e-08
25- 50  4.277e-07   3.041e-08
50-150  5.838e-07   1.094e-07
15-150  1.275e-06   1.482e-07
Double BB

Spectral model: bbodyrad<1> + bbodyrad<2>
------------------------------------------------------------
Parameters  : value         Lower 90%    Upper 90%
kT1 [keV]   : 6.17623        (-0.94125      0.998494)
R1^2/D10^2  : 0.424619        (-0.178725      0.365237)
kT2 [keV]   : 24.1963        (-5.3207      9.12065)
R2^2/D10^2  : 2.28588E-03    (-0.00152254   0.00351503)
------------------------------------------------------------
#Fit statistic : Chi-Squared =          60.26 using 59 PHA bins.
# Reduced chi-squared =          1.096 for     55 degrees of freedom
# Null hypothesis probability =   2.912436e-01

Energy  Fluence     90% Error
[keV]   [erg/cm2]   [erg/cm2]
15- 25  2.750e-07   6.066e-08
25- 50  4.104e-07   8.863e-08
50-150  6.653e-07   3.441e-07
15-150  1.351e-06   4.293e-07
Peak spectrum fit
Power-law model

Time interval is from    2.728 sec. to    3.728 sec.

Spectral model in power-law:
------------------------------------------------------------
Parameters  : value       lower 90%   higher 90%
Photon index: 1.69736     ( -0.381933   0.412698 )
Norm@50keV  : 4.65356E-03    ( -0.00123752   0.00119157 )
------------------------------------------------------------
#Fit statistic : Chi-Squared =          41.55 using 59 PHA bins.
# Reduced chi-squared =         0.7289 for     57 degrees of freedom
# Null hypothesis probability =   9.381908e-01

Photon flux (15-150 keV)    in 1 sec: 0.617500 ( -0.139807  0.139816 ) ph/cm2/s
Energy fluence (15-150 keV)             : 4.31023e-08 ( -1.16603e-08  1.21004e-08 ) ergs/cm2
Cutoff power-law model

Time interval is from    2.728 sec. to    3.728 sec.
Spectral model in the cutoff power-law:
------------------------------------------------------------
Parameters  : value       lower 90%   higher 90%
Photon index: 1.08553     ( -1.93051   1.34799 )
Epeak [keV] : 66.4798      (   )
Norm@50keV  : 1.02365E-02    (     )
------------------------------------------------------------
#Fit statistic : Chi-Squared =          41.01 using 59 PHA bins.
# Reduced chi-squared =         0.7323 for     56 degrees of freedom
# Null hypothesis probability =   9.335717e-01

Photon flux (15-150 keV)    in 1 sec: 0.607498 ( -0.141569  0.141652 ) ph/cm2/s
Energy fluence (15-150 keV)             : 4.08131e-08 ( -1.22964e-08  1.31429e-08 ) ergs/cm2
Band function

Time interval is from    2.728 sec. to    3.728 sec.


Spectral model in the Band function:
------------------------------------------------------------
Parameters  : value       lower 90%   higher 90%
alpha       :    (     )
beta        :     (     )
Epeak [keV] :       (   )
Norm@50keV   :     (     )
------------------------------------------------------------

Photon flux (15-150 keV)    in  sec:  (    ) ph/cm2/s
Energy fluence (15-150 keV)             : 0 ( 0  0 ) ergs/cm2
Single BB
Spectral model blackbody:
------------------------------------------------------------
Parameters  : value    Lower 90%  Upper 90%
kT [keV]    : 11.9827  (-3.19164  4.41456)
R^2/D10^2   : 0.154038  (-0.103975   0.317587)
(R is the radius in km and D10 is the distance to the source in units of 10 kpc)
------------------------------------------------------------
#Fit statistic : Chi-Squared =          45.28 using 59 PHA bins.
# Reduced chi-squared =         0.7943 for     57 degrees of freedom
# Null hypothesis probability =   8.686999e-01

Energy  Fluence     90% Error
[keV]   [erg/cm2]   [erg/cm2]
15- 25  4.677e-09   2.495e-09
25- 50  1.470e-08   5.907e-09
50-150  1.267e-08   6.805e-09
15-150  3.205e-08   1.356e-08
Thermal bremsstrahlung (OTTB)
Spectral model: thermal bremsstrahlung
------------------------------------------------------------
Parameters  : value         Lower 90%    Upper 90%
kT [keV]    : 127.969       (-72.3567      -124.725)
Norm        : 2.59883       (-0.645495     0.977094)
------------------------------------------------------------
#Fit statistic : Chi-Squared =          41.07 using 59 PHA bins.
# Reduced chi-squared =         0.7206 for     57 degrees of freedom
# Null hypothesis probability =   9.446243e-01

Energy  Fluence     90% Error
[keV]   [erg/cm2]   [erg/cm2]
15- 25  6.749e-09   4.031e-09
25- 50  1.221e-08   7.100e-09
50-150  2.246e-08   1.509e-08
15-150  4.142e-08   2.593e-08
Double BB
Spectral model: bbodyrad<1> + bbodyrad<2>
------------------------------------------------------------
Parameters  : value         Lower 90%    Upper 90%
kT1 [keV]   : 5.47154        (-2.89521      5.16072)
R1^2/D10^2  : 1.64279        (-1.45627      38.5123)
kT2 [keV]   : 19.7176        (-7.63172      60.0932)
R2^2/D10^2  : 1.98797E-02    (-0.0196611   0.114113)
------------------------------------------------------------
#Fit statistic : Chi-Squared =          40.53 using 59 PHA bins.
# Reduced chi-squared =         0.7369 for     55 degrees of freedom
# Null hypothesis probability =   9.276238e-01

Energy  Fluence     90% Error
[keV]   [erg/cm2]   [erg/cm2]
15- 25  7.152e-09   4.007e-09
25- 50  1.197e-08   5.950e-09
50-150  2.154e-08   1.314e-08
15-150  4.067e-08   2.145e-08
Pre-slew spectrum (Pre-slew PHA with pre-slew DRM)
Power-law model
Spectral model in power-law:
------------------------------------------------------------
Parameters  : value       lower 90%   higher 90%
Photon index: 1.93334     ( -0.139737   0.144361 )
Norm@50keV  : 1.33307E-03    ( -0.000119449   0.000117395 )
------------------------------------------------------------
#Fit statistic : Chi-Squared =          64.30 using 59 PHA bins.
# Reduced chi-squared =          1.128 for     57 degrees of freedom
# Null hypothesis probability =   2.361537e-01

Photon flux (15-150 keV)    in 111 sec: 0.194075 ( -0.0139346  0.0139409 ) ph/cm2/s
Energy fluence (15-150 keV)             : 1.36112e-06 ( -1.17238e-07  1.19154e-07 ) ergs/cm2
Cutoff power-law model
Spectral model in the cutoff power-law:
------------------------------------------------------------
Parameters  : value       lower 90%   higher 90%
Photon index: 1.78511     ( -0.557195   0.448122 )
Epeak [keV] : 61.9634      (   )
Norm@50keV  : 1.61787E-03    (     )
------------------------------------------------------------
#Fit statistic : Chi-Squared =          64.05 using 59 PHA bins.
# Reduced chi-squared =          1.144 for     56 degrees of freedom
# Null hypothesis probability =   2.148604e-01

Photon flux (15-150 keV)    in 111 sec: 0.192598 ( -0.014738  0.014717 ) ph/cm2/s
Energy fluence (15-150 keV)             : 1.33774e-06 ( -1.41125e-07  1.37129e-07 ) ergs/cm2
Band function

Spectral model in the Band function:
------------------------------------------------------------
Parameters  : value       lower 90%   higher 90%
alpha       :    (     )
beta        :     (     )
Epeak [keV] :       (   )
Norm@50keV   :     (     )
------------------------------------------------------------

Photon flux (15-150 keV)    in  sec:  (    ) ph/cm2/s
Energy fluence (15-150 keV)             : 0 ( 0  0 ) ergs/cm2
S(25-50 keV) vs. S(50-100 keV) plot

S(25-50 keV)  = 4.02e-07
S(50-100 keV) = 4.21e-07
T90 vs. Hardness ratio plot
T90                                   = 94.8159999847412 sec.
Hardness ratio (energy fluence ratio) = 1.04726
Color vs. Color plot

Count Ratio  (25-50 keV) / (15-25 keV) = 1.01257
Count Ratio (50-100 keV) / (15-25 keV) = 0.583175
Mask shadow pattern
IMX = -1.192668647637723E-01, IMY = -8.076260146427267E-02
TIME vs. PHA plot around the trigger time

Blue+Cyan dotted lines: Time interval of the scaled map
From 0.000000 to 4.096000
TIME vs. DetID plot around the trigger time

Blue+Cyan dotted lines: Time interval of the scaled map
From 0.000000 to 4.096000
100 us light curve (15-350 keV)

Blue+Cyan dotted lines: Time interval of the scaled map
From 0.000000 to 4.096000
Spacecraft aspect plot

Bright source in the pre-burst/pre-slew/post-slew images
Pre-burst image of 15-350 keV band
Time interval of the image:
-239.032000 -84.668000

# RAcent  DECcent POSerr Theta    Phi  PeakCts   SNR AngSep     Name
#  [deg]    [deg]    ['] [deg]  [deg]                   [']
301.3202 -58.7217    2.5  43.2    4.9   1.3705   4.6 ------	UNKNOWN
261.5779 -68.7336    2.9  42.5  -24.3   1.1116   3.9 ------	UNKNOWN
Pre-slew background subtracted image of 15-350 keV band
Time interval of the image:
-84.668000 26.348000

# RAcent  DECcent POSerr Theta    Phi  PeakCts   SNR AngSep     Name
#  [deg]    [deg]    ['] [deg]  [deg]                   [']
 49.2098 -58.5224    0.6   8.2  145.9   2.8681  18.7 ------	UNKNOWN
 73.6148 -35.5053    2.1  34.7  177.7   1.1074   5.5 ------	UNKNOWN
105.6027 -32.1532    2.5  48.4 -147.1   1.9031   4.6 ------	UNKNOWN
Post-slew image of 15-350 keV band
Time interval of the image:
63.268610 635.768610

# RAcent  DECcent POSerr Theta    Phi  PeakCts   SNR AngSep     Name
#  [deg]    [deg]    ['] [deg]  [deg]                   [']
 59.6292 -24.6671    2.1  34.7  159.0   3.6551   5.4 ------	UNKNOWN
 80.8303 -27.0944    2.5  38.4 -169.0   2.6336   4.7 ------	UNKNOWN
338.0697 -80.6568    2.9  29.7  -19.8   1.8319   4.0 ------	UNKNOWN
 59.0261 -79.4971    2.5  21.2  -42.8   1.9854   4.7 ------	UNKNOWN
 99.1102 -46.1195    3.8  32.0 -128.3   1.5994   3.0 ------	UNKNOWN
 97.8221 -16.5671    2.4  55.0 -156.4   8.2549   4.9 ------	UNKNOWN
109.5973 -56.5174    3.3  31.4 -104.9   2.3120   3.6 ------	UNKNOWN
113.1635 -34.2186    2.5  48.0 -129.1   8.6647   4.6 ------	UNKNOWN
Plot creation:
Fri Oct 26 12:23:41 EDT 2018