Estimated redshift from machine learning (Ukwatta et al. 2016) - may take a few minute to calcaulte
Image
Pre-slew 15.0-350.0 keV image (Event data)
#   RAcent    DECcent   POSerr    Theta     Phi              Peak Cts       SNR   Name
  315.2138   -64.4503   0.0111    49.0892  -146.9342         4.3509338     17.270 TRIG_00863421

Foreground time interval of the image:
 -4.440  31.701 (delta_t =  36.141 [sec])
Background time interval of the image:
-239.600  -4.440 (delta_t = 235.160 [sec])
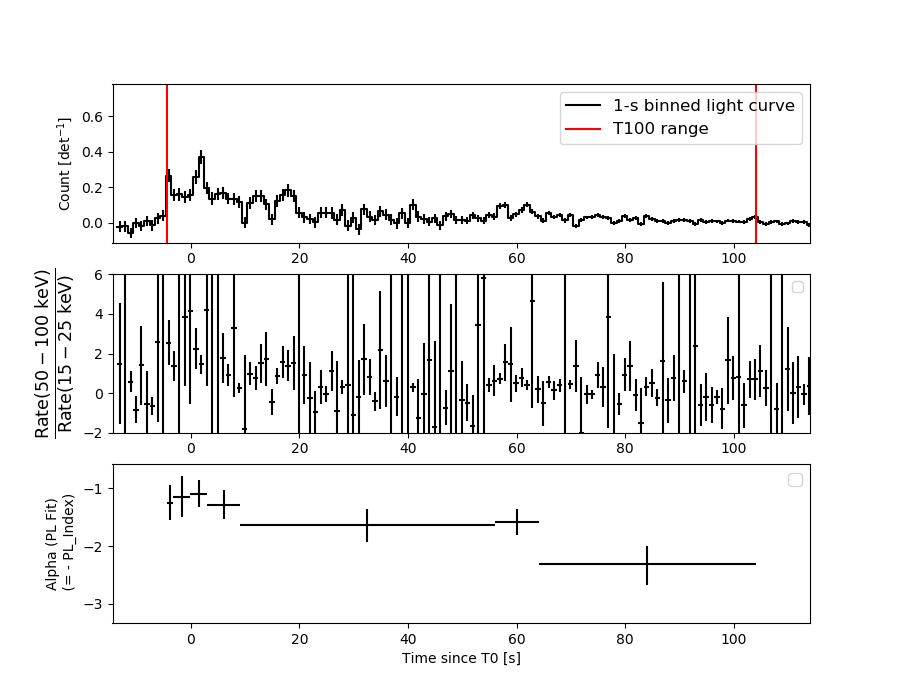
Lightcurves
Notes:
- 1) The mask-weighted light curves are using the flight position.
- 2) Multiple plots of different time binning/intervals are shown to cover all scenarios of short/long GRBs, rate/image triggers, and real/false positives.
- 3) For all the mask-weighted lightcurves, the y-axis units are counts/sec/det where a det is 0.4 x 0.4 = 0.16 sq cm.
- 4) The verticle lines correspond to following: green dotted lines are T50 interval, black dotted lines are T90 interval, blue solid line(s) is a spacecraft slew start time, and orange solid line(s) is a spacecraft slew end time.
- 5) Time of each bin is in the middle of the bin.
1 s binning
From T0-310 s to T0+310 s

From T100_start - 20 s to T100_end + 30 s

Full time interval

64 ms binning
Full time interval

From T100_start to T100_end

From T0-5 sec to T0+5 sec

16 ms binning
From T100_start-5 s to T100_start+5 s

8 ms binning
From T100_start-3 s to T100_start+3 s

2 ms binning
From T100_start-1 s to T100_start+1 s
SN=5 or 10 sec. binning (whichever binning is satisfied first)

SN=5 or 10 sec. binning (T < 200 sec)

Quad-rate summed light curves (from T0-300s to T0+1000s)

Spectral Evolution
Spectra
Notes:
- 1) The fitting includes the systematic errors.
- 2) When the burst includes telescope slew time periods, the fitting uses an average response file made from multiple 5-s response files through out the slew time plus single time preiod for the non-slew times, and weighted by the total counts in the corresponding time period using addrmf. An average response file is needed becuase a spectral fit using the pre-slew DRM will introduce some errors in both a spectral shape and a normalization if the PHA file contains a lot of the slew/post-slew time interval.
- 3) For fits to more complicated models (e.g. a power-law over a cutoff power-law), the BAT team has decided to require a chi-square improvement of more than 6 for each extra dof.
Time averaged spectrum fit using the average DRM
Power-law model

Time interval is from   -4.440 sec. to  104.028 sec.

Spectral model in power-law:
------------------------------------------------------------
Parameters  : value       lower 90%   higher 90%
Photon index: 1.47772     ( -0.128392   0.128459 )
Norm@50keV  : 3.89021E-03    ( -0.000274797   0.000274502 )
------------------------------------------------------------
#Fit statistic : Chi-Squared =          59.52 using 59 PHA bins.
# Reduced chi-squared =          1.044 for     57 degrees of freedom
# Null hypothesis probability =   3.839234e-01

Photon flux (15-150 keV)    in 108.5 sec: 0.482810 ( -0.036352  0.036518 ) ph/cm2/s
Energy fluence (15-150 keV)             : 4.01966e-06 ( -3.03545e-07  3.04873e-07 ) ergs/cm2
Cutoff power-law model

Time interval is from   -4.440 sec. to  104.028 sec.
Spectral model in the cutoff power-law:
------------------------------------------------------------
Parameters  : value       lower 90%   higher 90%
Photon index: 1.47496     ( -0.341859   0.159966 )
Epeak [keV] : 1.00000E+04      ( -10000 -10000 )
Norm@50keV  : 3.90240E-03    ( -0.000275644   0.000274438 )
------------------------------------------------------------
#Fit statistic : Chi-Squared =          59.53 using 59 PHA bins.
# Reduced chi-squared =          1.063 for     56 degrees of freedom
# Null hypothesis probability =   3.482934e-01

Photon flux (15-150 keV)    in 108.5 sec: 0.484331 ( -0.042399  0.039166 ) ph/cm2/s
Energy fluence (15-150 keV)             : 4.02995e-06 ( -3.51035e-07  2.45675e-07 ) ergs/cm2
Band function

Time interval is from   -4.440 sec. to  104.028 sec.


Spectral model in the Band function:
------------------------------------------------------------
Parameters  : value       lower 90%   higher 90%
alpha       :    (     )
beta        :     (     )
Epeak [keV] :       (   )
Norm@50keV   :     (     )
------------------------------------------------------------

Photon flux (15-150 keV)    in  sec:  (    ) ph/cm2/s
Energy fluence (15-150 keV)             : 0 ( 0  0 ) ergs/cm2
Single BB

Spectral model blackbody:
------------------------------------------------------------
Parameters  : value    Lower 90%  Upper 90%
kT [keV]    : 16.5609  (  )
R^2/D10^2   : 3.79448E-02  (   )
(R is the radius in km and D10 is the distance to the source in units of 10 kpc)
------------------------------------------------------------
#Fit statistic : Chi-Squared =         119.56 using 59 PHA bins.
# Reduced chi-squared =         2.0976 for     57 degrees of freedom
# Null hypothesis probability =   2.462245e-06

Energy  Fluence     90% Error
[keV]   [erg/cm2]   [erg/cm2]
15- 25  2.316e-07   3.461e-08
25- 50  1.003e-06   9.949e-08
50-150  1.947e-06   2.262e-07
15-150  3.182e-06   2.734e-07
Thermal bremsstrahlung (OTTB)

Spectral model: thermal bremsstrahlung
------------------------------------------------------------
Parameters  : value         Lower 90%    Upper 90%
kT [keV]    : 200.000       (-32.935      -200)
Norm        : 1.98806       (-0.140316     0.140316)
------------------------------------------------------------
#Fit statistic : Chi-Squared =          63.42 using 59 PHA bins.
# Reduced chi-squared =          1.113 for     57 degrees of freedom
# Null hypothesis probability =   2.604402e-01

Energy  Fluence     90% Error
[keV]   [erg/cm2]   [erg/cm2]
15- 25  5.372e-07   4.877e-08
25- 50  1.033e-06   1.016e-07
50-150  2.266e-06   5.485e-07
15-150  3.837e-06   7.188e-07
Double BB

Spectral model: bbodyrad<1> + bbodyrad<2>
------------------------------------------------------------
Parameters  : value         Lower 90%    Upper 90%
kT1 [keV]   : 7.65418        (-2.00721      2.18029)
R1^2/D10^2  : 0.384755        (-0.210226      0.451667)
kT2 [keV]   : 32.8261        (-8.37289      20.8817)
R2^2/D10^2  : 2.96882E-03    (-0.00223751   0.00525898)
------------------------------------------------------------
#Fit statistic : Chi-Squared =          64.41 using 59 PHA bins.
# Reduced chi-squared =          1.171 for     55 degrees of freedom
# Null hypothesis probability =   1.804748e-01

Energy  Fluence     90% Error
[keV]   [erg/cm2]   [erg/cm2]
15- 25  4.784e-07   1.404e-07
25- 50  1.019e-06   2.499e-07
50-150  2.552e-06   9.692e-07
15-150  4.049e-06   1.351e-06
Peak spectrum fit
Power-law model

Time interval is from    0.868 sec. to    1.868 sec.

Spectral model in power-law:
------------------------------------------------------------
Parameters  : value       lower 90%   higher 90%
Photon index: 1.29041     ( -0.315024   0.311885 )
Norm@50keV  : 2.57761E-02    ( -0.00463479   0.00462483 )
------------------------------------------------------------
#Fit statistic : Chi-Squared =          61.34 using 59 PHA bins.
# Reduced chi-squared =          1.076 for     57 degrees of freedom
# Null hypothesis probability =   3.232498e-01

Photon flux (15-150 keV)    in 1 sec: 3.06982 ( -0.5831  0.58648 ) ph/cm2/s
Energy fluence (15-150 keV)             : 2.55347e-07 ( -4.87091e-08  4.88886e-08 ) ergs/cm2
Cutoff power-law model

Time interval is from    0.868 sec. to    1.868 sec.
Spectral model in the cutoff power-law:
------------------------------------------------------------
Parameters  : value       lower 90%   higher 90%
Photon index: 2.21171     ( -2.19808   2.54175 )
Epeak [keV] : 75.7184      (   )
Norm@50keV  : 5.20177E-03    (     )
------------------------------------------------------------
#Fit statistic : Chi-Squared =          59.53 using 59 PHA bins.
# Reduced chi-squared =          1.063 for     56 degrees of freedom
# Null hypothesis probability =   3.483754e-01

Photon flux (15-150 keV)    in 1 sec: 3.02912 ( -0.61311  0.58964 ) ph/cm2/s
Energy fluence (15-150 keV)             : 2.5321e-07 ( -5.04557e-08  4.97603e-08 ) ergs/cm2
Band function

Time interval is from    0.868 sec. to    1.868 sec.


Spectral model in the Band function:
------------------------------------------------------------
Parameters  : value       lower 90%   higher 90%
alpha       :    (     )
beta        :     (     )
Epeak [keV] :       (   )
Norm@50keV   :     (     )
------------------------------------------------------------

Photon flux (15-150 keV)    in  sec:  (    ) ph/cm2/s
Energy fluence (15-150 keV)             : 0 ( 0  0 ) ergs/cm2
Single BB

Spectral model blackbody:
------------------------------------------------------------
Parameters  : value    Lower 90%  Upper 90%
kT [keV]    : 19.0215  (-3.62326  5.07182)
R^2/D10^2   : 0.166711  (-0.0924444   0.17718)
(R is the radius in km and D10 is the distance to the source in units of 10 kpc)
------------------------------------------------------------
#Fit statistic : Chi-Squared =          65.83 using 59 PHA bins.
# Reduced chi-squared =          1.155 for     57 degrees of freedom
# Null hypothesis probability =   1.978601e-01

Energy  Fluence     90% Error
[keV]   [erg/cm2]   [erg/cm2]
15- 25  1.185e-08   4.606e-09
25- 50  5.705e-08   1.848e-08
50-150  1.517e-07   5.154e-08
15-150  2.206e-07   6.580e-08
Thermal bremsstrahlung (OTTB)

Spectral model: thermal bremsstrahlung
------------------------------------------------------------
Parameters  : value         Lower 90%    Upper 90%
kT [keV]    : 200.000       (-66.4816      -200)
Norm        : 12.9311       (-2.35121     2.35121)
------------------------------------------------------------
#Fit statistic : Chi-Squared =          63.67 using 59 PHA bins.
# Reduced chi-squared =          1.117 for     57 degrees of freedom
# Null hypothesis probability =   2.535224e-01

Energy  Fluence     90% Error
[keV]   [erg/cm2]   [erg/cm2]
15- 25  3.220e-08   1.946e-08
25- 50  6.195e-08   3.588e-08
50-150  1.359e-07   7.785e-08
15-150  2.300e-07   1.341e-07
Double BB

Spectral model: bbodyrad<1> + bbodyrad<2>
------------------------------------------------------------
Parameters  : value         Lower 90%    Upper 90%
kT1 [keV]   : 2.21224        (-1.5777      2.21291)
R1^2/D10^2  : 881.740        (-868.876      -881.74)
kT2 [keV]   : 21.1896        (-4.40903      6.85102)
R2^2/D10^2  : 0.110735    (-0.0677433   0.0902838)
------------------------------------------------------------
#Fit statistic : Chi-Squared =          58.38 using 59 PHA bins.
# Reduced chi-squared =          1.061 for     55 degrees of freedom
# Null hypothesis probability =   3.523084e-01

Energy  Fluence     90% Error
[keV]   [erg/cm2]   [erg/cm2]
15- 25  2.831e-08   1.329e-08
25- 50  4.919e-08   2.188e-08
50-150  1.620e-07   6.560e-08
15-150  2.395e-07   7.470e-08
Pre-slew spectrum (Pre-slew PHA with pre-slew DRM)
Power-law model

Spectral model in power-law:
------------------------------------------------------------
Parameters  : value       lower 90%   higher 90%
Photon index: 1.31013     ( -0.143502   0.141973 )
Norm@50keV  : 8.25168E-03    ( -0.000667394   0.000665991 )
------------------------------------------------------------
#Fit statistic : Chi-Squared =          73.02 using 59 PHA bins.
# Reduced chi-squared =          1.281 for     57 degrees of freedom
# Null hypothesis probability =   7.489679e-02

Photon flux (15-150 keV)    in 36.14 sec: 0.986306 ( -0.086471  0.0869033 ) ph/cm2/s
Energy fluence (15-150 keV)             : 2.93967e-06 ( -2.46832e-07  2.47532e-07 ) ergs/cm2
Cutoff power-law model

Spectral model in the cutoff power-law:
------------------------------------------------------------
Parameters  : value       lower 90%   higher 90%
Photon index: 1.12935     ( -0.607074   0.305439 )
Epeak [keV] : 280.956      ( -280.825 -280.825 )
Norm@50keV  : 9.91274E-03    ( -0.00223927   0.00801277 )
------------------------------------------------------------
#Fit statistic : Chi-Squared =          72.71 using 59 PHA bins.
# Reduced chi-squared =          1.298 for     56 degrees of freedom
# Null hypothesis probability =   6.602170e-02

Photon flux (15-150 keV)    in 36.14 sec: 0.976718 ( -0.091013  0.091152 ) ph/cm2/s
Energy fluence (15-150 keV)             : 2.92282e-06 ( -2.55289e-07  2.53855e-07 ) ergs/cm2
Band function

Spectral model in the Band function:
------------------------------------------------------------
Parameters  : value       lower 90%   higher 90%
alpha       :    (     )
beta        :     (     )
Epeak [keV] :       (   )
Norm@50keV   :     (     )
------------------------------------------------------------

Photon flux (15-150 keV)    in  sec:  (    ) ph/cm2/s
Energy fluence (15-150 keV)             : 0 ( 0  0 ) ergs/cm2
S(25-50 keV) vs. S(50-100 keV) plot

S(25-50 keV)  = 9.83e-07
S(50-100 keV) = 1.41e-06
T90 vs. Hardness ratio plot

T90                                   = 82.6319999694824 sec.
Hardness ratio (energy fluence ratio) = 1.43438
Color vs. Color plot

Count Ratio  (25-50 keV) / (15-25 keV) = 1.28818
Count Ratio (50-100 keV) / (15-25 keV) = 1.09766
Mask shadow pattern

IMX = -9.670959701961642E-01, IMY = 6.296188426576044E-01
TIME vs. PHA plot around the trigger time

TIME vs. DetID plot around the trigger time

100 us light curve (15-350 keV)

Spacecraft aspect plot

Bright source in the pre-burst/pre-slew/post-slew images
Pre-burst image of 15-350 keV band
Time interval of the image:
-239.600000 -4.440000

# RAcent  DECcent POSerr Theta    Phi  PeakCts   SNR AngSep     Name
#  [deg]    [deg]    ['] [deg]  [deg]                   [']
285.0959 -24.8955    4.2  36.0  -82.0   1.3373   2.7    3.6	HT1900.1-2455
288.8139  10.9856    2.1  42.5  -24.2   2.0172   5.6    2.6	GRS 1915+105
299.6059  35.2398    2.1  55.2    6.5   5.5960   5.6    2.4	Cyg X-1
329.7447  27.3098    2.7  43.5   38.7   2.5387   4.3 ------	UNKNOWN
333.7459   2.7916    2.8  21.6   61.7   1.0320   4.2 ------	UNKNOWN
Pre-slew background subtracted image of 15-350 keV band
Time interval of the image:
-4.440000 31.700600

# RAcent  DECcent POSerr Theta    Phi  PeakCts   SNR AngSep     Name
#  [deg]    [deg]    ['] [deg]  [deg]                   [']
284.8457 -24.8473    0.0  36.2  -81.9   0.2853   1.7   11.3	HT1900.1-2455
288.7198  10.8496   10.5  42.5  -24.5  -0.1350  -1.1    7.4	GRS 1915+105
299.6316  35.2732    4.5  55.2    6.6  -0.7583  -2.6    4.7	Cyg X-1
347.2364 -38.2504    2.0  31.6  169.7   0.5568   5.8 ------	UNKNOWN
315.2138 -64.4503    0.7  49.1 -146.9   4.3501  17.3 ------	UNKNOWN
274.1143   7.8584    2.1  53.1  -38.2   2.2660   5.6 ------	UNKNOWN
Post-slew image of 15-350 keV band
Time interval of the image:
97.700600 962.534600

# RAcent  DECcent POSerr Theta    Phi  PeakCts   SNR AngSep     Name
#  [deg]    [deg]    ['] [deg]  [deg]                   [']
256.0237 -37.8989    2.1  43.2  -41.1   6.2363   5.4    3.7	4U 1700-377
256.5006 -36.5562    4.7  44.2  -39.6   3.0030   2.5    8.6	GX 349+2
262.8667 -24.8466   10.1  51.8  -25.5  -1.8635  -1.1    9.8	GX 1+4
264.5793 -44.3669    3.1  34.3  -38.5   3.0257   3.8    8.6	4U 1735-44
270.2303 -25.1889    6.2  48.7  -17.8   2.5273   1.9    7.2	GX 5-1
270.3097 -25.7211    3.1  48.2  -18.1   4.9982   3.7    1.4	GRS 1758-258
274.0081 -13.8946   12.9  57.9   -8.5  -3.3970  -1.0    8.5	GX 17+2
275.8829 -30.3749    5.7  41.9  -14.4   1.8812   2.0    2.2	H1820-303
284.9159 -24.9332   41.8  44.1   -0.6   0.3129   0.3    6.6	HT1900.1-2455
262.8207 -33.9496    7.0  43.8  -31.3   1.7221   1.7   10.9	GX 354-0
357.0779 -39.1023    3.2  35.1  104.9   5.5167   3.7 ------	UNKNOWN
 45.0738 -41.7942    2.2  53.0  151.5  18.3633   5.3 ------	UNKNOWN
 40.2615 -47.7686    3.4  46.1  152.3   5.6618   3.4 ------	UNKNOWN
 41.1528 -47.8875    2.6  46.4  153.1   7.5408   4.5 ------	UNKNOWN
302.6492 -21.3112    3.4  43.9   23.6   4.2601   3.4 ------	UNKNOWN
 32.7048 -59.1272    3.1  34.7  158.9   3.9027   3.8 ------	UNKNOWN
293.4441 -28.4854    2.6  38.5    9.0   4.0592   4.5 ------	UNKNOWN
278.3059 -11.7785    3.6  58.5   -3.0  12.5734   3.2 ------	UNKNOWN
 84.6940 -51.9657    3.6  57.2 -173.9  12.4084   3.2 ------	UNKNOWN
271.9919 -37.6821    2.6  36.8  -24.1   3.7305   4.3 ------	UNKNOWN
248.3362 -67.3861    2.4  26.1  -86.0   3.5455   4.8 ------	UNKNOWN
Plot creation:
Fri Oct 26 12:22:20 EDT 2018