Estimated redshift from machine learning (Ukwatta et al. 2016) - may take a few minute to calcaulte
Image
Pre-slew 15.0-350.0 keV image (Event data)

#   RAcent    DECcent   POSerr    Theta     Phi              Peak Cts       SNR   Name
   76.8940   -25.1244   0.0201    26.8144  -167.5695         0.3763572      9.541 TRIG_00864584

Foreground time interval of the image:
 -3.244   4.204 (delta_t =   7.448 [sec])
Background time interval of the image:
-105.243  -3.244 (delta_t = 101.999 [sec])
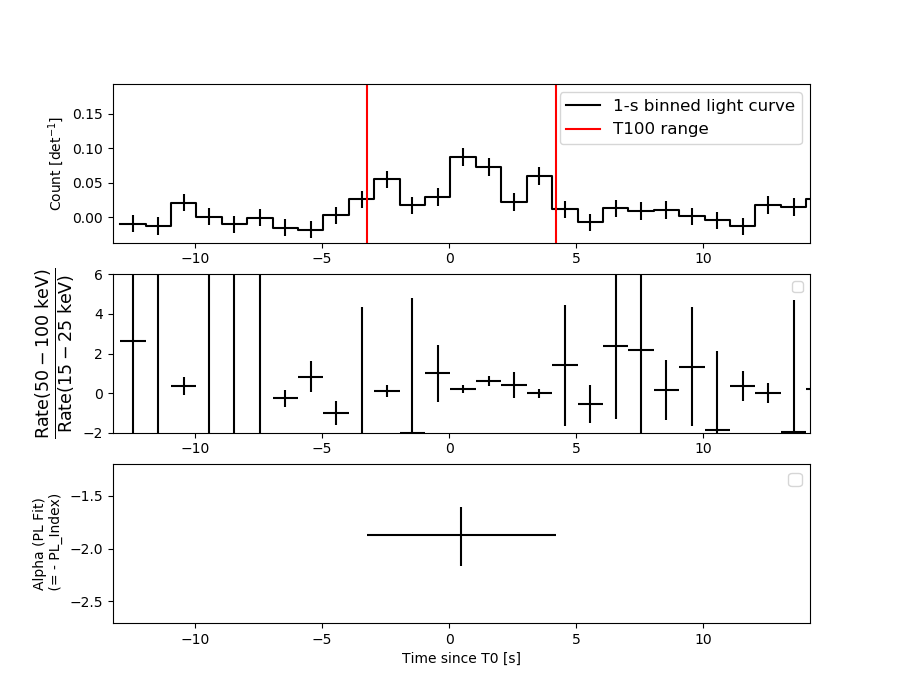
Lightcurves
Notes:
- 1) The mask-weighted light curves are using the flight position.
- 2) Multiple plots of different time binning/intervals are shown to cover all scenarios of short/long GRBs, rate/image triggers, and real/false positives.
- 3) For all the mask-weighted lightcurves, the y-axis units are counts/sec/det where a det is 0.4 x 0.4 = 0.16 sq cm.
- 4) The verticle lines correspond to following: green dotted lines are T50 interval, black dotted lines are T90 interval, blue solid line(s) is a spacecraft slew start time, and orange solid line(s) is a spacecraft slew end time.
- 5) Time of each bin is in the middle of the bin.
1 s binning
From T0-310 s to T0+310 s

From T100_start - 20 s to T100_end + 30 s
Full time interval
64 ms binning
Full time interval

From T100_start to T100_end

From T0-5 sec to T0+5 sec

16 ms binning
From T100_start-5 s to T100_start+5 s
Blue+Cyan dotted lines: Time interval of the scaled map
From 0.000000 to 1.024000
8 ms binning
From T100_start-3 s to T100_start+3 s
Blue+Cyan dotted lines: Time interval of the scaled map
From 0.000000 to 1.024000
2 ms binning
From T100_start-1 s to T100_start+1 s

Blue+Cyan dotted lines: Time interval of the scaled map
From 0.000000 to 1.024000
SN=5 or 10 sec. binning (whichever binning is satisfied first)

SN=5 or 10 sec. binning (T < 200 sec)

Quad-rate summed light curves (from T0-300s to T0+1000s)

Spectral Evolution
Spectra
Notes:
- 1) The fitting includes the systematic errors.
- 2) When the burst includes telescope slew time periods, the fitting uses an average response file made from multiple 5-s response files through out the slew time plus single time preiod for the non-slew times, and weighted by the total counts in the corresponding time period using addrmf. An average response file is needed becuase a spectral fit using the pre-slew DRM will introduce some errors in both a spectral shape and a normalization if the PHA file contains a lot of the slew/post-slew time interval.
- 3) For fits to more complicated models (e.g. a power-law over a cutoff power-law), the BAT team has decided to require a chi-square improvement of more than 6 for each extra dof.
Time averaged spectrum fit using the average DRM
Power-law model

Time interval is from   -3.244 sec. to    4.204 sec.

Spectral model in power-law:
------------------------------------------------------------
Parameters  : value       lower 90%   higher 90%
Photon index: 1.87319     ( -0.270707   0.289999 )
Norm@50keV  : 2.95798E-03    ( -0.000560058   0.000541102 )
------------------------------------------------------------
#Fit statistic : Chi-Squared =          53.95 using 59 PHA bins.
# Reduced chi-squared =         0.9464 for     57 degrees of freedom
# Null hypothesis probability =   5.903835e-01

Photon flux (15-150 keV)    in 7.448 sec: 0.419776 ( -0.062349  0.062352 ) ph/cm2/s
Energy fluence (15-150 keV)             : 2.02563e-07 ( -3.71e-08  3.8267e-08 ) ergs/cm2
Cutoff power-law model

Time interval is from   -3.244 sec. to    4.204 sec.
Spectral model in the cutoff power-law:
------------------------------------------------------------
Parameters  : value       lower 90%   higher 90%
Photon index: 1.73113     ( -1.53323   0.553564 )
Epeak [keV] : 77.7763      ( -78.0184 -78.0379 )
Norm@50keV  : 3.58886E-03    (     )
------------------------------------------------------------
#Fit statistic : Chi-Squared =          53.90 using 59 PHA bins.
# Reduced chi-squared =         0.9625 for     56 degrees of freedom
# Null hypothesis probability =   5.547012e-01

Photon flux (15-150 keV)    in 7.448 sec: 0.417716 ( -0.064827  0.063516 ) ph/cm2/s
Energy fluence (15-150 keV)             : 1.98916e-07 ( -4.73437e-08  4.07187e-08 ) ergs/cm2
Band function

Time interval is from   -3.244 sec. to    4.204 sec.


Spectral model in the Band function:
------------------------------------------------------------
Parameters  : value       lower 90%   higher 90%
alpha       :    (     )
beta        :     (     )
Epeak [keV] :       (   )
Norm@50keV   :     (     )
------------------------------------------------------------

Photon flux (15-150 keV)    in  sec:  (    ) ph/cm2/s
Energy fluence (15-150 keV)             : 0 ( 0  0 ) ergs/cm2
Single BB
Spectral model blackbody:
------------------------------------------------------------
Parameters  : value    Lower 90%  Upper 90%
kT [keV]    : 9.58557  (-1.49895  1.84499)
R^2/D10^2   : 0.232396  (-0.113678   0.211236)
(R is the radius in km and D10 is the distance to the source in units of 10 kpc)
------------------------------------------------------------
#Fit statistic : Chi-Squared =          61.42 using 59 PHA bins.
# Reduced chi-squared =          1.078 for     57 degrees of freedom
# Null hypothesis probability =   3.206040e-01

Energy  Fluence     90% Error
[keV]   [erg/cm2]   [erg/cm2]
15- 25  3.188e-08   9.295e-09
25- 50  7.457e-08   1.703e-08
50-150  3.438e-08   1.383e-08
15-150  1.408e-07   3.143e-08
Thermal bremsstrahlung (OTTB)
Spectral model: thermal bremsstrahlung
------------------------------------------------------------
Parameters  : value         Lower 90%    Upper 90%
kT [keV]    : 79.6435       (-32.3093      81.8346)
Norm        : 1.97721       (-0.408714     0.546873)
------------------------------------------------------------
#Fit statistic : Chi-Squared =          54.18 using 59 PHA bins.
# Reduced chi-squared =         0.9505 for     57 degrees of freedom
# Null hypothesis probability =   5.816558e-01

Energy  Fluence     90% Error
[keV]   [erg/cm2]   [erg/cm2]
15- 25  3.820e-08   8.517e-09
25- 50  6.282e-08   1.251e-08
50-150  8.841e-08   5.468e-08
15-150  1.894e-07   5.917e-08
Double BB
Spectral model: bbodyrad<1> + bbodyrad<2>
------------------------------------------------------------
Parameters  : value         Lower 90%    Upper 90%
kT1 [keV]   : 8.06128        (-2.10079      1.82694)
R1^2/D10^2  : 0.402086        (-0.212731      0.714503)
kT2 [keV]   : 67.9026        (-58.625      -69.2487)
R2^2/D10^2  : 2.27825E-04    (-0.000219576   0.00442761)
------------------------------------------------------------
#Fit statistic : Chi-Squared =          52.07 using 59 PHA bins.
# Reduced chi-squared =         0.9468 for     55 degrees of freedom
# Null hypothesis probability =   5.871364e-01

Energy  Fluence     90% Error
[keV]   [erg/cm2]   [erg/cm2]
15- 25  3.606e-08   1.197e-08
25- 50  6.787e-08   2.713e-08
50-150  9.740e-08   5.494e-08
15-150  2.013e-07   8.055e-08
Peak spectrum fit
Power-law model
Time interval is from    0.140 sec. to    1.140 sec.

Spectral model in power-law:
------------------------------------------------------------
Parameters  : value       lower 90%   higher 90%
Photon index: 2.17818     ( -0.387264   0.448305 )
Norm@50keV  : 5.27434E-03    ( -0.00163537   0.00157845 )
------------------------------------------------------------
#Fit statistic : Chi-Squared =          57.26 using 59 PHA bins.
# Reduced chi-squared =          1.005 for     57 degrees of freedom
# Null hypothesis probability =   4.654886e-01

Photon flux (15-150 keV)    in 1 sec: 0.863375 ( -0.17399  0.174065 ) ph/cm2/s
Energy fluence (15-150 keV)             : 4.94527e-08 ( -1.27769e-08  1.35879e-08 ) ergs/cm2
Cutoff power-law model
Time interval is from    0.140 sec. to    1.140 sec.
Spectral model in the cutoff power-law:
------------------------------------------------------------
Parameters  : value       lower 90%   higher 90%
Photon index: 1.74607     ( -1.99005   -1.99005 )
Epeak [keV] : 21.6495      (   )
Norm@50keV  : 9.93478E-03    (     )
------------------------------------------------------------
#Fit statistic : Chi-Squared =          57.10 using 59 PHA bins.
# Reduced chi-squared =          1.020 for     56 degrees of freedom
# Null hypothesis probability =   4.339410e-01

Photon flux (15-150 keV)    in 1 sec: 0.863075 ( -0.17302  0.174455 ) ph/cm2/s
Energy fluence (15-150 keV)             : 0 ( 0  0 ) ergs/cm2
Band function

Time interval is from    0.140 sec. to    1.140 sec.


Spectral model in the Band function:
------------------------------------------------------------
Parameters  : value       lower 90%   higher 90%
alpha       :    (     )
beta        :     (     )
Epeak [keV] :       (   )
Norm@50keV   :     (     )
------------------------------------------------------------

Photon flux (15-150 keV)    in  sec:  (    ) ph/cm2/s
Energy fluence (15-150 keV)             : 0 ( 0  0 ) ergs/cm2
Single BB
Spectral model blackbody:
------------------------------------------------------------
Parameters  : value    Lower 90%  Upper 90%
kT [keV]    : 8.15733  (-1.56906  1.88422)
R^2/D10^2   : 0.903289  (-0.509703   1.19719)
(R is the radius in km and D10 is the distance to the source in units of 10 kpc)
------------------------------------------------------------
#Fit statistic : Chi-Squared =          58.86 using 59 PHA bins.
# Reduced chi-squared =          1.033 for     57 degrees of freedom
# Null hypothesis probability =   4.070718e-01

Energy  Fluence     90% Error
[keV]   [erg/cm2]   [erg/cm2]
15- 25  1.102e-08   4.204e-09
25- 50  1.995e-08   8.201e-09
50-150  5.583e-09   3.498e-09
15-150  3.656e-08   1.409e-08
Thermal bremsstrahlung (OTTB)
Spectral model: thermal bremsstrahlung
------------------------------------------------------------
Parameters  : value         Lower 90%    Upper 90%
kT [keV]    : 43.5951       (-18.2684      44.8184)
Norm        : 5.31394       (-1.6883     2.74788)
------------------------------------------------------------
#Fit statistic : Chi-Squared =          57.05 using 59 PHA bins.
# Reduced chi-squared =          1.001 for     57 degrees of freedom
# Null hypothesis probability =   4.730443e-01

Energy  Fluence     90% Error
[keV]   [erg/cm2]   [erg/cm2]
15- 25  1.254e-08   3.462e-09
25- 50  1.710e-08   5.625e-09
50-150  1.450e-08   8.328e-09
15-150  4.413e-08   1.447e-08
Double BB
------------------------------------------------------------
#Fit statistic : Chi-Squared =          56.88 using 59 PHA bins.
#Fit statistic : Chi-Squared =          55.71 using 59 PHA bins.
#Fit statistic : Chi-Squared =          55.55 using 59 PHA bins.
#Fit statistic : Chi-Squared =          55.53 using 59 PHA bins.
# Reduced chi-squared =          1.034 for     55 degrees of freedom
# Reduced chi-squared =          1.013 for     55 degrees of freedom
# Reduced chi-squared =          1.010 for     55 degrees of freedom
# Reduced chi-squared =          1.010 for     55 degrees of freedom
# Null hypothesis probability =   4.050417e-01
# Null hypothesis probability =   4.480112e-01
# Null hypothesis probability =   4.538745e-01
# Null hypothesis probability =   4.546931e-01

Energy  Fluence     90% Error
[keV]   [erg/cm2]   [erg/cm2]
15- 25  1.168e-08   5.925e-09
25- 50  1.839e-08   1.090e-08
50-150  8.208e-09   5.795e-09
15-150  3.828e-08   2.082e-08
Pre-slew spectrum (Pre-slew PHA with pre-slew DRM)
Power-law model

Spectral model in power-law:
------------------------------------------------------------
Parameters  : value       lower 90%   higher 90%
Photon index: 1.87319     ( -0.270707   0.289999 )
Norm@50keV  : 2.95798E-03    ( -0.000560058   0.000541102 )
------------------------------------------------------------
#Fit statistic : Chi-Squared =          53.95 using 59 PHA bins.
# Reduced chi-squared =         0.9464 for     57 degrees of freedom
# Null hypothesis probability =   5.903835e-01

Photon flux (15-150 keV)    in 7.448 sec: 0.419751 ( -0.0623458  0.0623469 ) ph/cm2/s
Energy fluence (15-150 keV)             : 2.02532e-07 ( -3.70825e-08  3.82765e-08 ) ergs/cm2
Cutoff power-law model

Spectral model in the cutoff power-law:
------------------------------------------------------------
Parameters  : value       lower 90%   higher 90%
Photon index: 1.71968     ( -1.52836   0.544929 )
Epeak [keV] : 74.2512      (   )
Norm@50keV  : 3.64640E-03    (     )
------------------------------------------------------------
#Fit statistic : Chi-Squared =          53.90 using 59 PHA bins.
# Reduced chi-squared =         0.9625 for     56 degrees of freedom
# Null hypothesis probability =   5.546975e-01

Photon flux (15-150 keV)    in 7.448 sec: 0.417622 ( -0.064117  0.063789 ) ph/cm2/s
Energy fluence (15-150 keV)             : 1.98964e-07 ( -4.73894e-08  4.12575e-08 ) ergs/cm2
Band function

Spectral model in the Band function:
------------------------------------------------------------
Parameters  : value       lower 90%   higher 90%
alpha       :    (     )
beta        :     (     )
Epeak [keV] :       (   )
Norm@50keV   :     (     )
------------------------------------------------------------

Photon flux (15-150 keV)    in  sec:  (    ) ph/cm2/s
Energy fluence (15-150 keV)             : 0 ( 0  0 ) ergs/cm2
S(25-50 keV) vs. S(50-100 keV) plot

S(25-50 keV)  = 5.85e-08
S(50-100 keV) = 6.39e-08
T90 vs. Hardness ratio plot

T90                                   = 6.80400002002716 sec.
Hardness ratio (energy fluence ratio) = 1.09231
Color vs. Color plot

Count Ratio  (25-50 keV) / (15-25 keV) = 1.20847
Count Ratio (50-100 keV) / (15-25 keV) = 0.449794
Mask shadow pattern

IMX = -4.936019236281153E-01, IMY = 1.088010896182246E-01
TIME vs. PHA plot around the trigger time
Blue+Cyan dotted lines: Time interval of the scaled map
From 0.000000 to 1.024000
TIME vs. DetID plot around the trigger time
Blue+Cyan dotted lines: Time interval of the scaled map
From 0.000000 to 1.024000
100 us light curve (15-350 keV)

Blue+Cyan dotted lines: Time interval of the scaled map
From 0.000000 to 1.024000
Spacecraft aspect plot

Bright source in the pre-burst/pre-slew/post-slew images
Pre-burst image of 15-350 keV band
Time interval of the image:
-105.243400 -3.244000

# RAcent  DECcent POSerr Theta    Phi  PeakCts   SNR AngSep     Name
#  [deg]    [deg]    ['] [deg]  [deg]                   [']
 43.4307 -12.8661    2.3  32.9  121.9   1.2561   5.1 ------	UNKNOWN
 34.1637 -24.0573    2.4  26.1   96.2   0.9541   4.8 ------	UNKNOWN
Pre-slew background subtracted image of 15-350 keV band
Time interval of the image:
-3.244000 4.204000

# RAcent  DECcent POSerr Theta    Phi  PeakCts   SNR AngSep     Name
#  [deg]    [deg]    ['] [deg]  [deg]                   [']
 40.0529  -5.0227    2.1  41.3  119.8   0.7149   5.4 ------	UNKNOWN
 76.8941 -25.1244    1.2  26.8 -167.6   0.3764   9.5 ------	UNKNOWN
303.7906 -63.3568    2.1  58.9   -9.5   1.0430   5.4 ------	UNKNOWN
 87.5674 -56.9285    1.9  24.3  -86.1   0.2637   6.1 ------	UNKNOWN
277.5768 -72.7488    2.2  58.9  -25.1   1.1275   5.2 ------	UNKNOWN
Post-slew image of 15-350 keV band
Time interval of the image:
192.156600 719.520700
720.056000 962.160000

# RAcent  DECcent POSerr Theta    Phi  PeakCts   SNR AngSep     Name
#  [deg]    [deg]    ['] [deg]  [deg]                   [']
 83.6425  22.0140    0.5  47.6  177.3  30.8554  21.4    0.5	Crab
 45.5532  -6.8946    3.3  35.0  104.8   5.0138   3.5 ------	UNKNOWN
 47.3305 -20.3085    2.1  27.6   82.8   5.4043   5.5 ------	UNKNOWN
 66.7992   2.9819    2.6  29.8  148.2   3.6851   4.4 ------	UNKNOWN
107.0314  21.3979    2.7  55.0 -156.4  11.3774   4.3 ------	UNKNOWN
121.9494 -24.2451    3.2  40.8  -92.6  10.8480   3.6 ------	UNKNOWN
Plot creation:
Fri Oct 26 19:32:04 EDT 2018