Estimated redshift from machine learning (Ukwatta et al. 2016) - may take a few minute to calcaulte
Image
Pre-slew 15.0-350.0 keV image (Event data)
#   RAcent    DECcent   POSerr    Theta     Phi              Peak Cts       SNR   Name
  207.6821    40.1206   0.0387    25.0926  -140.2057         0.2277246      4.985 TRIG_00866783

Foreground time interval of the image:
 18.368  29.277 (delta_t =  10.909 [sec])
Background time interval of the image:
-104.923  18.368 (delta_t = 123.291 [sec])
Lightcurves
Notes:
- 1) The mask-weighted light curves are using the flight position.
- 2) Multiple plots of different time binning/intervals are shown to cover all scenarios of short/long GRBs, rate/image triggers, and real/false positives.
- 3) For all the mask-weighted lightcurves, the y-axis units are counts/sec/det where a det is 0.4 x 0.4 = 0.16 sq cm.
- 4) The verticle lines correspond to following: green dotted lines are T50 interval, black dotted lines are T90 interval, blue solid line(s) is a spacecraft slew start time, and orange solid line(s) is a spacecraft slew end time.
- 5) Time of each bin is in the middle of the bin.
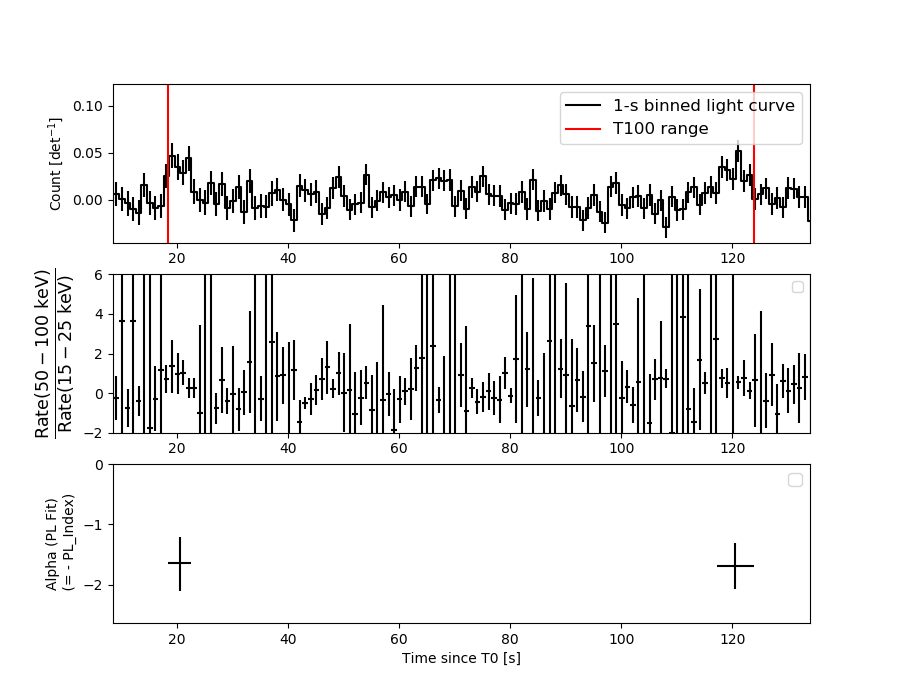
1 s binning
From T0-310 s to T0+310 s
From T100_start - 20 s to T100_end + 30 s

Full time interval
64 ms binning
Full time interval
From T100_start to T100_end
From T0-5 sec to T0+5 sec

16 ms binning
From T100_start-5 s to T100_start+5 s
Blue+Cyan dotted lines: Time interval of the scaled map
From 0.000000 to 2.048000
8 ms binning
From T100_start-3 s to T100_start+3 s

Blue+Cyan dotted lines: Time interval of the scaled map
From 0.000000 to 2.048000
2 ms binning
From T100_start-1 s to T100_start+1 s
Blue+Cyan dotted lines: Time interval of the scaled map
From 0.000000 to 2.048000
SN=5 or 10 sec. binning (whichever binning is satisfied first)
SN=5 or 10 sec. binning (T < 200 sec)
Quad-rate summed light curves (from T0-300s to T0+1000s)

Spectral Evolution
Spectra
Notes:
- 1) The fitting includes the systematic errors.
- 2) When the burst includes telescope slew time periods, the fitting uses an average response file made from multiple 5-s response files through out the slew time plus single time preiod for the non-slew times, and weighted by the total counts in the corresponding time period using addrmf. An average response file is needed becuase a spectral fit using the pre-slew DRM will introduce some errors in both a spectral shape and a normalization if the PHA file contains a lot of the slew/post-slew time interval.
- 3) For fits to more complicated models (e.g. a power-law over a cutoff power-law), the BAT team has decided to require a chi-square improvement of more than 6 for each extra dof.
Time averaged spectrum fit using the average DRM
Power-law model

Time interval is from   18.368 sec. to  123.968 sec.

Spectral model in power-law:
------------------------------------------------------------
Parameters  : value       lower 90%   higher 90%
Photon index: 1.82437     ( -0.677781   0.872766 )
Norm@50keV  : 2.85182E-04    ( -0.000143613   0.000126558 )
------------------------------------------------------------
#Fit statistic : Chi-Squared =          59.45 using 59 PHA bins.
# Reduced chi-squared =          1.043 for     57 degrees of freedom
# Null hypothesis probability =   3.865078e-01

Photon flux (15-150 keV)    in 105.6 sec: 3.96770E-02 ( -0.0144509  0.0144511 ) ph/cm2/s
Energy fluence (15-150 keV)             : 2.77086e-07 ( -1.25916e-07  1.34835e-07 ) ergs/cm2
Cutoff power-law model

Time interval is from   18.368 sec. to  123.968 sec.
Spectral model in the cutoff power-law:
------------------------------------------------------------
Parameters  : value       lower 90%   higher 90%
Photon index: 1.75313     ( -2.51093   0.825887 )
Epeak [keV] : 159.951      ( -162.004 -162.014 )
Norm@50keV  : 3.11418E-04    ( -0.000311617   0.00498033 )
------------------------------------------------------------
#Fit statistic : Chi-Squared =          59.44 using 59 PHA bins.
# Reduced chi-squared =          1.062 for     56 degrees of freedom
# Null hypothesis probability =   3.513182e-01

Photon flux (15-150 keV)    in 105.6 sec: 3.96050E-02 ( -0.0145623  0.0144759 ) ph/cm2/s
Energy fluence (15-150 keV)             : 2.76029e-07 ( -1.25187e-07  1.19724e-07 ) ergs/cm2
Band function

Time interval is from   18.368 sec. to  123.968 sec.


Spectral model in the Band function:
------------------------------------------------------------
Parameters  : value       lower 90%   higher 90%
alpha       :    (     )
beta        :     (     )
Epeak [keV] :       (   )
Norm@50keV   :     (     )
------------------------------------------------------------

Photon flux (15-150 keV)    in  sec:  (    ) ph/cm2/s
Energy fluence (15-150 keV)             : 0 ( 0  0 ) ergs/cm2
Single BB

Spectral model blackbody:
------------------------------------------------------------
Parameters  : value    Lower 90%  Upper 90%
kT [keV]    : 16.3825  (-10.8577  10.8561)
R^2/D10^2   : 3.12678E-03  (-0.00307915   0.155694)
(R is the radius in km and D10 is the distance to the source in units of 10 kpc)
------------------------------------------------------------
#Fit statistic : Chi-Squared =          63.13 using 59 PHA bins.
# Reduced chi-squared =          1.107 for     57 degrees of freedom
# Null hypothesis probability =   2.687986e-01

Energy  Fluence     90% Error
[keV]   [erg/cm2]   [erg/cm2]
15- 25  1.822e-08   1.255e-08
25- 50  7.823e-08   5.037e-08
50-150  1.480e-07   1.020e-07
15-150  2.445e-07   1.565e-07
Thermal bremsstrahlung (OTTB)

Spectral model: thermal bremsstrahlung
------------------------------------------------------------
Parameters  : value         Lower 90%    Upper 90%
kT [keV]    : 115.694       (-84.071      -114.417)
Norm        : 0.169394       (-0.0669671     0.134872)
------------------------------------------------------------
#Fit statistic : Chi-Squared =          59.61 using 59 PHA bins.
# Reduced chi-squared =          1.046 for     57 degrees of freedom
# Null hypothesis probability =   3.809245e-01

Energy  Fluence     90% Error
[keV]   [erg/cm2]   [erg/cm2]
15- 25  4.665e-08   2.886e-08
25- 50  8.293e-08   5.114e-08
50-150  1.453e-07   1.106e-07
15-150  2.749e-07   1.871e-07
Double BB

Spectral model: bbodyrad<1> + bbodyrad<2>
------------------------------------------------------------
Parameters  : value         Lower 90%    Upper 90%
kT1 [keV]   : 3.75156        (-2.32154      3.98395)
R1^2/D10^2  : 0.677356        (-0.64956      2.20449)
kT2 [keV]   : 21.9091        (-9.18505      21.4312)
R2^2/D10^2  : 9.95635E-04    (-0.00088288   0.00361081)
------------------------------------------------------------
#Fit statistic : Chi-Squared =          57.57 using 59 PHA bins.
# Reduced chi-squared =          1.047 for     55 degrees of freedom
# Null hypothesis probability =   3.803859e-01

Energy  Fluence     90% Error
[keV]   [erg/cm2]   [erg/cm2]
15- 25  5.663e-08   3.132e-08
25- 50  6.352e-08   3.610e-08
50-150  1.771e-07   1.262e-07
15-150  2.973e-07   1.737e-07
Peak spectrum fit
Power-law model

Time interval is from   18.820 sec. to   19.820 sec.

Spectral model in power-law:
------------------------------------------------------------
Parameters  : value       lower 90%   higher 90%
Photon index: 1.54945     ( -0.574079   0.616719 )
Norm@50keV  : 4.01493E-03    ( -0.00145883   0.00141482 )
------------------------------------------------------------
#Fit statistic : Chi-Squared =          55.51 using 59 PHA bins.
# Reduced chi-squared =         0.9739 for     57 degrees of freedom
# Null hypothesis probability =   5.311647e-01

Photon flux (15-150 keV)    in 1 sec: 0.508201 ( -0.175194  0.175776 ) ph/cm2/s
Energy fluence (15-150 keV)             : 3.78051e-08 ( -1.43061e-08  1.47434e-08 ) ergs/cm2
Cutoff power-law model

Time interval is from   18.820 sec. to   19.820 sec.
Spectral model in the cutoff power-law:
------------------------------------------------------------
Parameters  : value       lower 90%   higher 90%
Photon index: 0.520140     ( -3.89531   1.73553 )
Epeak [keV] : 73.1436      (   )
Norm@50keV  : 1.31022E-02    (     )
------------------------------------------------------------
#Fit statistic : Chi-Squared =          54.96 using 59 PHA bins.
# Reduced chi-squared =         0.9815 for     56 degrees of freedom
# Null hypothesis probability =   5.140702e-01

Photon flux (15-150 keV)    in 1 sec: 0.489982 ( -0.182451  0.181208 ) ph/cm2/s
Energy fluence (15-150 keV)             : 3.58881e-08 ( -1.42654e-08  1.53744e-08 ) ergs/cm2
Band function

Time interval is from   18.820 sec. to   19.820 sec.


Spectral model in the Band function:
------------------------------------------------------------
Parameters  : value       lower 90%   higher 90%
alpha       :    (     )
beta        :     (     )
Epeak [keV] :       (   )
Norm@50keV   :     (     )
------------------------------------------------------------

Photon flux (15-150 keV)    in  sec:  (    ) ph/cm2/s
Energy fluence (15-150 keV)             : 0 ( 0  0 ) ergs/cm2
Single BB

Spectral model blackbody:
------------------------------------------------------------
Parameters  : value    Lower 90%  Upper 90%
kT [keV]    : 15.5335  (-5.21833  7.73567)
R^2/D10^2   : 5.29714E-02  (-0.0529403   0.168079)
(R is the radius in km and D10 is the distance to the source in units of 10 kpc)
------------------------------------------------------------
#Fit statistic : Chi-Squared =          55.97 using 59 PHA bins.
# Reduced chi-squared =         0.9818 for     57 degrees of freedom
# Null hypothesis probability =   5.139227e-01

Energy  Fluence     90% Error
[keV]   [erg/cm2]   [erg/cm2]
15- 25  2.659e-09   1.699e-09
25- 50  1.091e-08   6.970e-09
50-150  1.818e-08   1.189e-08
15-150  3.174e-08   2.023e-08
Thermal bremsstrahlung (OTTB)
Spectral model: thermal bremsstrahlung
------------------------------------------------------------
Parameters  : value         Lower 90%    Upper 90%
kT [keV]    : 196.019       (-192.97      -192.97)
Norm        : 2.09374       (-0.711544     1.00502)
------------------------------------------------------------
#Fit statistic : Chi-Squared =          55.23 using 59 PHA bins.
# Reduced chi-squared =         0.9689 for     57 degrees of freedom
# Null hypothesis probability =   5.419343e-01

Energy  Fluence     90% Error
[keV]   [erg/cm2]   [erg/cm2]
15- 25  5.225e-09   3.317e-09
25- 50  1.003e-08   6.235e-09
50-150  2.188e-08   1.325e-08
15-150  3.713e-08   2.196e-08
Double BB
# Reduced chi-squared =         0.9884 for     55 degrees of freedom
# Reduced chi-squared =         0.9874 for     55 degrees of freedom
# Reduced chi-squared =         0.9868 for     55 degrees of freedom
# Reduced chi-squared =         0.9864 for     55 degrees of freedom
# Reduced chi-squared =         0.9862 for     55 degrees of freedom
# Null hypothesis probability =   4.915592e-01
# Null hypothesis probability =   4.925955e-01
# Null hypothesis probability =   4.960030e-01
# Null hypothesis probability =   4.990145e-01
# Null hypothesis probability =   5.011117e-01
# Null hypothesis probability =   5.024155e-01
# Null hypothesis probability =   5.031525e-01
# Null hypothesis probability =   5.035391e-01

Energy  Fluence     90% Error
[keV]   [erg/cm2]   [erg/cm2]
15- 25  4.748e-09   2.628e-09
25- 50  9.524e-09   5.815e-09
50-150  2.024e-08   1.363e-08
15-150  3.452e-08   2.007e-08
Pre-slew spectrum (Pre-slew PHA with pre-slew DRM)
Power-law model

Spectral model in power-law:
------------------------------------------------------------
Parameters  : value       lower 90%   higher 90%
Photon index: 1.77303     ( -0.722133   0.951626 )
Norm@50keV  : 1.10684E-03    ( -0.000552382   0.000455393 )
------------------------------------------------------------
#Fit statistic : Chi-Squared =          59.83 using 59 PHA bins.
# Reduced chi-squared =          1.050 for     57 degrees of freedom
# Null hypothesis probability =   3.733729e-01

Photon flux (15-150 keV)    in 10.91 sec: 0.150955 ( -0.0528327  0.0528345 ) ph/cm2/s
Energy fluence (15-150 keV)             : 1.11282e-07 ( -4.96047e-08  5.14432e-08 ) ergs/cm2
Cutoff power-law model

Spectral model in the cutoff power-law:
------------------------------------------------------------
Parameters  : value       lower 90%   higher 90%
Photon index: 4.76714     ( -3.97352   0.724171 )
Epeak [keV] : 562.947      ( -73.1819 -560.426 )
Norm@50keV  : 4.68998E-05    ( -4.87391e-05   0.00307599 )
------------------------------------------------------------
#Fit statistic : Chi-Squared =          58.35 using 59 PHA bins.
# Reduced chi-squared =          1.042 for     56 degrees of freedom
# Null hypothesis probability =   3.890445e-01

Photon flux (15-150 keV)    in 10.91 sec: 0.151059 ( -0.0528452  0.052805 ) ph/cm2/s
Energy fluence (15-150 keV)             : 1.11427e-07 ( -4.9592e-08  5.03551e-08 ) ergs/cm2
Band function

Spectral model in the Band function:
------------------------------------------------------------
Parameters  : value       lower 90%   higher 90%
alpha       :    (     )
beta        :     (     )
Epeak [keV] :       (   )
Norm@50keV   :     (     )
------------------------------------------------------------

Photon flux (15-150 keV)    in  sec:  (    ) ph/cm2/s
Energy fluence (15-150 keV)             : 0 ( 0  0 ) ergs/cm2
S(25-50 keV) vs. S(50-100 keV) plot

S(25-50 keV)  = 7.87e-08
S(50-100 keV) = 8.89e-08
T90 vs. Hardness ratio plot

T90                                   = 104.208000063896 sec.
Hardness ratio (energy fluence ratio) = 1.12961
Color vs. Color plot
Count Ratio  (25-50 keV) / (15-25 keV) = 0.957869
Count Ratio (50-100 keV) / (15-25 keV) = 0.951867
Mask shadow pattern

IMX = -3.597987358265692E-01, IMY = 2.997119559476695E-01
TIME vs. PHA plot around the trigger time
Blue+Cyan dotted lines: Time interval of the scaled map
From 0.000000 to 2.048000
TIME vs. DetID plot around the trigger time
Blue+Cyan dotted lines: Time interval of the scaled map
From 0.000000 to 2.048000
100 us light curve (15-350 keV)

Blue+Cyan dotted lines: Time interval of the scaled map
From 0.000000 to 2.048000
Spacecraft aspect plot

Bright source in the pre-burst/pre-slew/post-slew images
Pre-burst image of 15-350 keV band
Time interval of the image:
-104.923400 18.368000

# RAcent  DECcent POSerr Theta    Phi  PeakCts   SNR AngSep     Name
#  [deg]    [deg]    ['] [deg]  [deg]                   [']
130.0273  34.4224    2.3  35.0   37.5   1.1961   4.9 ------	UNKNOWN
143.1913   3.7217    2.6  49.5   -7.9   1.2801   4.5 ------	UNKNOWN
192.4702   7.1590    2.8  41.4  -78.5   2.7647   4.2 ------	UNKNOWN
Pre-slew background subtracted image of 15-350 keV band
Time interval of the image:
18.368000 29.276600

# RAcent  DECcent POSerr Theta    Phi  PeakCts   SNR AngSep     Name
#  [deg]    [deg]    ['] [deg]  [deg]                   [']
196.6511  61.0360    2.3  20.6  162.0   0.2004   5.1 ------	UNKNOWN
Post-slew image of 15-350 keV band
Time interval of the image:
86.476600 962.665800

# RAcent  DECcent POSerr Theta    Phi  PeakCts   SNR AngSep     Name
#  [deg]    [deg]    ['] [deg]  [deg]                   [']
254.5821  35.3918   15.9  37.0  159.8  -0.7839  -0.7    6.8	Her X-1
168.0495  39.0931    3.0  30.2   -1.3   2.7548   3.9 ------	UNKNOWN
261.4083   8.5018    2.7  57.2 -173.9  13.5847   4.3 ------	UNKNOWN
258.7668   5.0889    2.9  57.7 -168.8  13.1541   3.9 ------	UNKNOWN
143.0828  17.7512    2.6  59.3  -14.3  13.9218   4.5 ------	UNKNOWN
Plot creation:
Mon Dec 17 21:19:57 EST 2018