Estimated redshift from machine learning (Ukwatta et al. 2016) - may take a few minute to calcaulte
Image
Pre-slew 15.0-350.0 keV image (Event data)

#   RAcent    DECcent   POSerr    Theta     Phi              Peak Cts       SNR   Name
  146.9164    14.6572   0.0071    35.7683    -6.4828         4.1669157     27.062 TRIG_00869494

Foreground time interval of the image:
  3.192  72.501 (delta_t =  69.309 [sec])
Background time interval of the image:
-217.899   3.192 (delta_t = 221.091 [sec])
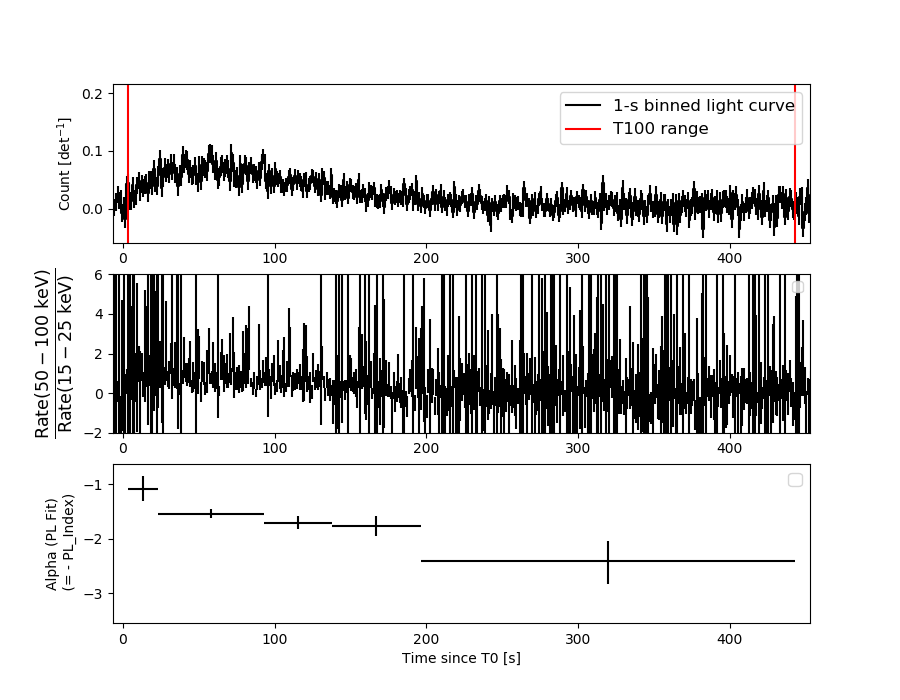
Lightcurves
Notes:
- 1) The mask-weighted light curves are using the flight position.
- 2) Multiple plots of different time binning/intervals are shown to cover all scenarios of short/long GRBs, rate/image triggers, and real/false positives.
- 3) For all the mask-weighted lightcurves, the y-axis units are counts/sec/det where a det is 0.4 x 0.4 = 0.16 sq cm.
- 4) The verticle lines correspond to following: green dotted lines are T50 interval, black dotted lines are T90 interval, blue solid line(s) is a spacecraft slew start time, and orange solid line(s) is a spacecraft slew end time.
- 5) Time of each bin is in the middle of the bin.
1 s binning
From T0-310 s to T0+310 s

From T100_start - 20 s to T100_end + 30 s

Full time interval
64 ms binning
Full time interval
From T100_start to T100_end

From T0-5 sec to T0+5 sec

16 ms binning
From T100_start-5 s to T100_start+5 s

Blue+Cyan dotted lines: Time interval of the scaled map
From 0.000000 to 64.000000
8 ms binning
From T100_start-3 s to T100_start+3 s
Blue+Cyan dotted lines: Time interval of the scaled map
From 0.000000 to 64.000000
2 ms binning
From T100_start-1 s to T100_start+1 s
Blue+Cyan dotted lines: Time interval of the scaled map
From 0.000000 to 64.000000
SN=5 or 10 sec. binning (whichever binning is satisfied first)
SN=5 or 10 sec. binning (T < 200 sec)
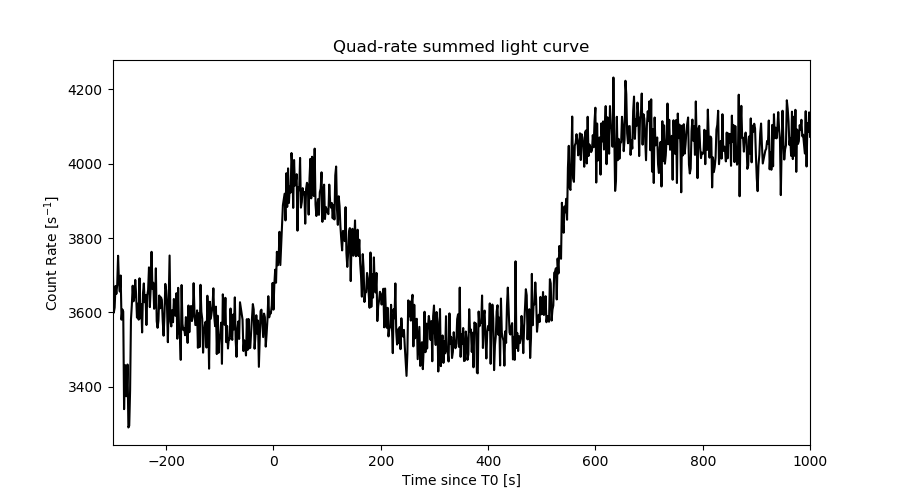
Quad-rate summed light curves (from T0-300s to T0+1000s)
Spectral Evolution
Spectra
Notes:
- 1) The fitting includes the systematic errors.
- 2) When the burst includes telescope slew time periods, the fitting uses an average response file made from multiple 5-s response files through out the slew time plus single time preiod for the non-slew times, and weighted by the total counts in the corresponding time period using addrmf. An average response file is needed becuase a spectral fit using the pre-slew DRM will introduce some errors in both a spectral shape and a normalization if the PHA file contains a lot of the slew/post-slew time interval.
- 3) For fits to more complicated models (e.g. a power-law over a cutoff power-law), the BAT team has decided to require a chi-square improvement of more than 6 for each extra dof.
Time averaged spectrum fit using the average DRM
Power-law model

Time interval is from    3.192 sec. to  443.004 sec.

Spectral model in power-law:
------------------------------------------------------------
Parameters  : value       lower 90%   higher 90%
Photon index: 1.72987     ( -0.0852865   0.0862003 )
Norm@50keV  : 1.50718E-03    ( -7.47846e-05   7.44157e-05 )
------------------------------------------------------------
#Fit statistic : Chi-Squared =          62.27 using 59 PHA bins.
# Reduced chi-squared =          1.092 for     57 degrees of freedom
# Null hypothesis probability =   2.941778e-01

Photon flux (15-150 keV)    in 439.8 sec: 0.202314 ( -0.009784  0.009801 ) ph/cm2/s
Energy fluence (15-150 keV)             : 6.12483e-06 ( -3.15645e-07  3.17533e-07 ) ergs/cm2
Cutoff power-law model
Time interval is from    3.192 sec. to  443.004 sec.
Spectral model in the cutoff power-law:
------------------------------------------------------------
Parameters  : value       lower 90%   higher 90%
Photon index: 1.33671     ( -0.369857   0.341355 )
Epeak [keV] : 80.7888      ( -19.0374 176.339 )
Norm@50keV  : 2.41114E-03    ( -0.00079076   0.00131065 )
------------------------------------------------------------
#Fit statistic : Chi-Squared =          58.37 using 59 PHA bins.
# Reduced chi-squared =          1.042 for     56 degrees of freedom
# Null hypothesis probability =   3.884842e-01

Photon flux (15-150 keV)    in 439.8 sec: 0.197881 ( -0.010475  0.010483 ) ph/cm2/s
Energy fluence (15-150 keV)             : 5.91597e-06 ( -3.63385e-07  3.63822e-07 ) ergs/cm2
Band function

Time interval is from    3.192 sec. to  443.004 sec.


Spectral model in the Band function:
------------------------------------------------------------
Parameters  : value       lower 90%   higher 90%
alpha       :    (     )
beta        :     (     )
Epeak [keV] :       (   )
Norm@50keV   :     (     )
------------------------------------------------------------

Photon flux (15-150 keV)    in  sec:  (    ) ph/cm2/s
Energy fluence (15-150 keV)             : 0 ( 0  0 ) ergs/cm2
Single BB
Spectral model blackbody:
------------------------------------------------------------
Parameters  : value    Lower 90%  Upper 90%
kT [keV]    : 12.8629  (  )
R^2/D10^2   : 3.70683E-02  (   )
(R is the radius in km and D10 is the distance to the source in units of 10 kpc)
------------------------------------------------------------
#Fit statistic : Chi-Squared =         152.89 using 59 PHA bins.
# Reduced chi-squared =         2.6823 for     57 degrees of freedom
# Null hypothesis probability =   1.053857e-10

Energy  Fluence     90% Error
[keV]   [erg/cm2]   [erg/cm2]
15- 25  5.721e-07   5.344e-08
25- 50  1.948e-06   1.080e-07
50-150  2.025e-06   2.111e-07
15-150  4.545e-06   2.423e-07
Thermal bremsstrahlung (OTTB)

Spectral model: thermal bremsstrahlung
------------------------------------------------------------
Parameters  : value         Lower 90%    Upper 90%
kT [keV]    : 126.359       (-24.9041      30.0535)
Norm        : 0.843443       (-0.0501043     0.0620194)
------------------------------------------------------------
#Fit statistic : Chi-Squared =          58.39 using 59 PHA bins.
# Reduced chi-squared =          1.024 for     57 degrees of freedom
# Null hypothesis probability =   4.239614e-01

Energy  Fluence     90% Error
[keV]   [erg/cm2]   [erg/cm2]
15- 25  9.639e-07   7.762e-08
25- 50  1.740e-06   1.218e-07
50-150  3.183e-06   9.135e-07
15-150  5.887e-06   9.632e-07
Double BB

Spectral model: bbodyrad<1> + bbodyrad<2>
------------------------------------------------------------
Parameters  : value         Lower 90%    Upper 90%
kT1 [keV]   : 6.90531        (-0.978232      1.06252)
R1^2/D10^2  : 0.243006        (-0.0911596      0.168891)
kT2 [keV]   : 23.8782        (-3.64314      5.74025)
R2^2/D10^2  : 2.84984E-03    (-0.00157262   0.00261466)
------------------------------------------------------------
#Fit statistic : Chi-Squared =          57.18 using 59 PHA bins.
# Reduced chi-squared =          1.040 for     55 degrees of freedom
# Null hypothesis probability =   3.940645e-01

Energy  Fluence     90% Error
[keV]   [erg/cm2]   [erg/cm2]
15- 25  9.341e-07   1.599e-07
25- 50  1.780e-06   2.441e-07
50-150  3.162e-06   6.911e-07
15-150  5.877e-06   1.002e-06
Peak spectrum fit
Power-law model
Time interval is from   71.328 sec. to   72.328 sec.

Spectral model in power-law:
------------------------------------------------------------
Parameters  : value       lower 90%   higher 90%
Photon index: 1.53260     ( -0.492543   0.502925 )
Norm@50keV  : 6.72420E-03    ( -0.00179413   0.00172587 )
------------------------------------------------------------
#Fit statistic : Chi-Squared =          59.14 using 59 PHA bins.
# Reduced chi-squared =          1.038 for     57 degrees of freedom
# Null hypothesis probability =   3.973825e-01

Photon flux (15-150 keV)    in 1 sec: 0.847046 ( -0.216642  0.216624 ) ph/cm2/s
Energy fluence (15-150 keV)             : 6.34717e-08 ( -1.81058e-08  1.83183e-08 ) ergs/cm2
Cutoff power-law model

Time interval is from   71.328 sec. to   72.328 sec.
Spectral model in the cutoff power-law:
------------------------------------------------------------
Parameters  : value       lower 90%   higher 90%
Photon index: 2.02284     ( -0.264393   0.00425729 )
Epeak [keV] : 9.25550      (   )
Norm@50keV  : 3.66672E-03    (     )
------------------------------------------------------------
#Fit statistic : Chi-Squared =          58.81 using 59 PHA bins.
# Reduced chi-squared =          1.050 for     56 degrees of freedom
# Null hypothesis probability =   3.728887e-01

Photon flux (15-150 keV)    in 1 sec: 0.860377 ( -0.227966  0.205523 ) ph/cm2/s
Energy fluence (15-150 keV)             : 0 ( 0  0 ) ergs/cm2
Band function

Time interval is from   71.328 sec. to   72.328 sec.


Spectral model in the Band function:
------------------------------------------------------------
Parameters  : value       lower 90%   higher 90%
alpha       :    (     )
beta        :     (     )
Epeak [keV] :       (   )
Norm@50keV   :     (     )
------------------------------------------------------------

Photon flux (15-150 keV)    in  sec:  (    ) ph/cm2/s
Energy fluence (15-150 keV)             : 0 ( 0  0 ) ergs/cm2
Single BB

Spectral model blackbody:
------------------------------------------------------------
Parameters  : value    Lower 90%  Upper 90%
kT [keV]    : 14.5068  (-5.72168  11.574)
R^2/D10^2   : 9.94382E-02  (-0.0961768   0.483898)
(R is the radius in km and D10 is the distance to the source in units of 10 kpc)
------------------------------------------------------------
#Fit statistic : Chi-Squared =          69.09 using 59 PHA bins.
# Reduced chi-squared =          1.212 for     57 degrees of freedom
# Null hypothesis probability =   1.309197e-01

Energy  Fluence     90% Error
[keV]   [erg/cm2]   [erg/cm2]
15- 25  4.403e-09   2.770e-09
25- 50  1.695e-08   1.033e-08
50-150  2.391e-08   1.597e-08
15-150  4.527e-08   2.686e-08
Thermal bremsstrahlung (OTTB)
Spectral model: thermal bremsstrahlung
------------------------------------------------------------
Parameters  : value         Lower 90%    Upper 90%
kT [keV]    : 199.363       (-126.745      -199.363)
Norm        : 3.42841       (-0.860872     0.862089)
------------------------------------------------------------
#Fit statistic : Chi-Squared =          60.11 using 59 PHA bins.
# Reduced chi-squared =          1.055 for     57 degrees of freedom
# Null hypothesis probability =   3.636245e-01

Energy  Fluence     90% Error
[keV]   [erg/cm2]   [erg/cm2]
15- 25  8.537e-09   5.065e-09
25- 50  1.642e-08   9.840e-09
50-150  3.602e-08   2.175e-08
15-150  6.098e-08   3.621e-08
Double BB

Spectral model: bbodyrad<1> + bbodyrad<2>
------------------------------------------------------------
Parameters  : value         Lower 90%    Upper 90%
kT1 [keV]   : 5.45549        (-2.06637      5.21845)
R1^2/D10^2  : 3.07359        (-2.8439      22.2245)
kT2 [keV]   : 44.5199        (-37.6329      -44.893)
R2^2/D10^2  : 2.50285E-03    (-0.00224073   0.0182073)
------------------------------------------------------------
#Fit statistic : Chi-Squared =          57.68 using 59 PHA bins.
# Reduced chi-squared =          1.049 for     55 degrees of freedom
# Null hypothesis probability =   3.765696e-01

Energy  Fluence     90% Error
[keV]   [erg/cm2]   [erg/cm2]
15- 25  1.106e-08   6.680e-09
25- 50  1.258e-08   7.160e-09
50-150  4.555e-08   2.683e-08
15-150  6.918e-08   3.613e-08
Pre-slew spectrum (Pre-slew PHA with pre-slew DRM)
Power-law model

Spectral model in power-law:
------------------------------------------------------------
Parameters  : value       lower 90%   higher 90%
Photon index: 1.39129     ( -0.0905103   0.0901039 )
Norm@50keV  : 4.06751E-03    ( -0.000212258   0.00021224 )
------------------------------------------------------------
#Fit statistic : Chi-Squared =          61.21 using 59 PHA bins.
# Reduced chi-squared =          1.074 for     57 degrees of freedom
# Null hypothesis probability =   3.273176e-01

Photon flux (15-150 keV)    in 69.31 sec: 0.494373 ( -0.0272527  0.0273137 ) ph/cm2/s
Energy fluence (15-150 keV)             : 2.72898e-06 ( -1.52969e-07  1.53378e-07 ) ergs/cm2
Cutoff power-law model

Spectral model in the cutoff power-law:
------------------------------------------------------------
Parameters  : value       lower 90%   higher 90%
Photon index: 0.998031     ( -0.381614   0.350682 )
Epeak [keV] : 135.712      ( -42.3298 514.607 )
Norm@50keV  : 6.27809E-03    ( -0.00197061   0.00315948 )
------------------------------------------------------------
#Fit statistic : Chi-Squared =          57.51 using 59 PHA bins.
# Reduced chi-squared =          1.027 for     56 degrees of freedom
# Null hypothesis probability =   4.192153e-01

Photon flux (15-150 keV)    in 69.31 sec: 0.485433 ( -0.028384  0.028401 ) ph/cm2/s
Energy fluence (15-150 keV)             : 2.66841e-06 ( -1.64604e-07  1.63759e-07 ) ergs/cm2
Band function
Spectral model in the Band function:
------------------------------------------------------------
Parameters  : value       lower 90%   higher 90%
alpha       :    (     )
beta        :     (     )
Epeak [keV] :       (   )
Norm@50keV   :     (     )
------------------------------------------------------------

Photon flux (15-150 keV)    in  sec:  (    ) ph/cm2/s
Energy fluence (15-150 keV)             : 0 ( 0  0 ) ergs/cm2
S(25-50 keV) vs. S(50-100 keV) plot
S(25-50 keV)  = 1.68e-06
S(50-100 keV) = 2.02e-06
T90 vs. Hardness ratio plot

T90                                   = 303.195999979973 sec.
Hardness ratio (energy fluence ratio) = 1.20238
Color vs. Color plot

Count Ratio  (25-50 keV) / (15-25 keV) = 1.33685
Count Ratio (50-100 keV) / (15-25 keV) = 0.85698
Mask shadow pattern
IMX = 7.157760779786505E-01, IMY = 8.133471637255016E-02
TIME vs. PHA plot around the trigger time
Blue+Cyan dotted lines: Time interval of the scaled map
From 0.000000 to 64.000000
TIME vs. DetID plot around the trigger time
Blue+Cyan dotted lines: Time interval of the scaled map
From 0.000000 to 64.000000
100 us light curve (15-350 keV)
Blue+Cyan dotted lines: Time interval of the scaled map
From 0.000000 to 64.000000
Spacecraft aspect plot

Bright source in the pre-burst/pre-slew/post-slew images
Pre-burst image of 15-350 keV band
Time interval of the image:
-217.899400 3.192000

# RAcent  DECcent POSerr Theta    Phi  PeakCts   SNR AngSep     Name
#  [deg]    [deg]    ['] [deg]  [deg]                   [']
276.6990  78.9195    2.8  50.2  143.9   4.6984   4.2 ------	UNKNOWN
116.0699  18.8787    2.6  52.3   30.1   5.0039   4.4 ------	UNKNOWN
258.7231  69.4663    3.0  48.8  157.7   2.6380   3.9 ------	UNKNOWN
213.3669  58.4199    2.1  29.5  175.1   1.4488   5.5 ------	UNKNOWN
173.9646  -3.6066    2.9  47.3  -53.4   4.2038   4.0 ------	UNKNOWN
Pre-slew background subtracted image of 15-350 keV band
Time interval of the image:
3.192000 72.500600

# RAcent  DECcent POSerr Theta    Phi  PeakCts   SNR AngSep     Name
#  [deg]    [deg]    ['] [deg]  [deg]                   [']
115.0992  45.1548    2.7  39.5   62.5   1.6626   4.2 ------	UNKNOWN
146.9164  14.6572    0.4  35.8   -6.5   4.1662  27.1 ------	UNKNOWN
155.5977  23.1686    2.5  24.3  -12.2   0.5632   4.7 ------	UNKNOWN
234.5180  42.4760    2.2  44.9 -161.5   1.3950   5.3 ------	UNKNOWN
225.7346  21.9936    2.1  49.4 -132.3   3.5573   5.5 ------	UNKNOWN
Post-slew image of 15-350 keV band
Time interval of the image:
131.100610 270.700600

# RAcent  DECcent POSerr Theta    Phi  PeakCts   SNR AngSep     Name
#  [deg]    [deg]    ['] [deg]  [deg]                   [']
135.5082 -40.4897    4.7  56.1   -9.2   1.2703   2.5    4.0	Vela X-1
150.2028  69.4639    3.0  54.9  161.7   3.4914   3.8 ------	UNKNOWN
116.7234 -12.1358    2.4  40.2   30.1   1.5178   4.7 ------	UNKNOWN
146.9098  14.6597    0.8   0.0  104.4   2.4472  14.4 ------	UNKNOWN
152.6830 -23.8168    2.7  38.9  -28.1   0.9695   4.3 ------	UNKNOWN
Plot creation:
Mon Dec 17 21:12:22 EST 2018