Estimated redshift from machine learning (Ukwatta et al. 2016) - may take a few minute to calcaulte
Image
Pre-slew 15.0-350.0 keV image (Event data)
#   RAcent    DECcent   POSerr    Theta     Phi              Peak Cts       SNR   Name
  197.0903    52.2220   0.0163    20.7151  -115.2725         0.5594912     11.916 TRIG_00870201

Foreground time interval of the image:
 -1.224   9.960 (delta_t =  11.184 [sec])
Background time interval of the image:
-239.288  -1.224 (delta_t = 238.064 [sec])
Lightcurves
Notes:
- 1) The mask-weighted light curves are using the flight position.
- 2) Multiple plots of different time binning/intervals are shown to cover all scenarios of short/long GRBs, rate/image triggers, and real/false positives.
- 3) For all the mask-weighted lightcurves, the y-axis units are counts/sec/det where a det is 0.4 x 0.4 = 0.16 sq cm.
- 4) The verticle lines correspond to following: green dotted lines are T50 interval, black dotted lines are T90 interval, blue solid line(s) is a spacecraft slew start time, and orange solid line(s) is a spacecraft slew end time.
- 5) Time of each bin is in the middle of the bin.
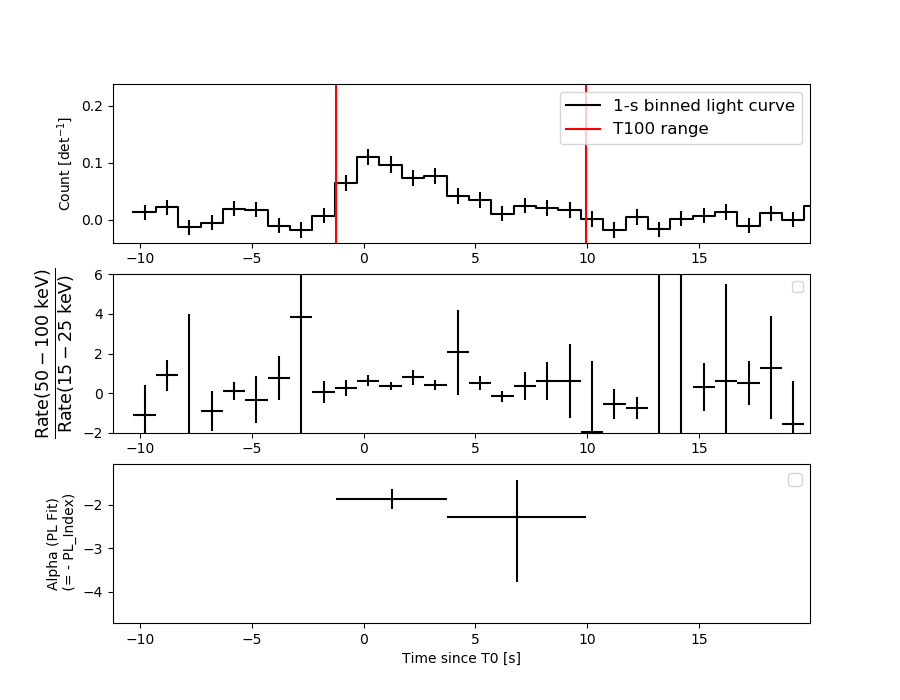
1 s binning
From T0-310 s to T0+310 s

From T100_start - 20 s to T100_end + 30 s
Full time interval
64 ms binning
Full time interval
From T100_start to T100_end

From T0-5 sec to T0+5 sec

16 ms binning
From T100_start-5 s to T100_start+5 s
Blue+Cyan dotted lines: Time interval of the scaled map
From 0.000000 to 2.048000
8 ms binning
From T100_start-3 s to T100_start+3 s
Blue+Cyan dotted lines: Time interval of the scaled map
From 0.000000 to 2.048000
2 ms binning
From T100_start-1 s to T100_start+1 s
Blue+Cyan dotted lines: Time interval of the scaled map
From 0.000000 to 2.048000
SN=5 or 10 sec. binning (whichever binning is satisfied first)
SN=5 or 10 sec. binning (T < 200 sec)
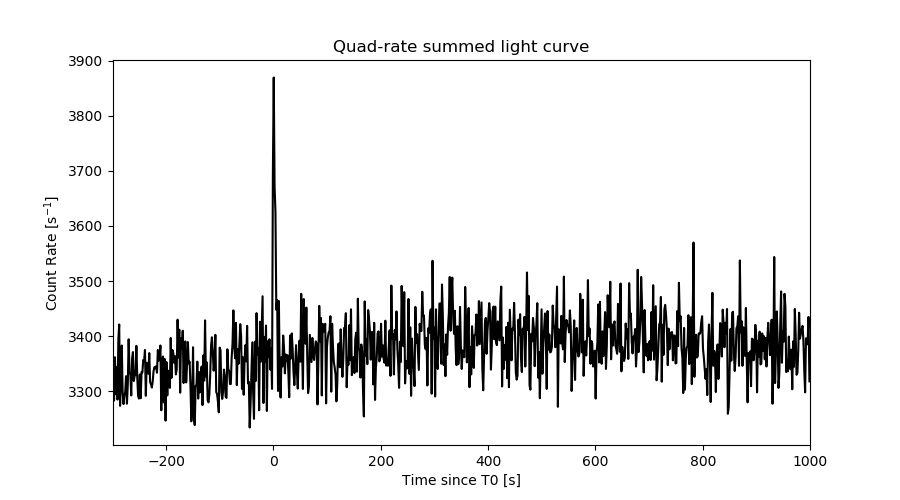
Quad-rate summed light curves (from T0-300s to T0+1000s)
Spectral Evolution
Spectra
Notes:
- 1) The fitting includes the systematic errors.
- 2) When the burst includes telescope slew time periods, the fitting uses an average response file made from multiple 5-s response files through out the slew time plus single time preiod for the non-slew times, and weighted by the total counts in the corresponding time period using addrmf. An average response file is needed becuase a spectral fit using the pre-slew DRM will introduce some errors in both a spectral shape and a normalization if the PHA file contains a lot of the slew/post-slew time interval.
- 3) For fits to more complicated models (e.g. a power-law over a cutoff power-law), the BAT team has decided to require a chi-square improvement of more than 6 for each extra dof.
Time averaged spectrum fit using the average DRM
Power-law model

Time interval is from   -1.224 sec. to    9.960 sec.

Spectral model in power-law:
------------------------------------------------------------
Parameters  : value       lower 90%   higher 90%
Photon index: 1.93245     ( -0.260518   0.279787 )
Norm@50keV  : 2.77355E-03    ( -0.000507503   0.000489352 )
------------------------------------------------------------
#Fit statistic : Chi-Squared =          45.82 using 59 PHA bins.
# Reduced chi-squared =         0.8039 for     57 degrees of freedom
# Null hypothesis probability =   8.556099e-01

Photon flux (15-150 keV)    in 11.18 sec: 0.403657 ( -0.05575  0.05575 ) ph/cm2/s
Energy fluence (15-150 keV)             : 2.85273e-07 ( -4.92517e-08  5.07905e-08 ) ergs/cm2
Cutoff power-law model
Time interval is from   -1.224 sec. to    9.960 sec.
Spectral model in the cutoff power-law:
------------------------------------------------------------
Parameters  : value       lower 90%   higher 90%
Photon index: 1.94548     ( -1.00326   0.677016 )
Epeak [keV] : 9999.36      (   )
Norm@50keV  : 2.75050E-03    (     )
------------------------------------------------------------
#Fit statistic : Chi-Squared =          45.83 using 59 PHA bins.
# Reduced chi-squared =         0.8183 for     56 degrees of freedom
# Null hypothesis probability =   8.321073e-01

Photon flux (15-150 keV)    in 11.18 sec: 0.404939 ( -0.084865  0.054859 ) ph/cm2/s
Energy fluence (15-150 keV)             : 2.87139e-07 ( -5.08784e-08  3.97208e-08 ) ergs/cm2
Band function

Time interval is from   -1.224 sec. to    9.960 sec.


Spectral model in the Band function:
------------------------------------------------------------
Parameters  : value       lower 90%   higher 90%
alpha       :    (     )
beta        :     (     )
Epeak [keV] :       (   )
Norm@50keV   :     (     )
------------------------------------------------------------

Photon flux (15-150 keV)    in  sec:  (    ) ph/cm2/s
Energy fluence (15-150 keV)             : 0 ( 0  0 ) ergs/cm2
Single BB
Spectral model blackbody:
------------------------------------------------------------
Parameters  : value    Lower 90%  Upper 90%
kT [keV]    : 9.12217  (-1.59495  2.01305)
R^2/D10^2   : 0.261929  (-0.13898   0.286726)
(R is the radius in km and D10 is the distance to the source in units of 10 kpc)
------------------------------------------------------------
#Fit statistic : Chi-Squared =          61.26 using 59 PHA bins.
# Reduced chi-squared =          1.075 for     57 degrees of freedom
# Null hypothesis probability =   3.257112e-01

Energy  Fluence     90% Error
[keV]   [erg/cm2]   [erg/cm2]
15- 25  4.777e-08   1.207e-08
25- 50  1.037e-07   2.277e-08
50-150  4.121e-08   1.613e-08
15-150  1.927e-07   4.226e-08
Thermal bremsstrahlung (OTTB)
Spectral model: thermal bremsstrahlung
------------------------------------------------------------
Parameters  : value         Lower 90%    Upper 90%
kT [keV]    : 73.9872       (-28.4519      64.8552)
Norm        : 1.94003       (-0.393532     0.523121)
------------------------------------------------------------
#Fit statistic : Chi-Squared =          47.11 using 59 PHA bins.
# Reduced chi-squared =         0.8264 for     57 degrees of freedom
# Null hypothesis probability =   8.220112e-01

Energy  Fluence     90% Error
[keV]   [erg/cm2]   [erg/cm2]
15- 25  5.595e-08   1.050e-08
25- 50  9.032e-08   1.580e-08
50-150  1.208e-07   7.058e-08
15-150  2.671e-07   6.904e-08
Double BB

Spectral model: bbodyrad<1> + bbodyrad<2>
------------------------------------------------------------
Parameters  : value         Lower 90%    Upper 90%
kT1 [keV]   : 5.85751        (-1.67083      1.95553)
R1^2/D10^2  : 1.14306        (-0.738954      2.99531)
kT2 [keV]   : 25.6652        (-10.3229      50.5558)
R2^2/D10^2  : 4.02294E-03    (-0.0038119   0.0232804)
------------------------------------------------------------
#Fit statistic : Chi-Squared =          45.04 using 59 PHA bins.
# Reduced chi-squared =         0.8190 for     55 degrees of freedom
# Null hypothesis probability =   8.286613e-01

Energy  Fluence     90% Error
[keV]   [erg/cm2]   [erg/cm2]
15- 25  6.131e-08   3.365e-08
25- 50  8.237e-08   3.635e-08
50-150  1.463e-07   8.191e-08
15-150  2.900e-07   1.525e-07
Peak spectrum fit
Power-law model

Time interval is from   -0.388 sec. to    0.612 sec.

Spectral model in power-law:
------------------------------------------------------------
Parameters  : value       lower 90%   higher 90%
Photon index: 1.74624     ( -0.367754   0.385386 )
Norm@50keV  : 6.29604E-03    ( -0.00161951   0.00157062 )
------------------------------------------------------------
#Fit statistic : Chi-Squared =          75.78 using 59 PHA bins.
# Reduced chi-squared =          1.329 for     57 degrees of freedom
# Null hypothesis probability =   4.879432e-02

Photon flux (15-150 keV)    in 1 sec: 0.850192 ( -0.186793  0.186818 ) ph/cm2/s
Energy fluence (15-150 keV)             : 5.81179e-08 ( -1.50206e-08  1.55656e-08 ) ergs/cm2
Cutoff power-law model

Time interval is from   -0.388 sec. to    0.612 sec.
Spectral model in the cutoff power-law:
------------------------------------------------------------
Parameters  : value       lower 90%   higher 90%
Photon index: -9.98933     ( 9.99613   4.19105 )
Epeak [keV] : 28.9973      ( -2.43922 2.60064 )
Norm@50keV  : 1.26454E+06    ( -1.28648e+06   2.96301e+06 )
------------------------------------------------------------
#Fit statistic : Chi-Squared =          66.71 using 59 PHA bins.
# Reduced chi-squared =          1.191 for     56 degrees of freedom
# Null hypothesis probability =   1.548034e-01

Photon flux (15-150 keV)    in 1 sec: 0.841800 ( -0.248093  0.071762 ) ph/cm2/s
Energy fluence (15-150 keV)             : 5.46298e-08 ( -2.86438e-08  -1.45782e-08 ) ergs/cm2
Band function

Time interval is from   -0.388 sec. to    0.612 sec.


Spectral model in the Band function:
------------------------------------------------------------
Parameters  : value       lower 90%   higher 90%
alpha       :    (     )
beta        :     (     )
Epeak [keV] :       (   )
Norm@50keV   :     (     )
------------------------------------------------------------

Photon flux (15-150 keV)    in  sec:  (    ) ph/cm2/s
Energy fluence (15-150 keV)             : 0 ( 0  0 ) ergs/cm2
Single BB

Spectral model blackbody:
------------------------------------------------------------
Parameters  : value    Lower 90%  Upper 90%
kT [keV]    : 8.14353  (-1.41504  1.95259)
R^2/D10^2   : 0.926457  (-0.531548   1.02608)
(R is the radius in km and D10 is the distance to the source in units of 10 kpc)
------------------------------------------------------------
#Fit statistic : Chi-Squared =          74.59 using 59 PHA bins.
# Reduced chi-squared =          1.309 for     57 degrees of freedom
# Null hypothesis probability =   5.890718e-02

Energy  Fluence     90% Error
[keV]   [erg/cm2]   [erg/cm2]
15- 25  1.125e-08   4.613e-09
25- 50  2.031e-08   8.937e-09
50-150  5.652e-09   3.632e-09
15-150  3.722e-08   1.553e-08
Thermal bremsstrahlung (OTTB)

Spectral model: thermal bremsstrahlung
------------------------------------------------------------
Parameters  : value         Lower 90%    Upper 90%
kT [keV]    : 94.1846       (-50.9845      -94.1984)
Norm        : 3.85480       (-1.0206     1.58473)
------------------------------------------------------------
#Fit statistic : Chi-Squared =          75.50 using 59 PHA bins.
# Reduced chi-squared =          1.325 for     57 degrees of freedom
# Null hypothesis probability =   5.098114e-02

Energy  Fluence     90% Error
[keV]   [erg/cm2]   [erg/cm2]
15- 25  1.007e-08   3.402e-09
25- 50  1.720e-08   7.352e-09
50-150  2.692e-08   2.037e-08
15-150  5.418e-08   3.299e-08
Double BB

------------------------------------------------------------
Parameters  : value         Lower 90%    Upper 90%
kT1 [keV]   : 7.25147        (-1.35726      1.672)
R1^2/D10^2  : 1.30662        (-0.720305      1.25336)
kT2 [keV]   : 64.3912        (-39.8927      -64.0167)
R2^2/D10^2  : 6.82243E-04    (-0.000642049   0.00862488)
------------------------------------------------------------
#Fit statistic : Chi-Squared =          66.83 using 59 PHA bins.
#Fit statistic : Chi-Squared =          66.81 using 59 PHA bins.
# Reduced chi-squared =          1.215 for     55 degrees of freedom
# Reduced chi-squared =          1.215 for     55 degrees of freedom
# Null hypothesis probability =   1.317548e-01
# Null hypothesis probability =   1.320652e-01

Energy  Fluence     90% Error
[keV]   [erg/cm2]   [erg/cm2]
15- 25  1.169e-08   6.790e-09
25- 50  1.863e-08   1.042e-08
50-150  3.224e-08   1.683e-08
15-150  6.256e-08   3.159e-08
Pre-slew spectrum (Pre-slew PHA with pre-slew DRM)
Power-law model

Spectral model in power-law:
------------------------------------------------------------
Parameters  : value       lower 90%   higher 90%
Photon index: 1.93245     ( -0.260518   0.279787 )
Norm@50keV  : 2.77355E-03    ( -0.000507503   0.000489352 )
------------------------------------------------------------
#Fit statistic : Chi-Squared =          45.82 using 59 PHA bins.
# Reduced chi-squared =         0.8039 for     57 degrees of freedom
# Null hypothesis probability =   8.556099e-01

Photon flux (15-150 keV)    in 11.18 sec: 0.403630 ( -0.0557455  0.0557461 ) ph/cm2/s
Energy fluence (15-150 keV)             : 2.85225e-07 ( -4.92334e-08  5.07978e-08 ) ergs/cm2
Cutoff power-law model

Spectral model in the cutoff power-law:
------------------------------------------------------------
Parameters  : value       lower 90%   higher 90%
Photon index: 1.92924     ( -0.99417   0.869287 )
Epeak [keV] : 590.465      (   )
Norm@50keV  : 2.78390E-03    (     )
------------------------------------------------------------
#Fit statistic : Chi-Squared =          45.82 using 59 PHA bins.
# Reduced chi-squared =         0.8183 for     56 degrees of freedom
# Null hypothesis probability =   8.321994e-01

Photon flux (15-150 keV)    in 11.18 sec: 0.403574 ( -0.055795  0.05567 ) ph/cm2/s
Energy fluence (15-150 keV)             : 2.84683e-07 ( -5.56853e-08  5.13274e-08 ) ergs/cm2
Band function

Spectral model in the Band function:
------------------------------------------------------------
Parameters  : value       lower 90%   higher 90%
alpha       :    (     )
beta        :     (     )
Epeak [keV] :       (   )
Norm@50keV   :     (     )
------------------------------------------------------------

Photon flux (15-150 keV)    in  sec:  (    ) ph/cm2/s
Energy fluence (15-150 keV)             : 0 ( 0  0 ) ergs/cm2
S(25-50 keV) vs. S(50-100 keV) plot

S(25-50 keV)  = 8.41e-08
S(50-100 keV) = 8.81e-08
T90 vs. Hardness ratio plot

T90                                   = 9.16800010204315 sec.
Hardness ratio (energy fluence ratio) = 1.04756
Color vs. Color plot

Count Ratio  (25-50 keV) / (15-25 keV) = 0.851772
Count Ratio (50-100 keV) / (15-25 keV) = 0.493247
Mask shadow pattern

IMX = -1.614498973310166E-01, IMY = 3.419747014472937E-01
TIME vs. PHA plot around the trigger time
Blue+Cyan dotted lines: Time interval of the scaled map
From 0.000000 to 2.048000
TIME vs. DetID plot around the trigger time
Blue+Cyan dotted lines: Time interval of the scaled map
From 0.000000 to 2.048000
100 us light curve (15-350 keV)
Blue+Cyan dotted lines: Time interval of the scaled map
From 0.000000 to 2.048000
Spacecraft aspect plot

Bright source in the pre-burst/pre-slew/post-slew images
Pre-burst image of 15-350 keV band
Time interval of the image:
-239.288000 -1.224000

# RAcent  DECcent POSerr Theta    Phi  PeakCts   SNR AngSep     Name
#  [deg]    [deg]    ['] [deg]  [deg]                   [']
316.3782  61.4512    2.9  51.7  148.8   4.8556   4.0 ------	UNKNOWN
111.6910  21.6062    2.5  55.4   16.7   5.6799   4.7 ------	UNKNOWN
275.2316  73.5981    2.9  34.0  160.1   1.3385   4.0 ------	UNKNOWN
188.3190  32.8851    3.1  35.2  -83.5   1.7158   3.7 ------	UNKNOWN
183.5622  24.8661    2.3  42.0  -73.8   4.3727   5.0 ------	UNKNOWN
Pre-slew background subtracted image of 15-350 keV band
Time interval of the image:
-1.224000 9.960000

# RAcent  DECcent POSerr Theta    Phi  PeakCts   SNR AngSep     Name
#  [deg]    [deg]    ['] [deg]  [deg]                   [']
100.2513  31.1626    2.7  51.4   33.5   0.9285   4.2 ------	UNKNOWN
197.0904  52.2220    1.0  20.7 -115.3   0.5594  11.9 ------	UNKNOWN
Post-slew image of 15-350 keV band
Time interval of the image:
74.612600 714.456800
720.712000 782.719300
840.712000 962.746200

# RAcent  DECcent POSerr Theta    Phi  PeakCts   SNR AngSep     Name
#  [deg]    [deg]    ['] [deg]  [deg]                   [']
254.6721  35.4203    6.7  43.5 -158.8   1.9803   1.7   11.5	Her X-1
152.6155   5.2790    2.8  59.5  -13.9  15.1033   4.2 ------	UNKNOWN
156.7522   6.1418    3.2  56.7  -17.6   7.6884   3.6 ------	UNKNOWN
217.4000  24.8942    3.4  31.4 -105.2   3.2515   3.4 ------	UNKNOWN
240.3825  18.0570    2.5  48.0 -129.3  11.2193   4.5 ------	UNKNOWN
Plot creation:
Mon Dec 17 21:11:06 EST 2018