Estimated redshift from machine learning (Ukwatta et al. 2016) - may take a few minutes to calcaulte
Image
Pre-slew 15-350 keV image (Event data; bkg subtracted)

#   RAcent  DECcent POSerr  Theta    Phi     Peak Cts     SNR  Name
    9.3507 +43.0790 0.0520    1.9  -60.3       0.4176     3.7  TRIG_00872556
------------------------------------------

Foreground time interval of the image:
  0.000  72.000 (delta_t =  72.000 [sec])
Background time interval of the image:
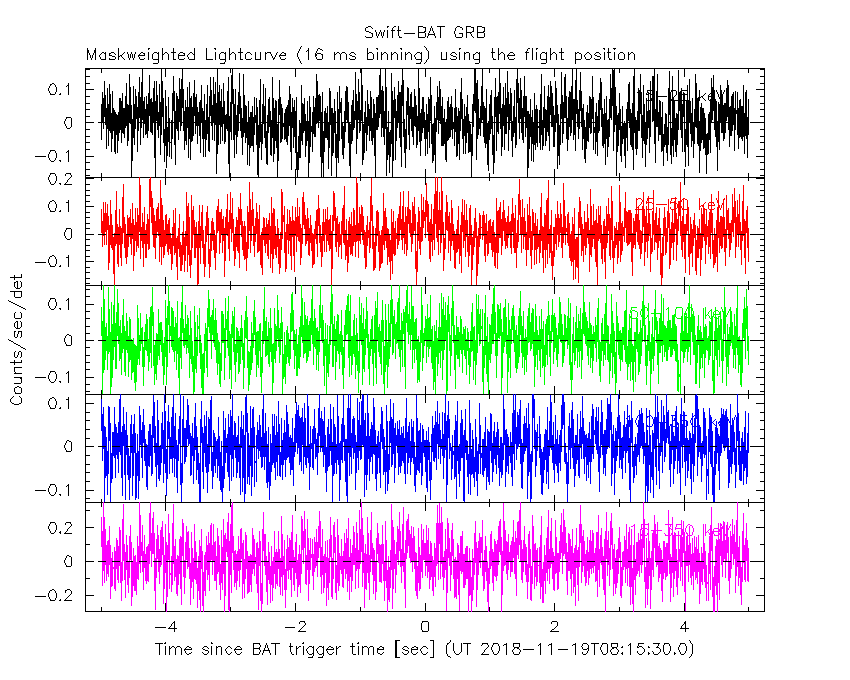
Lightcurves
Notes:
- 1) All plots contain as much data as has been downloaded to date.
- 2) The mask-weighted light curves are using the flight position.
- 3) Multiple plots of different time binning/intervals are shown to cover all scenarios of short/long GRBs, rate/image triggers, and real/false positives.
- 4) For all the mask-weighted lightcurves, the y-axis units are counts/sec/det where a det is 0.4 x 0.4 = 0.16 sq cm.
- 5) The verticle lines correspond to following: green dotted lines are T50 interval, black dotted lines are T90 interval, blue solid line(s) is a spacecraft slew start time, and orange solid line(s) is a spacecraft slew end time.
- 6) Time of each bin is in the middle of the bin.
1 s binning
From T0-310 s to T0+310 s

From T100_start - 20 s to T100_end + 30 s

Full time interval

64 ms binning
Full time interval

From T100_start to T100_end

From T0-5 sec to T0+5 sec

16 ms binning
From T100_start-5 s to T100_start+5 s
8 ms binning
From T100_start-3 s to T100_start+3 s

2 ms binning
From T100_start-1 s to T100_start+1 s

SN=5 or 10 sec. binning (whichever binning is satisfied first)

SN=5 or 10 sec. binning (T < 200 sec)

Spectra
Notes:
- 1) The fitting includes the systematic errors.
- 2) For long bursts, a spectral fit of the pre-slew DRM will introduce some errors in both a spectral shape and a normalization if the PHA file contains a lot of the slew/post-slew time interval.
- 3) For fits to more complicated models (e.g. a power-law over a cutoff power-law), the BAT team has decided to require a chi-square improvement of more than 6 for each extra dof.
- 4) For short bursts (T90<1sec), the specrtum is also fit with Blackbody, OTTB, and Double Blackbody.
Time averaged spectrum fit using the pre-slew DRM
Power-law model

Time interval is from    0.000 sec. to   72.000 sec.

Spectral model in power-law:
------------------------------------------------------------
Parameters  : value       lower 90%   higher 90%
Photon index: 2.13358     ( -0.556702   0.636662 )
Norm@50keV  : 3.12298E-04    ( -0.000151238   0.000150921 )
------------------------------------------------------------
#Fit statistic : Chi-Squared =          61.82 using 59 PHA bins.
# Reduced chi-squared =          1.085 for     57 degrees of freedom
# Null hypothesis probability =   3.080665e-01

Photon flux (15-150 keV)    in 72 sec: 4.98622E-02 ( -0.0180153  0.0181097 ) ph/cm2/s
Energy fluence (15-150 keV)             : 2.05772e-07 ( -8.86442e-08  9.72446e-08 ) ergs/cm2
Cutoff power-law model

Time interval is from    0.000 sec. to   72.000 sec.
Spectral model in the cutoff power-law:
------------------------------------------------------------
Parameters  : value       lower 90%   higher 90%
Photon index: -3.35415     ( 4.09978   4.94241 )
Epeak [keV] : 31.2117      ( -6.36793 10.6835 )
Norm@50keV  : 1.53639    ( -1.50592   131940 )
------------------------------------------------------------
#Fit statistic : Chi-Squared =          55.35 using 59 PHA bins.
# Reduced chi-squared =         0.9884 for     56 degrees of freedom
# Null hypothesis probability =   4.993564e-01

Photon flux (15-150 keV)    in 72 sec: 5.06903E-02 ( -0.0161917  0.0166879 ) ph/cm2/s
Energy fluence (15-150 keV)             : 1.69936e-07 ( -6.13404e-08  7.22153e-08 ) ergs/cm2
Band function

Time interval is from    0.000 sec. to   72.000 sec.

Spectral model in the Band function:
------------------------------------------------------------
Parameters  : value       lower 90%   higher 90%
alpha       : 3.44555   ( -2.89667   -2.04306 )
beta        : -10.0000    ( 10   7.10543e-15 )
Epeak [keV] : 31.1322      ( -7.92043 9.72644 )
Norm@50keV   : 1.78819    ( -0.560813   18.3717 )
------------------------------------------------------------
#Fit statistic : Chi-Squared =          55.36 using 59 PHA bins.
# Reduced chi-squared =          1.006 for     55 degrees of freedom
# Null hypothesis probability =   4.611735e-01

Photon flux (15-150 keV)    in 72 sec:  (    ) ph/cm2/s
Energy fluence (15-150 keV)             : 0 ( 0  0 ) ergs/cm2
Single BB

Spectral model blackbody:
------------------------------------------------------------
Parameters  : value    Lower 90%  Upper 90%
kT [keV]    : 8.20200  (-2.04947  2.71482)
R^2/D10^2   : 5.93865E-02  (-0.0593865   0.121269)
(R is the radius in km and D10 is the distance to the source in units of 10 kpc)
------------------------------------------------------------
#Fit statistic : Chi-Squared =          55.69 using 59 PHA bins.
# Reduced chi-squared =         0.9770 for     57 degrees of freedom
# Null hypothesis probability =   5.243041e-01

Energy  Fluence     90% Error
[keV]   [erg/cm2]   [erg/cm2]
15- 25  5.295e-08   3.313e-08
25- 50  9.674e-08   5.990e-08
50-150  2.755e-08   2.224e-08
15-150  1.772e-07   1.066e-07
Thermal bremsstrahlung (OTTB)

Spectral model: thermal bremsstrahlung
------------------------------------------------------------
Parameters  : value         Lower 90%    Upper 90%
kT [keV]    : 39.8463       (-20.998      61.0003)
Norm        : 0.341979       (-0.148942     0.24869)
------------------------------------------------------------
#Fit statistic : Chi-Squared =          59.12 using 59 PHA bins.
# Reduced chi-squared =          1.037 for     57 degrees of freedom
# Null hypothesis probability =   3.980457e-01

Energy  Fluence     90% Error
[keV]   [erg/cm2]   [erg/cm2]
15- 25  5.647e-08   3.509e-08
25- 50  7.417e-08   4.525e-08
50-150  5.714e-08   5.036e-08
15-150  1.878e-07   1.269e-07
Double BB

Spectral model: bbodyrad<1> + bbodyrad<2>
------------------------------------------------------------
Parameters  : value         Lower 90%    Upper 90%
kT1 [keV]   : 8.04374        (-8.06803      -8.06803)
R1^2/D10^2  : 2.26467E-02        (-0.0228413      -0.0228413)
kT2 [keV]   : 8.32456        (-8.26385      -8.26385)
R2^2/D10^2  : 3.62555E-02    (-0.036397   -0.036397)
------------------------------------------------------------
#Fit statistic : Chi-Squared =          55.69 using 59 PHA bins.
# Reduced chi-squared =          1.013 for     55 degrees of freedom
# Null hypothesis probability =   4.485760e-01

Energy  Fluence     90% Error
[keV]   [erg/cm2]   [erg/cm2]
15- 25  5.279e-08   3.150e-02
25- 50  9.685e-08   2.730e-01
50-150  2.787e-08   6.584e+00
15-150  1.775e-07   6.948e+00
Peak spectrum fit
Power-law model

Time interval is from    0.000 sec. to   72.000 sec.

Spectral model in power-law:
------------------------------------------------------------
Parameters  : value       lower 90%   higher 90%
Photon index: 2.13358     ( -0.556702   0.636662 )
Norm@50keV  : 3.12298E-04    ( -0.000151238   0.000150921 )
------------------------------------------------------------
#Fit statistic : Chi-Squared =          61.82 using 59 PHA bins.
# Reduced chi-squared =          1.085 for     57 degrees of freedom
# Null hypothesis probability =   3.080665e-01

Photon flux (15-150 keV)    in 72 sec: 4.98622E-02 ( -0.0180153  0.0181097 ) ph/cm2/s
Energy fluence (15-150 keV)             : 2.05772e-07 ( -8.86442e-08  9.72446e-08 ) ergs/cm2
Cutoff power-law model

Time interval is from    0.000 sec. to   72.000 sec.
Spectral model in the cutoff power-law:
------------------------------------------------------------
Parameters  : value       lower 90%   higher 90%
Photon index: -3.35415     ( 4.09978   4.94241 )
Epeak [keV] : 31.2117      ( -6.36793 10.6835 )
Norm@50keV  : 1.53639    ( -1.50592   153756 )
------------------------------------------------------------
#Fit statistic : Chi-Squared =          55.35 using 59 PHA bins.
# Reduced chi-squared =         0.9884 for     56 degrees of freedom
# Null hypothesis probability =   4.993564e-01

Photon flux (15-150 keV)    in 72 sec: 5.06903E-02 ( -0.0161917  0.0166879 ) ph/cm2/s
Energy fluence (15-150 keV)             : 1.69936e-07 ( -6.13404e-08  7.22153e-08 ) ergs/cm2
Band function
Time interval is from    0.000 sec. to   72.000 sec.

Spectral model in the Band function:
------------------------------------------------------------
Parameters  : value       lower 90%   higher 90%
alpha       : 3.44555   ( -2.89667   -2.04306 )
beta        : -10.0000    ( 10   3.55271e-15 )
Epeak [keV] : 31.1322      ( -7.92043 9.72642 )
Norm@50keV   : 1.78819    ( -0.560813   18.3717 )
------------------------------------------------------------
#Fit statistic : Chi-Squared =          55.36 using 59 PHA bins.
# Reduced chi-squared =          1.006 for     55 degrees of freedom
# Null hypothesis probability =   4.611735e-01

Photon flux (15-150 keV)    in 72 sec:  (    ) ph/cm2/s
Energy fluence (15-150 keV)             : 0 ( 0  0 ) ergs/cm2
Single BB

Spectral model blackbody:
------------------------------------------------------------
Parameters  : value    Lower 90%  Upper 90%
kT [keV]    : 8.20200  (-2.04947  2.71482)
R^2/D10^2   : 5.93865E-02  (-0.0593865   0.121269)
(R is the radius in km and D10 is the distance to the source in units of 10 kpc)
------------------------------------------------------------
#Fit statistic : Chi-Squared =          55.69 using 59 PHA bins.
# Reduced chi-squared =         0.9770 for     57 degrees of freedom
# Null hypothesis probability =   5.243041e-01

Energy  Fluence     90% Error
[keV]   [erg/cm2]   [erg/cm2]
15- 25  5.295e-08   3.250e-08
25- 50  9.674e-08   5.918e-08
50-150  2.755e-08   2.355e-08
15-150  1.772e-07   1.128e-07
Thermal bremsstrahlung (OTTB)

Spectral model: thermal bremsstrahlung
------------------------------------------------------------
Parameters  : value         Lower 90%    Upper 90%
kT [keV]    : 39.8463       (-20.998      61.0003)
Norm        : 0.341979       (-0.148942     0.24869)
------------------------------------------------------------
#Fit statistic : Chi-Squared =          59.12 using 59 PHA bins.
# Reduced chi-squared =          1.037 for     57 degrees of freedom
# Null hypothesis probability =   3.980457e-01

Energy  Fluence     90% Error
[keV]   [erg/cm2]   [erg/cm2]
15- 25  5.647e-08   3.567e-08
25- 50  7.417e-08   4.925e-08
50-150  5.714e-08   5.044e-08
15-150  1.878e-07   1.281e-07
Double BB

Spectral model: bbodyrad<1> + bbodyrad<2>
------------------------------------------------------------
Parameters  : value         Lower 90%    Upper 90%
kT1 [keV]   : 8.04374        (-8.06803      -8.06803)
R1^2/D10^2  : 2.26467E-02        (-0.0228413      -0.0228413)
kT2 [keV]   : 8.32456        (-8.26385      -8.26385)
R2^2/D10^2  : 3.62555E-02    (-0.036397   -0.036397)
------------------------------------------------------------
#Fit statistic : Chi-Squared =          55.69 using 59 PHA bins.
# Reduced chi-squared =          1.013 for     55 degrees of freedom
# Null hypothesis probability =   4.485760e-01

Energy  Fluence     90% Error
[keV]   [erg/cm2]   [erg/cm2]
15- 25  5.279e-08   3.312e-02
25- 50  9.685e-08   2.542e-01
50-150  2.787e-08   6.631e+00
15-150  1.775e-07   7.610e+00
Pre-slew spectrum (Pre-slew PHA with pre-slew DRM)
Power-law model

Spectral model in power-law:
------------------------------------------------------------
Parameters  : value       lower 90%   higher 90%
Photon index: 2.13358     ( -0.556702   0.636662 )
Norm@50keV  : 3.12298E-04    ( -0.000151238   0.000150921 )
------------------------------------------------------------
#Fit statistic : Chi-Squared =          61.82 using 59 PHA bins.
# Reduced chi-squared =          1.085 for     57 degrees of freedom
# Null hypothesis probability =   3.080665e-01

Photon flux (15-150 keV)    in 72 sec: 4.98622E-02 ( -0.0180153  0.0181097 ) ph/cm2/s
Energy fluence (15-150 keV)             : 2.05772e-07 ( -8.86442e-08  9.72446e-08 ) ergs/cm2
Cutoff power-law model

Spectral model in the cutoff power-law:
------------------------------------------------------------
Parameters  : value       lower 90%   higher 90%
Photon index: -3.35415     ( 4.09978   4.94241 )
Epeak [keV] : 31.2117      ( -6.36793 10.6835 )
Norm@50keV  : 1.53639    ( -1.50592   143917 )
------------------------------------------------------------
#Fit statistic : Chi-Squared =          55.35 using 59 PHA bins.
# Reduced chi-squared =         0.9884 for     56 degrees of freedom
# Null hypothesis probability =   4.993564e-01

Photon flux (15-150 keV)    in 72 sec: 5.06903E-02 ( -0.0161917  0.0166879 ) ph/cm2/s
Energy fluence (15-150 keV)             : 1.69936e-07 ( -6.13404e-08  7.22153e-08 ) ergs/cm2
Band function

Spectral model in the Band function:
------------------------------------------------------------
Parameters  : value       lower 90%   higher 90%
alpha       : 3.44555   ( -2.89667   -2.04306 )
beta        : -10.0000    ( 10   5.32907e-15 )
Epeak [keV] : 31.1322      ( -7.92043 9.72642 )
Norm@50keV   : 1.78819    ( -0.560813   18.3717 )
------------------------------------------------------------
#Fit statistic : Chi-Squared =          55.36 using 59 PHA bins.
# Reduced chi-squared =          1.006 for     55 degrees of freedom
# Null hypothesis probability =   4.611735e-01

Photon flux (15-150 keV)    in 72 sec:  (    ) ph/cm2/s
Energy fluence (15-150 keV)             : 0 ( 0  0 ) ergs/cm2
S(25-50 keV) vs. S(50-100 keV) plot
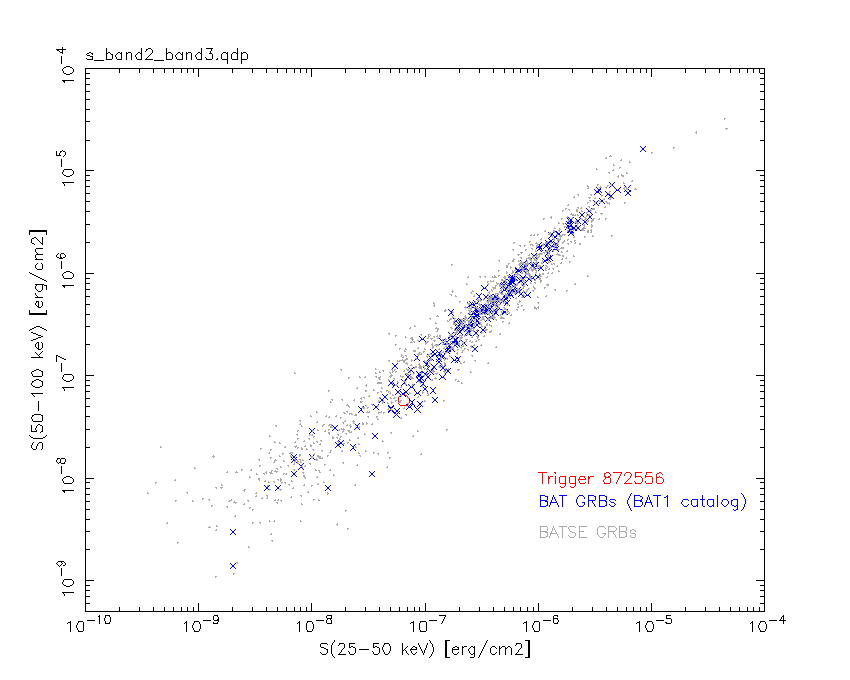
S(25-50 keV)  = 6.48e-08
S(50-100 keV) = 5.75e-08
T90 vs. Hardness ratio plot

T90                                   = 72 sec.
Hardness ratio (energy fluence ratio) = 0.887346
Color vs. Color plot

Count Ratio  (25-50 keV) / (15-25 keV) = 0.840776
Count Ratio (50-100 keV) / (15-25 keV) = 0.271961
Mask shadow pattern

IMX = 1.632343297035867E-02, IMY = 2.858774620636236E-02
TIME vs. PHA plot around the trigger time

TIME vs. DetID plot around the trigger time

100 us light curve (15-350 keV)

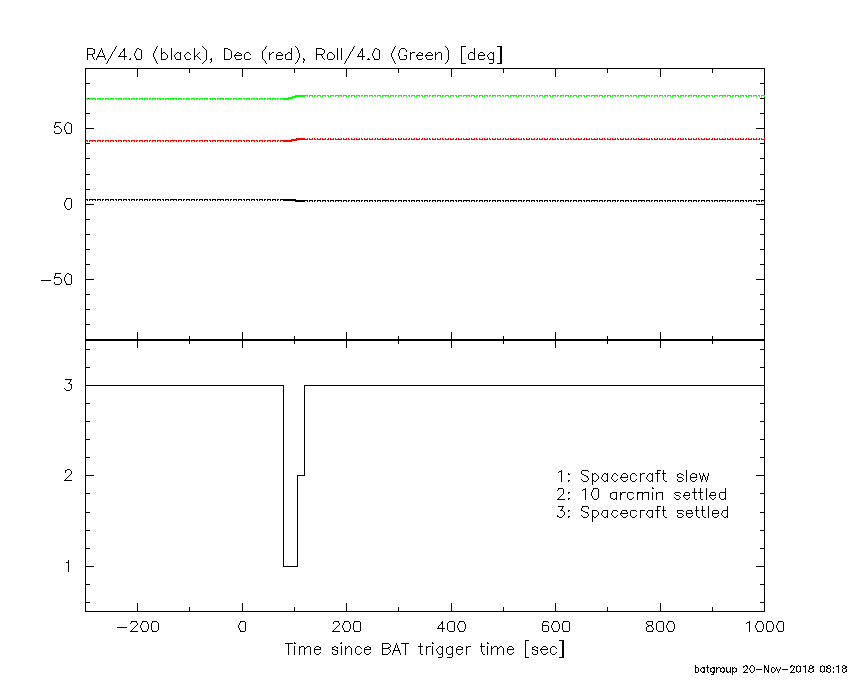
Spacecraft aspect plot
Bright source in the pre-burst/pre-slew/post-slew images
Pre-burst image of 15-350 keV band
Time interval of the image:
Pre-slew background subtracted image of 15-350 keV band
Time interval of the image:
0.000000 72.000000

# RAcent  DECcent POSerr Theta    Phi  PeakCts   SNR AngSep     Name
#  [deg]    [deg]    ['] [deg]  [deg]                   [']
326.1178  38.3966   23.9  34.4  -89.8  -0.1189  -0.5    5.2	Cyg X-2
Post-slew image of 15-350 keV band
Time interval of the image:
105.300600 261.540000
263.000000 266.660000
270.000000 270.260000
271.000000 963.067200

# RAcent  DECcent POSerr Theta    Phi  PeakCts   SNR AngSep     Name
#  [deg]    [deg]    ['] [deg]  [deg]                   [']
326.1501  38.3701    7.8  32.8 -100.5   1.8108   1.5    3.1	Cyg X-2
 31.2620   2.9425    2.5  44.6  130.8  12.5599   4.7 ------	UNKNOWN
351.5175  68.1188    4.2  26.8  -31.9   1.8009   2.8 ------	UNKNOWN
325.1384  10.5490    3.6  50.3 -134.0  13.6240   3.2 ------	UNKNOWN
Plot creation:
Tue Nov 20 08:20:42 EST 2018