Estimated redshift from machine learning (Ukwatta et al. 2016) - may take a few minute to calcaulte
Image
Pre-slew 15.0-350.0 keV image (Event data)
#   RAcent    DECcent   POSerr    Theta     Phi              Peak Cts       SNR   Name
  184.3543    14.6189   0.0157    27.6123    39.8172         0.1830854     12.212 TRIG_00873186

Foreground time interval of the image:
  0.032   0.312 (delta_t =   0.280 [sec])
Background time interval of the image:
-122.155   0.032 (delta_t = 122.187 [sec])
Lightcurves
Notes:
- 1) The mask-weighted light curves are using the flight position.
- 2) Multiple plots of different time binning/intervals are shown to cover all scenarios of short/long GRBs, rate/image triggers, and real/false positives.
- 3) For all the mask-weighted lightcurves, the y-axis units are counts/sec/det where a det is 0.4 x 0.4 = 0.16 sq cm.
- 4) The verticle lines correspond to following: green dotted lines are T50 interval, black dotted lines are T90 interval, blue solid line(s) is a spacecraft slew start time, and orange solid line(s) is a spacecraft slew end time.
- 5) Time of each bin is in the middle of the bin.
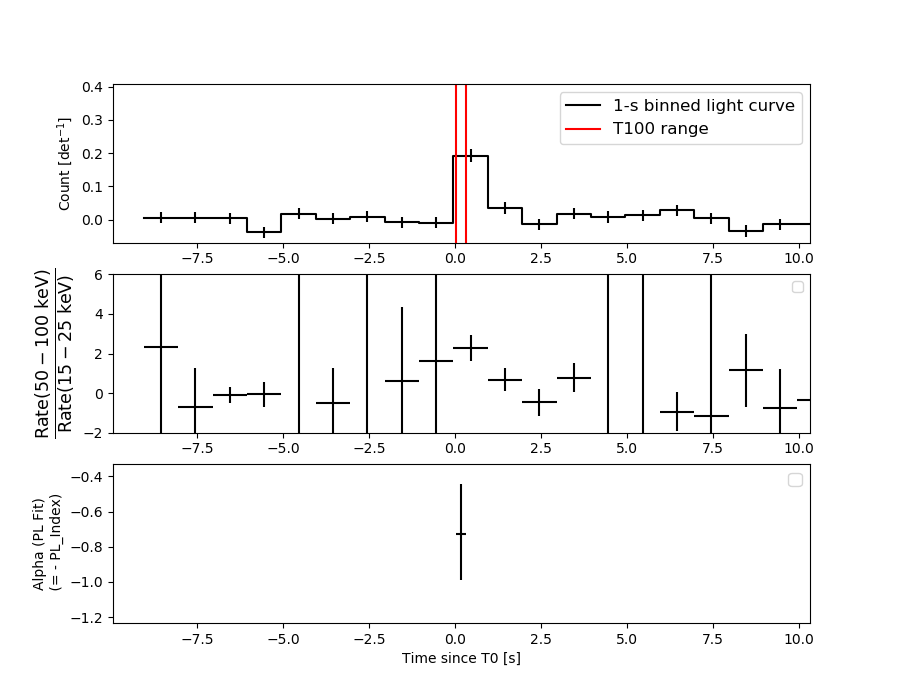
1 s binning
From T0-310 s to T0+310 s
From T100_start - 20 s to T100_end + 30 s
Full time interval
64 ms binning
Full time interval
From T100_start to T100_end

From T0-5 sec to T0+5 sec
16 ms binning
From T100_start-5 s to T100_start+5 s
Blue+Cyan dotted lines: Time interval of the scaled map
From 0.000000 to 0.256000
8 ms binning
From T100_start-3 s to T100_start+3 s
Blue+Cyan dotted lines: Time interval of the scaled map
From 0.000000 to 0.256000
2 ms binning
From T100_start-1 s to T100_start+1 s
Blue+Cyan dotted lines: Time interval of the scaled map
From 0.000000 to 0.256000
SN=5 or 10 sec. binning (whichever binning is satisfied first)

SN=5 or 10 sec. binning (T < 200 sec)
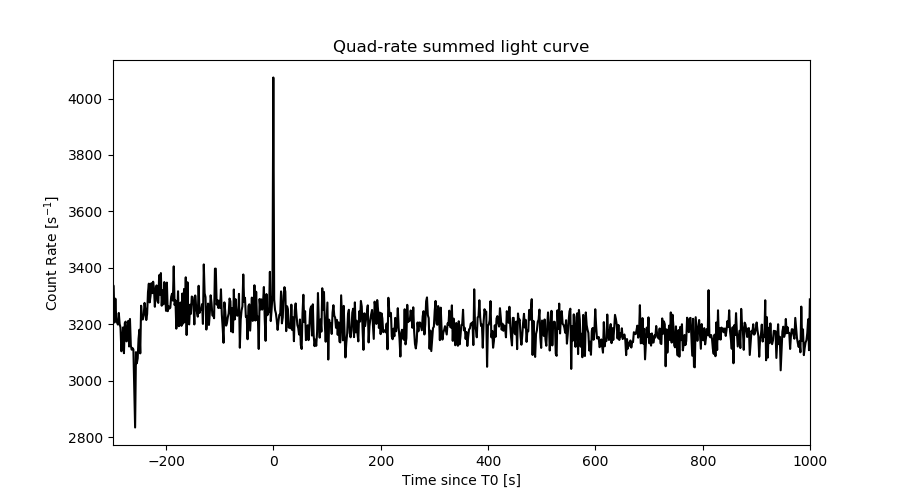
Quad-rate summed light curves (from T0-300s to T0+1000s)
Spectral Evolution
Spectra
Notes:
- 1) The fitting includes the systematic errors.
- 2) When the burst includes telescope slew time periods, the fitting uses an average response file made from multiple 5-s response files through out the slew time plus single time preiod for the non-slew times, and weighted by the total counts in the corresponding time period using addrmf. An average response file is needed becuase a spectral fit using the pre-slew DRM will introduce some errors in both a spectral shape and a normalization if the PHA file contains a lot of the slew/post-slew time interval.
- 3) For fits to more complicated models (e.g. a power-law over a cutoff power-law), the BAT team has decided to require a chi-square improvement of more than 6 for each extra dof.
Time averaged spectrum fit using the average DRM
Power-law model
Time interval is from    0.032 sec. to    0.312 sec.

Spectral model in power-law:
------------------------------------------------------------
Parameters  : value       lower 90%   higher 90%
Photon index: 0.725109     ( -0.281845   0.261278 )
Norm@50keV  : 3.74583E-02    ( -0.00584652   0.00570429 )
------------------------------------------------------------
#Fit statistic : Chi-Squared =          69.84 using 59 PHA bins.
# Reduced chi-squared =          1.225 for     57 degrees of freedom
# Null hypothesis probability =   1.181940e-01

Photon flux (15-150 keV)    in 0.28 sec: 0.256607 ( -0.015751  0.247746 ) ph/cm2/s
Energy fluence (15-150 keV)             : 1.26607e-07 ( -1.95937e-08  1.96841e-08 ) ergs/cm2
Cutoff power-law model
Time interval is from    0.032 sec. to    0.312 sec.
Spectral model in the cutoff power-law:
------------------------------------------------------------
Parameters  : value       lower 90%   higher 90%
Photon index: 0.724557     ( -0.290131   0.257696 )
Epeak [keV] : 9999.36      ( -9999.36 -9999.36 )
Norm@50keV  : 3.77610E-02    ( -0.00544956   0.0440086 )
------------------------------------------------------------
#Fit statistic : Chi-Squared =          69.85 using 59 PHA bins.
# Reduced chi-squared =          1.247 for     56 degrees of freedom
# Null hypothesis probability =   1.009463e-01

Photon flux (15-150 keV)    in 0.28 sec: 4.32078 ( -0.63818  0.63947 ) ph/cm2/s
Energy fluence (15-150 keV)             : 1.27212e-07 ( -2.69313e-08  2.58254e-08 ) ergs/cm2
Band function

Time interval is from    0.032 sec. to    0.312 sec.


Spectral model in the Band function:
------------------------------------------------------------
Parameters  : value       lower 90%   higher 90%
alpha       :    (     )
beta        :     (     )
Epeak [keV] :       (   )
Norm@50keV   :     (     )
------------------------------------------------------------

Photon flux (15-150 keV)    in  sec:  (    ) ph/cm2/s
Energy fluence (15-150 keV)             : 0 ( 0  0 ) ergs/cm2
Single BB
Spectral model blackbody:
------------------------------------------------------------
Parameters  : value    Lower 90%  Upper 90%
kT [keV]    : 29.5170  (-6.25537  9.31385)
R^2/D10^2   : 6.81933E-02  (-0.0359016   0.0675952)
(R is the radius in km and D10 is the distance to the source in units of 10 kpc)
------------------------------------------------------------
#Fit statistic : Chi-Squared =          78.92 using 59 PHA bins.
# Reduced chi-squared =          1.385 for     57 degrees of freedom
# Null hypothesis probability =   2.890606e-02

Energy  Fluence     90% Error
[keV]   [erg/cm2]   [erg/cm2]
15- 25  2.629e-09   8.691e-10
25- 50  1.611e-08   5.411e-09
50-150  9.973e-08   2.898e-08
15-150  1.185e-07   3.293e-08
Thermal bremsstrahlung (OTTB)
Spectral model: thermal bremsstrahlung
------------------------------------------------------------
Parameters  : value         Lower 90%    Upper 90%
kT [keV]    : 200.000       (-30.6925      -200)
Norm        : 16.2895       (-2.6153     2.6153)
------------------------------------------------------------
#Fit statistic : Chi-Squared =          96.13 using 59 PHA bins.
# Reduced chi-squared =          1.687 for     57 degrees of freedom
# Null hypothesis probability =   9.179409e-04

Energy  Fluence     90% Error
[keV]   [erg/cm2]   [erg/cm2]
15- 25  1.146e-08   6.644e-09
25- 50  2.204e-08   1.274e-08
50-150  4.833e-08   2.730e-08
15-150  8.182e-08   4.665e-08
Double BB
Spectral model: bbodyrad<1> + bbodyrad<2>
------------------------------------------------------------
Parameters  : value         Lower 90%    Upper 90%
kT1 [keV]   : 8.67309        (-3.86317      6.07452)
R1^2/D10^2  : 1.39643        (-1.09947      5.03536)
kT2 [keV]   : 48.1253        (-16.8141      -48.0512)
R2^2/D10^2  : 1.62810E-02    (-0.0128987   0.0373649)
------------------------------------------------------------
#Fit statistic : Chi-Squared =          68.94 using 59 PHA bins.
# Reduced chi-squared =          1.253 for     55 degrees of freedom
# Null hypothesis probability =   9.794895e-02

Energy  Fluence     90% Error
[keV]   [erg/cm2]   [erg/cm2]
15- 25  6.798e-09   4.140e-09
25- 50  1.975e-08   1.087e-08
50-150  1.039e-07   5.628e-08
15-150  1.304e-07   6.880e-08
Peak spectrum fit
Power-law model
Time interval is from   -0.326 sec. to    0.674 sec.

Spectral model in power-law:
------------------------------------------------------------
Parameters  : value       lower 90%   higher 90%
Photon index: 0.626628     ( -0.400055   0.354642 )
Norm@50keV  : 1.13190E-02    ( -0.0025281   0.00237669 )
------------------------------------------------------------
#Fit statistic : Chi-Squared =          64.49 using 59 PHA bins.
# Reduced chi-squared =          1.131 for     57 degrees of freedom
# Null hypothesis probability =   2.312798e-01

Photon flux (15-150 keV)    in 1 sec: 1.31747 ( -0.25615  0.25868 ) ph/cm2/s
Energy fluence (15-150 keV)             : 1.42939e-07 ( -2.67754e-08  2.68267e-08 ) ergs/cm2
Cutoff power-law model

Time interval is from   -0.326 sec. to    0.674 sec.
Spectral model in the cutoff power-law:
------------------------------------------------------------
Parameters  : value       lower 90%   higher 90%
Photon index: 0.617080     ( -1.32707   0.454269 )
Epeak [keV] : 1.00000E+04      ( -10000 -10000 )
Norm@50keV  : 1.14069E-02    ( -0.00253912   -0.0114079 )
------------------------------------------------------------
#Fit statistic : Chi-Squared =          64.50 using 59 PHA bins.
# Reduced chi-squared =          1.152 for     56 degrees of freedom
# Null hypothesis probability =   2.038807e-01

Photon flux (15-150 keV)    in 1 sec: 1.32008 ( -0.26079  0.25319 ) ph/cm2/s
Energy fluence (15-150 keV)             : 1.43113e-07 ( 0  0 ) ergs/cm2
Band function

Time interval is from   -0.326 sec. to    0.674 sec.


Spectral model in the Band function:
------------------------------------------------------------
Parameters  : value       lower 90%   higher 90%
alpha       :    (     )
beta        :     (     )
Epeak [keV] :       (   )
Norm@50keV   :     (     )
------------------------------------------------------------

Photon flux (15-150 keV)    in  sec:  (    ) ph/cm2/s
Energy fluence (15-150 keV)             : 0 ( 0  0 ) ergs/cm2
Single BB
Spectral model blackbody:
------------------------------------------------------------
Parameters  : value    Lower 90%  Upper 90%
kT [keV]    : 34.2366  (-8.74078  15.8612)
R^2/D10^2   : 1.41183E-02  (-0.0087546   0.0182537)
(R is the radius in km and D10 is the distance to the source in units of 10 kpc)
------------------------------------------------------------
#Fit statistic : Chi-Squared =          68.39 using 59 PHA bins.
# Reduced chi-squared =          1.200 for     57 degrees of freedom
# Null hypothesis probability =   1.435118e-01

Energy  Fluence     90% Error
[keV]   [erg/cm2]   [erg/cm2]
15- 25  2.379e-09   1.217e-09
25- 50  1.543e-08   7.192e-09
50-150  1.199e-07   5.239e-08
15-150  1.377e-07   5.524e-08
Thermal bremsstrahlung (OTTB)
Spectral model: thermal bremsstrahlung
------------------------------------------------------------
Parameters  : value         Lower 90%    Upper 90%
kT [keV]    : 200.000       (-42.1633      -200)
Norm        : 5.28107       (-1.07755     1.07755)
------------------------------------------------------------
#Fit statistic : Chi-Squared =          83.69 using 59 PHA bins.
# Reduced chi-squared =          1.468 for     57 degrees of freedom
# Null hypothesis probability =   1.219673e-02

Energy  Fluence     90% Error
[keV]   [erg/cm2]   [erg/cm2]
15- 25  1.316e-08   7.745e-09
25- 50  2.531e-08   1.510e-08
50-150  5.552e-08   3.163e-08
15-150  9.399e-08   5.345e-08
Double BB

Spectral model: bbodyrad<1> + bbodyrad<2>
------------------------------------------------------------
Parameters  : value         Lower 90%    Upper 90%
kT1 [keV]   : 5.21262        (-3.52526      7.64909)
R1^2/D10^2  : 2.39308        (-2.32801      1520.91)
kT2 [keV]   : 41.4091        (-12.7136      69.8771)
R2^2/D10^2  : 8.18014E-03    (-0.00677835   0.007329)
------------------------------------------------------------
#Fit statistic : Chi-Squared =          63.45 using 59 PHA bins.
# Reduced chi-squared =          1.154 for     55 degrees of freedom
# Null hypothesis probability =   2.029837e-01

Energy  Fluence     90% Error
[keV]   [erg/cm2]   [erg/cm2]
15- 25  8.620e-09   5.437e-09
25- 50  1.712e-08   8.635e-09
50-150  1.215e-07   6.715e-08
15-150  1.472e-07   7.459e-08
Pre-slew spectrum (Pre-slew PHA with pre-slew DRM)
Power-law model

Spectral model in power-law:
------------------------------------------------------------
Parameters  : value       lower 90%   higher 90%
Photon index: 0.725109     ( -0.281845   0.261278 )
Norm@50keV  : 3.74583E-02    ( -0.00584652   0.00570429 )
------------------------------------------------------------
#Fit statistic : Chi-Squared =          69.84 using 59 PHA bins.
# Reduced chi-squared =          1.225 for     57 degrees of freedom
# Null hypothesis probability =   1.181940e-01

Photon flux (15-150 keV)    in 0.28 sec: 4.32185 ( -0.638204  0.640146 ) ph/cm2/s
Energy fluence (15-150 keV)             : 1.26595e-07 ( -1.95909e-08  1.97221e-08 ) ergs/cm2
Cutoff power-law model

Spectral model in the cutoff power-law:
------------------------------------------------------------
Parameters  : value       lower 90%   higher 90%
Photon index: 0.717265     ( -0.811507   0.352226 )
Epeak [keV] : 9999.33      ( -9999.34 -9999.34 )
Norm@50keV  : 3.77428E-02    ( -0.0054593   0.0439819 )
------------------------------------------------------------
#Fit statistic : Chi-Squared =          69.85 using 59 PHA bins.
# Reduced chi-squared =          1.247 for     56 degrees of freedom
# Null hypothesis probability =   1.009765e-01

Photon flux (15-150 keV)    in 0.28 sec: 4.32712 ( -0.64479  0.63365 ) ph/cm2/s
Energy fluence (15-150 keV)             : 1.26355e-07 ( -1.93295e-08  1.98632e-08 ) ergs/cm2
Band function
Spectral model in the Band function:
------------------------------------------------------------
Parameters  : value       lower 90%   higher 90%
alpha       :    (     )
beta        :     (     )
Epeak [keV] :       (   )
Norm@50keV   :     (     )
------------------------------------------------------------

Photon flux (15-150 keV)    in  sec:  (    ) ph/cm2/s
Energy fluence (15-150 keV)             : 0 ( 0  0 ) ergs/cm2
S(25-50 keV) vs. S(50-100 keV) plot
S(25-50 keV)  = 1.93e-08
S(50-100 keV) = 4.68e-08
T90 vs. Hardness ratio plot

T90                                   = 0.259999990463257 sec.
Hardness ratio (energy fluence ratio) = 2.42487
Color vs. Color plot
Count Ratio  (25-50 keV) / (15-25 keV) = 1.81571
Count Ratio (50-100 keV) / (15-25 keV) = 2.63281
Mask shadow pattern

IMX = 4.017588232730953E-01, IMY = -3.349367848319640E-01
TIME vs. PHA plot around the trigger time

Blue+Cyan dotted lines: Time interval of the scaled map
From 0.000000 to 0.256000
TIME vs. DetID plot around the trigger time
Blue+Cyan dotted lines: Time interval of the scaled map
From 0.000000 to 0.256000
100 us light curve (15-350 keV)
Blue+Cyan dotted lines: Time interval of the scaled map
From 0.000000 to 0.256000
Spacecraft aspect plot
Bright source in the pre-burst/pre-slew/post-slew images
Pre-burst image of 15-350 keV band
Time interval of the image:
-122.155400 0.032000

# RAcent  DECcent POSerr Theta    Phi  PeakCts   SNR AngSep     Name
#  [deg]    [deg]    ['] [deg]  [deg]                   [']
254.5605  35.5261    0.0  39.8 -166.1   0.3348   1.4   12.1	Her X-1
185.6473  -5.3063    3.7  36.6    5.6   0.6810   3.1 ------	UNKNOWN
196.7091 -15.9454    2.8  39.1  -18.9   0.8797   4.1 ------	UNKNOWN
193.9321 -29.2157    2.3  52.3  -23.0   2.0046   5.0 ------	UNKNOWN
267.9288  16.2539    3.2  52.3 -139.6   3.1183   3.6 ------	UNKNOWN
Pre-slew background subtracted image of 15-350 keV band
Time interval of the image:
0.032000 0.312000

# RAcent  DECcent POSerr Theta    Phi  PeakCts   SNR AngSep     Name
#  [deg]    [deg]    ['] [deg]  [deg]                   [']
254.6417  35.2931    5.3  39.9 -165.7   0.0349   2.2    9.5	Her X-1
184.3543  14.6189    0.9  27.6   39.8   0.1831  12.2 ------	UNKNOWN
207.2522  -8.5413    3.0  28.8  -32.5   0.0410   3.8 ------	UNKNOWN
Post-slew image of 15-350 keV band
Time interval of the image:
64.044620 963.006000

# RAcent  DECcent POSerr Theta    Phi  PeakCts   SNR AngSep     Name
#  [deg]    [deg]    ['] [deg]  [deg]                   [']
137.5021  -4.3417    4.4  50.1   39.7   8.1548   2.6 ------	UNKNOWN
154.5607  37.9249    2.7  35.2  105.5   6.9029   4.2 ------	UNKNOWN
168.1370  45.8088    3.2  34.1  128.0   4.8137   3.6 ------	UNKNOWN
221.2797  48.8135    3.0  45.7 -178.1   5.3089   3.9 ------	UNKNOWN
190.4405  12.9755    2.3   6.1 -107.2   3.1049   5.1 ------	UNKNOWN
236.8534  18.7033    3.4  50.3 -134.1  11.6306   3.4 ------	UNKNOWN
Plot creation:
Mon Dec 17 21:08:22 EST 2018