Estimated redshift from machine learning (Ukwatta et al. 2016) - may take a few minute to calcaulte
Image
Pre-slew 15.0-350.0 keV image (Event data)
#   RAcent    DECcent   POSerr    Theta     Phi              Peak Cts       SNR   Name
  152.3497   -29.6979   0.0117    26.9457  -128.5901         0.4741824     16.455 TRIG_00873539

Foreground time interval of the image:
 -0.068   2.164 (delta_t =   2.232 [sec])
Background time interval of the image:
-239.080  -0.068 (delta_t = 239.012 [sec])
Lightcurves
Notes:
- 1) The mask-weighted light curves are using the flight position.
- 2) Multiple plots of different time binning/intervals are shown to cover all scenarios of short/long GRBs, rate/image triggers, and real/false positives.
- 3) For all the mask-weighted lightcurves, the y-axis units are counts/sec/det where a det is 0.4 x 0.4 = 0.16 sq cm.
- 4) The verticle lines correspond to following: green dotted lines are T50 interval, black dotted lines are T90 interval, blue solid line(s) is a spacecraft slew start time, and orange solid line(s) is a spacecraft slew end time.
- 5) Time of each bin is in the middle of the bin.
1 s binning
From T0-310 s to T0+310 s
From T100_start - 20 s to T100_end + 30 s
Full time interval
64 ms binning
Full time interval

From T100_start to T100_end

From T0-5 sec to T0+5 sec
16 ms binning
From T100_start-5 s to T100_start+5 s
Blue+Cyan dotted lines: Time interval of the scaled map
From 0.000000 to 0.256000
8 ms binning
From T100_start-3 s to T100_start+3 s
Blue+Cyan dotted lines: Time interval of the scaled map
From 0.000000 to 0.256000
2 ms binning
From T100_start-1 s to T100_start+1 s
Blue+Cyan dotted lines: Time interval of the scaled map
From 0.000000 to 0.256000
SN=5 or 10 sec. binning (whichever binning is satisfied first)

SN=5 or 10 sec. binning (T < 200 sec)
Quad-rate summed light curves (from T0-300s to T0+1000s)

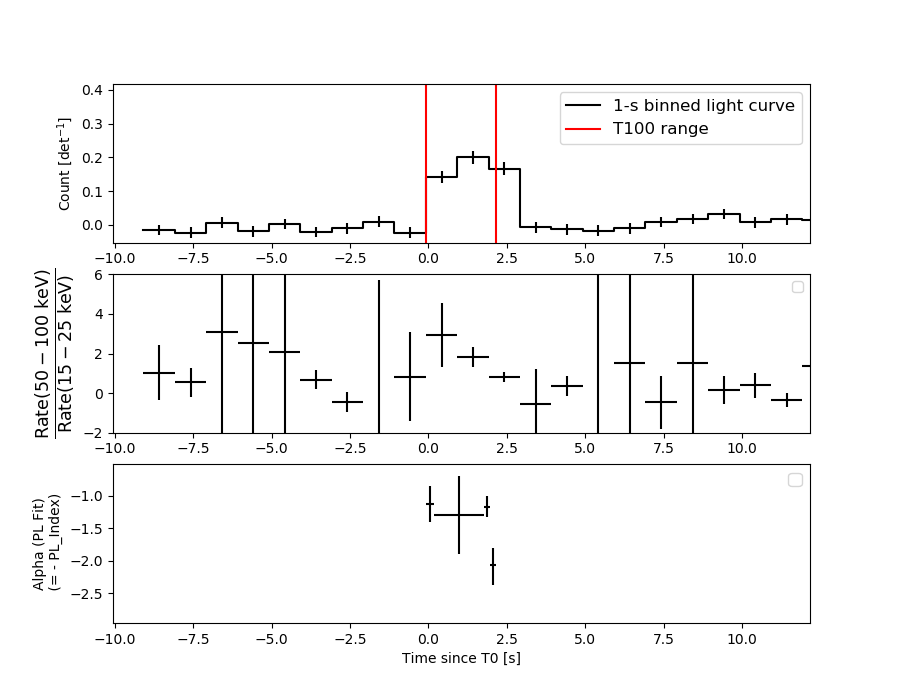
Spectral Evolution
Spectra
Notes:
- 1) The fitting includes the systematic errors.
- 2) When the burst includes telescope slew time periods, the fitting uses an average response file made from multiple 5-s response files through out the slew time plus single time preiod for the non-slew times, and weighted by the total counts in the corresponding time period using addrmf. An average response file is needed becuase a spectral fit using the pre-slew DRM will introduce some errors in both a spectral shape and a normalization if the PHA file contains a lot of the slew/post-slew time interval.
- 3) For fits to more complicated models (e.g. a power-law over a cutoff power-law), the BAT team has decided to require a chi-square improvement of more than 6 for each extra dof.
Time averaged spectrum fit using the average DRM
Power-law model
Time interval is from   -0.068 sec. to    2.164 sec.

Spectral model in power-law:
------------------------------------------------------------
Parameters  : value       lower 90%   higher 90%
Photon index: 1.21521     ( -0.152198   0.150504 )
Norm@50keV  : 1.45134E-02    ( -0.0014126   0.00141258 )
------------------------------------------------------------
#Fit statistic : Chi-Squared =          79.72 using 59 PHA bins.
# Reduced chi-squared =          1.399 for     57 degrees of freedom
# Null hypothesis probability =   2.513459e-02

Photon flux (15-150 keV)    in 2.232 sec: 1.70732 ( -0.16993  0.17019 ) ph/cm2/s
Energy fluence (15-150 keV)             : 3.27298e-07 ( -3.46578e-08  3.48565e-08 ) ergs/cm2
Cutoff power-law model
Time interval is from   -0.068 sec. to    2.164 sec.
Spectral model in the cutoff power-law:
------------------------------------------------------------
Parameters  : value       lower 90%   higher 90%
Photon index: -0.132922     ( -0.811265   0.683521 )
Epeak [keV] : 83.8271      ( -14.8847 33.6126 )
Norm@50keV  : 6.45312E-02    ( -0.0335391   0.0880291 )
------------------------------------------------------------
#Fit statistic : Chi-Squared =          66.66 using 59 PHA bins.
# Reduced chi-squared =          1.190 for     56 degrees of freedom
# Null hypothesis probability =   1.558057e-01

Photon flux (15-150 keV)    in 2.232 sec: 1.64173 ( -0.17298  0.17336 ) ph/cm2/s
Energy fluence (15-150 keV)             : 3.05902e-07 ( -3.66965e-08  3.69871e-08 ) ergs/cm2
Band function

Time interval is from   -0.068 sec. to    2.164 sec.


Spectral model in the Band function:
------------------------------------------------------------
Parameters  : value       lower 90%   higher 90%
alpha       :    (     )
beta        :     (     )
Epeak [keV] :       (   )
Norm@50keV   :     (     )
------------------------------------------------------------

Photon flux (15-150 keV)    in  sec:  (    ) ph/cm2/s
Energy fluence (15-150 keV)             : 0 ( 0  0 ) ergs/cm2
Single BB
Spectral model blackbody:
------------------------------------------------------------
Parameters  : value    Lower 90%  Upper 90%
kT [keV]    : 17.9527  (-1.93566  2.21324)
R^2/D10^2   : 0.118192  (-0.0384136   0.0554668)
(R is the radius in km and D10 is the distance to the source in units of 10 kpc)
------------------------------------------------------------
#Fit statistic : Chi-Squared =          73.34 using 59 PHA bins.
# Reduced chi-squared =          1.287 for     57 degrees of freedom
# Null hypothesis probability =   7.138345e-02

Energy  Fluence     90% Error
[keV]   [erg/cm2]   [erg/cm2]
15- 25  1.704e-08   3.597e-09
25- 50  7.864e-08   1.128e-08
50-150  1.839e-07   3.023e-08
15-150  2.795e-07   3.381e-08
Thermal bremsstrahlung (OTTB)
Spectral model: thermal bremsstrahlung
------------------------------------------------------------
Parameters  : value         Lower 90%    Upper 90%
kT [keV]    : 200.000       (-25.5997      -200)
Norm        : 7.09324       (-0.700485     0.700485)
------------------------------------------------------------
#Fit statistic : Chi-Squared =          87.82 using 59 PHA bins.
# Reduced chi-squared =          1.541 for     57 degrees of freedom
# Null hypothesis probability =   5.437765e-03

Energy  Fluence     90% Error
[keV]   [erg/cm2]   [erg/cm2]
15- 25  3.942e-08   1.602e-08
25- 50  7.582e-08   2.990e-08
50-150  1.663e-07   8.968e-08
15-150  2.815e-07   1.165e-07
Double BB

Spectral model: bbodyrad<1> + bbodyrad<2>
------------------------------------------------------------
Parameters  : value         Lower 90%    Upper 90%
kT1 [keV]   : 9.45040        (-3.36663      4.18174)
R1^2/D10^2  : 0.451380        (-0.27287      0.915254)
kT2 [keV]   : 25.4530        (-19.339      16.9585)
R2^2/D10^2  : 2.75066E-02    (-0.0236975   0.0502466)
------------------------------------------------------------
#Fit statistic : Chi-Squared =          65.01 using 59 PHA bins.
# Reduced chi-squared =          1.182 for     55 degrees of freedom
# Null hypothesis probability =   1.672647e-01

Energy  Fluence     90% Error
[keV]   [erg/cm2]   [erg/cm2]
15- 25  2.477e-08   1.363e-08
25- 50  8.024e-08   4.212e-08
50-150  2.058e-07   1.090e-07
15-150  3.109e-07   1.588e-07
Peak spectrum fit
Power-law model

Time interval is from    1.218 sec. to    2.218 sec.

Spectral model in power-law:
------------------------------------------------------------
Parameters  : value       lower 90%   higher 90%
Photon index: 1.31996     ( -0.164126   0.164615 )
Norm@50keV  : 2.27417E-02    ( -0.0023532   0.00235041 )
------------------------------------------------------------
#Fit statistic : Chi-Squared =          53.43 using 59 PHA bins.
# Reduced chi-squared =         0.9374 for     57 degrees of freedom
# Null hypothesis probability =   6.096529e-01

Photon flux (15-150 keV)    in 1 sec: 2.72340 ( -0.28488  0.28514 ) ph/cm2/s
Energy fluence (15-150 keV)             : 2.23681e-07 ( -2.55009e-08  2.56407e-08 ) ergs/cm2
Cutoff power-law model
Time interval is from    1.218 sec. to    2.218 sec.
Spectral model in the cutoff power-law:
------------------------------------------------------------
Parameters  : value       lower 90%   higher 90%
Photon index: 0.651049     ( -0.733701   0.628676 )
Epeak [keV] : 106.731      ( -32.295 524.096 )
Norm@50keV  : 4.82578E-02    ( -0.0240064   0.0586988 )
------------------------------------------------------------
#Fit statistic : Chi-Squared =          50.08 using 59 PHA bins.
# Reduced chi-squared =         0.8943 for     56 degrees of freedom
# Null hypothesis probability =   6.973137e-01

Photon flux (15-150 keV)    in 1 sec: 2.67826 ( -0.28897  0.28884 ) ph/cm2/s
Energy fluence (15-150 keV)             : 2.17305e-07 ( -2.68774e-08  2.67738e-08 ) ergs/cm2
Band function

Time interval is from    1.218 sec. to    2.218 sec.


Spectral model in the Band function:
------------------------------------------------------------
Parameters  : value       lower 90%   higher 90%
alpha       :    (     )
beta        :     (     )
Epeak [keV] :       (   )
Norm@50keV   :     (     )
------------------------------------------------------------

Photon flux (15-150 keV)    in  sec:  (    ) ph/cm2/s
Energy fluence (15-150 keV)             : 0 ( 0  0 ) ergs/cm2
Single BB
Spectral model blackbody:
------------------------------------------------------------
Parameters  : value    Lower 90%  Upper 90%
kT [keV]    : 17.2949  (-2.2168  2.56112)
R^2/D10^2   : 0.204271  (-0.0760473   0.120257)
(R is the radius in km and D10 is the distance to the source in units of 10 kpc)
------------------------------------------------------------
#Fit statistic : Chi-Squared =          66.33 using 59 PHA bins.
# Reduced chi-squared =          1.164 for     57 degrees of freedom
# Null hypothesis probability =   1.861184e-01

Energy  Fluence     90% Error
[keV]   [erg/cm2]   [erg/cm2]
15- 25  1.238e-08   2.567e-09
25- 50  5.554e-08   9.390e-09
50-150  1.193e-07   2.338e-08
15-150  1.872e-07   2.495e-08
Thermal bremsstrahlung (OTTB)
Spectral model: thermal bremsstrahlung
------------------------------------------------------------
Parameters  : value         Lower 90%    Upper 90%
kT [keV]    : 200.000       (-35.5269      -200)
Norm        : 11.2895       (-1.16769     1.16769)
------------------------------------------------------------
#Fit statistic : Chi-Squared =          56.75 using 59 PHA bins.
# Reduced chi-squared =         0.9955 for     57 degrees of freedom
# Null hypothesis probability =   4.845958e-01

Energy  Fluence     90% Error
[keV]   [erg/cm2]   [erg/cm2]
15- 25  2.812e-08   1.533e-08
25- 50  5.409e-08   2.081e-08
50-150  1.186e-07   6.445e-08
15-150  2.008e-07   9.879e-08
Double BB

Spectral model: bbodyrad<1> + bbodyrad<2>
------------------------------------------------------------
Parameters  : value         Lower 90%    Upper 90%
kT1 [keV]   : 7.77203        (-2.46656      3.04088)
R1^2/D10^2  : 1.63090        (-1.00165      3.99537)
kT2 [keV]   : 26.9360        (-6.04997      13.5688)
R2^2/D10^2  : 3.61676E-02    (-0.0276882   0.0574738)
------------------------------------------------------------
#Fit statistic : Chi-Squared =          48.75 using 59 PHA bins.
# Reduced chi-squared =         0.8863 for     55 degrees of freedom
# Null hypothesis probability =   7.108940e-01

Energy  Fluence     90% Error
[keV]   [erg/cm2]   [erg/cm2]
15- 25  2.180e-08   1.129e-08
25- 50  5.473e-08   2.470e-08
50-150  1.434e-07   7.475e-08
15-150  2.200e-07   9.953e-08
Pre-slew spectrum (Pre-slew PHA with pre-slew DRM)
Power-law model

Spectral model in power-law:
------------------------------------------------------------
Parameters  : value       lower 90%   higher 90%
Photon index: 1.21521     ( -0.152198   0.150504 )
Norm@50keV  : 1.45134E-02    ( -0.0014126   0.00141258 )
------------------------------------------------------------
#Fit statistic : Chi-Squared =          79.72 using 59 PHA bins.
# Reduced chi-squared =          1.399 for     57 degrees of freedom
# Null hypothesis probability =   2.513459e-02

Photon flux (15-150 keV)    in 2.232 sec: 1.70731 ( -0.169923  0.170189 ) ph/cm2/s
Energy fluence (15-150 keV)             : 3.27256e-07 ( -3.46462e-08  3.48667e-08 ) ergs/cm2
Cutoff power-law model

Spectral model in the cutoff power-law:
------------------------------------------------------------
Parameters  : value       lower 90%   higher 90%
Photon index: -0.132922     ( -0.811265   0.683521 )
Epeak [keV] : 83.8271      ( -14.8847 33.6126 )
Norm@50keV  : 6.45313E-02    ( -0.0335391   0.0880291 )
------------------------------------------------------------
#Fit statistic : Chi-Squared =          66.66 using 59 PHA bins.
# Reduced chi-squared =          1.190 for     56 degrees of freedom
# Null hypothesis probability =   1.558057e-01

Photon flux (15-150 keV)    in 2.232 sec: 1.64167 ( -0.17296  0.17334 ) ph/cm2/s
Energy fluence (15-150 keV)             : 3.06034e-07 ( -3.67186e-08  3.70133e-08 ) ergs/cm2
Band function
Spectral model in the Band function:
------------------------------------------------------------
Parameters  : value       lower 90%   higher 90%
alpha       :    (     )
beta        :     (     )
Epeak [keV] :       (   )
Norm@50keV   :     (     )
------------------------------------------------------------

Photon flux (15-150 keV)    in  sec:  (    ) ph/cm2/s
Energy fluence (15-150 keV)             : 0 ( 0  0 ) ergs/cm2
S(25-50 keV) vs. S(50-100 keV) plot
S(25-50 keV)  = 6.94e-08
S(50-100 keV) = 1.19e-07
T90 vs. Hardness ratio plot
T90                                   = 2.09200000762939 sec.
Hardness ratio (energy fluence ratio) = 1.7147
Color vs. Color plot
Count Ratio  (25-50 keV) / (15-25 keV) = 2.10567
Count Ratio (50-100 keV) / (15-25 keV) = 1.85417
Mask shadow pattern

IMX = -3.170698041507865E-01, IMY = 3.973272113535748E-01
TIME vs. PHA plot around the trigger time
Blue+Cyan dotted lines: Time interval of the scaled map
From 0.000000 to 0.256000
TIME vs. DetID plot around the trigger time
Blue+Cyan dotted lines: Time interval of the scaled map
From 0.000000 to 0.256000
100 us light curve (15-350 keV)

Blue+Cyan dotted lines: Time interval of the scaled map
From 0.000000 to 0.256000
Spacecraft aspect plot
Bright source in the pre-burst/pre-slew/post-slew images
Pre-burst image of 15-350 keV band
Time interval of the image:
-239.080000 -0.068000

# RAcent  DECcent POSerr Theta    Phi  PeakCts   SNR AngSep     Name
#  [deg]    [deg]    ['] [deg]  [deg]                   [']
135.5122 -40.5304    1.1  14.0  -92.7   2.6437  10.2    1.6	Vela X-1
 73.0226 -30.4540    3.2  40.5   39.3   2.0701   3.6 ------	UNKNOWN
111.9570  -5.4684    2.6  28.5  120.5   1.8469   4.5 ------	UNKNOWN
 49.4644 -42.9895    2.6  55.6   16.6   5.9739   4.4 ------	UNKNOWN
 87.5702 -63.3271    2.8  37.0  -16.4   1.4348   4.2 ------	UNKNOWN
Pre-slew background subtracted image of 15-350 keV band
Time interval of the image:
-0.068000 2.164000

# RAcent  DECcent POSerr Theta    Phi  PeakCts   SNR AngSep     Name
#  [deg]    [deg]    ['] [deg]  [deg]                   [']
135.7603 -40.5550    4.3  14.2  -93.0   0.0604   2.7   10.6	Vela X-1
138.3990 -25.1311    2.1  17.1 -152.6   0.1262   5.6 ------	UNKNOWN
152.3497 -29.6979    0.7  26.9 -128.6   0.4741  16.5 ------	UNKNOWN
170.5400 -57.6820    2.3  41.5  -78.5   0.4986   5.1 ------	UNKNOWN
Post-slew image of 15-350 keV band
Time interval of the image:
59.020600 718.890000
720.920000 962.934600

# RAcent  DECcent POSerr Theta    Phi  PeakCts   SNR AngSep     Name
#  [deg]    [deg]    ['] [deg]  [deg]                   [']
135.5347 -40.5578    0.9  17.5   28.9   8.6496  13.1    0.3	Vela X-1
170.3462 -60.6179    2.1  33.2  -34.2   4.7884   5.6    0.9	Cen X-3
186.5917 -62.6378    6.9  39.7  -42.0   1.9738   1.7    8.1	GX 301-2
100.2333 -53.0013    2.9  44.2   24.8   5.5712   4.0 ------	UNKNOWN
 87.2583 -64.3355    3.2  52.8   11.4   7.8498   3.6 ------	UNKNOWN
150.7784 -17.9411    2.4  11.8  154.7   3.0715   4.9 ------	UNKNOWN
 96.2936 -73.3147    3.2  52.1   -0.6   5.3623   3.6 ------	UNKNOWN
166.8406 -33.3711    3.6  12.9  -87.8   2.3390   3.2 ------	UNKNOWN
171.7100 -12.5078    2.8  24.9 -147.7   3.0195   4.1 ------	UNKNOWN
196.1173  -1.4619    4.3  50.2 -134.0  10.1954   2.7 ------	UNKNOWN
207.6220 -58.9023    4.0  47.2  -53.5   9.6955   2.9 ------	UNKNOWN
Plot creation:
Mon Dec 17 21:05:41 EST 2018