Estimated redshift from machine learning (Ukwatta et al. 2016) - may take a few minute to calcaulte
Image
Pre-slew 15.0-350.0 keV image (Event data)

#   RAcent    DECcent   POSerr    Theta     Phi              Peak Cts       SNR   Name
  280.7374    27.9775   0.0171    12.0798   141.0492         0.4314075     11.219 TRIG_00874334

Foreground time interval of the image:
 -0.256   6.756 (delta_t =   7.012 [sec])
Background time interval of the image:
-781.127 -765.111 (delta_t =  16.017 [sec])
-239.528  -0.256 (delta_t = 239.272 [sec])
Lightcurves
Notes:
- 1) The mask-weighted light curves are using the flight position.
- 2) Multiple plots of different time binning/intervals are shown to cover all scenarios of short/long GRBs, rate/image triggers, and real/false positives.
- 3) For all the mask-weighted lightcurves, the y-axis units are counts/sec/det where a det is 0.4 x 0.4 = 0.16 sq cm.
- 4) The verticle lines correspond to following: green dotted lines are T50 interval, black dotted lines are T90 interval, blue solid line(s) is a spacecraft slew start time, and orange solid line(s) is a spacecraft slew end time.
- 5) Time of each bin is in the middle of the bin.
1 s binning
From T0-310 s to T0+310 s

From T100_start - 20 s to T100_end + 30 s
Full time interval

64 ms binning
Full time interval
From T100_start to T100_end

From T0-5 sec to T0+5 sec

16 ms binning
From T100_start-5 s to T100_start+5 s

Blue+Cyan dotted lines: Time interval of the scaled map
From 0.000000 to 2.048000
8 ms binning
From T100_start-3 s to T100_start+3 s
Blue+Cyan dotted lines: Time interval of the scaled map
From 0.000000 to 2.048000
2 ms binning
From T100_start-1 s to T100_start+1 s

Blue+Cyan dotted lines: Time interval of the scaled map
From 0.000000 to 2.048000
SN=5 or 10 sec. binning (whichever binning is satisfied first)

SN=5 or 10 sec. binning (T < 200 sec)
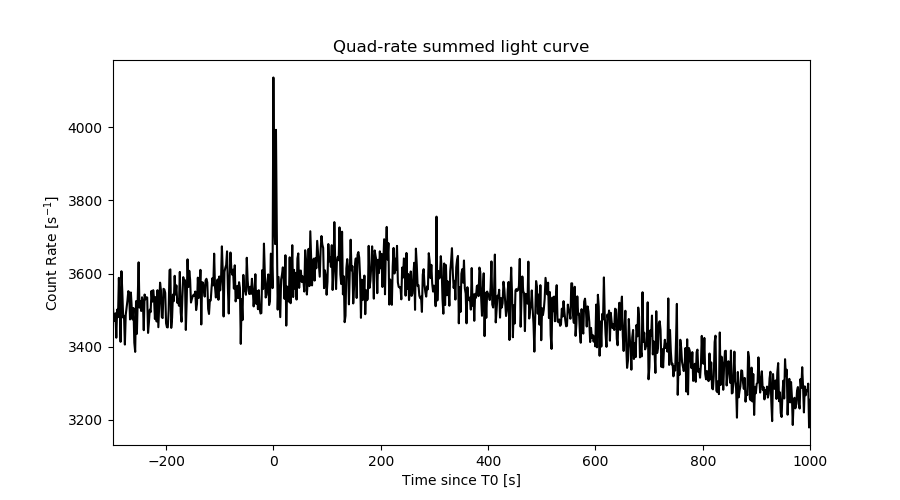
Quad-rate summed light curves (from T0-300s to T0+1000s)
Spectral Evolution

Spectra
Notes:
- 1) The fitting includes the systematic errors.
- 2) When the burst includes telescope slew time periods, the fitting uses an average response file made from multiple 5-s response files through out the slew time plus single time preiod for the non-slew times, and weighted by the total counts in the corresponding time period using addrmf. An average response file is needed becuase a spectral fit using the pre-slew DRM will introduce some errors in both a spectral shape and a normalization if the PHA file contains a lot of the slew/post-slew time interval.
- 3) For fits to more complicated models (e.g. a power-law over a cutoff power-law), the BAT team has decided to require a chi-square improvement of more than 6 for each extra dof.
Time averaged spectrum fit using the average DRM
Power-law model

Time interval is from   -0.256 sec. to    6.756 sec.

Spectral model in power-law:
------------------------------------------------------------
Parameters  : value       lower 90%   higher 90%
Photon index: 1.60212     ( -0.239494   0.247205 )
Norm@50keV  : 3.78868E-03    ( -0.000581376   0.00057103 )
------------------------------------------------------------
#Fit statistic : Chi-Squared =          48.11 using 59 PHA bins.
# Reduced chi-squared =         0.8441 for     57 degrees of freedom
# Null hypothesis probability =   7.929621e-01

Photon flux (15-150 keV)    in 7.012 sec: 0.487199 ( -0.06764  0.067664 ) ph/cm2/s
Energy fluence (15-150 keV)             : 2.48418e-07 ( -4.07198e-08  4.16518e-08 ) ergs/cm2
Cutoff power-law model

Time interval is from   -0.256 sec. to    6.756 sec.
Spectral model in the cutoff power-law:
------------------------------------------------------------
Parameters  : value       lower 90%   higher 90%
Photon index: 0.988411     ( -1.08595   0.77908 )
Epeak [keV] : 76.1078      ( -26.5757 -76.1071 )
Norm@50keV  : 8.12194E-03    ( -0.00473626   0.0223885 )
------------------------------------------------------------
#Fit statistic : Chi-Squared =          46.75 using 59 PHA bins.
# Reduced chi-squared =         0.8348 for     56 degrees of freedom
# Null hypothesis probability =   8.061345e-01

Photon flux (15-150 keV)    in 7.012 sec: 0.475734 ( -0.069618  0.06963 ) ph/cm2/s
Energy fluence (15-150 keV)             : 2.34613e-07 ( -4.40179e-08  4.59315e-08 ) ergs/cm2
Band function

Time interval is from   -0.256 sec. to    6.756 sec.


Spectral model in the Band function:
------------------------------------------------------------
Parameters  : value       lower 90%   higher 90%
alpha       :    (     )
beta        :     (     )
Epeak [keV] :       (   )
Norm@50keV   :     (     )
------------------------------------------------------------

Photon flux (15-150 keV)    in  sec:  (    ) ph/cm2/s
Energy fluence (15-150 keV)             : 0 ( 0  0 ) ergs/cm2
Single BB

Spectral model blackbody:
------------------------------------------------------------
Parameters  : value    Lower 90%  Upper 90%
kT [keV]    : 13.4209  (-2.33797  2.81202)
R^2/D10^2   : 8.07714E-02  (-0.0394988   0.0789335)
(R is the radius in km and D10 is the distance to the source in units of 10 kpc)
------------------------------------------------------------
#Fit statistic : Chi-Squared =          57.34 using 59 PHA bins.
# Reduced chi-squared =          1.006 for     57 degrees of freedom
# Null hypothesis probability =   4.624130e-01

Energy  Fluence     90% Error
[keV]   [erg/cm2]   [erg/cm2]
15- 25  2.161e-08   5.452e-09
25- 50  7.701e-08   1.552e-08
50-150  8.929e-08   2.688e-08
15-150  1.879e-07   4.067e-08
Thermal bremsstrahlung (OTTB)

Spectral model: thermal bremsstrahlung
------------------------------------------------------------
Parameters  : value         Lower 90%    Upper 90%
kT [keV]    : 164.728       (-78.9111      -163.368)
Norm        : 2.00766       (-0.288699     0.372656)
------------------------------------------------------------
#Fit statistic : Chi-Squared =          47.01 using 59 PHA bins.
# Reduced chi-squared =         0.8248 for     57 degrees of freedom
# Null hypothesis probability =   8.245555e-01

Energy  Fluence     90% Error
[keV]   [erg/cm2]   [erg/cm2]
15- 25  3.584e-08   1.970e-08
25- 50  6.732e-08   3.657e-08
50-150  1.379e-07   7.966e-08
15-150  2.411e-07   1.346e-07
Double BB

Spectral model: bbodyrad<1> + bbodyrad<2>
------------------------------------------------------------
Parameters  : value         Lower 90%    Upper 90%
kT1 [keV]   : 5.74848        (-1.9573      2.57866)
R1^2/D10^2  : 0.993279        (-0.71421      3.91618)
kT2 [keV]   : 20.8028        (-5.23308      10.6259)
R2^2/D10^2  : 1.36864E-02    (-0.0106251   0.0267994)
------------------------------------------------------------
#Fit statistic : Chi-Squared =          45.07 using 59 PHA bins.
# Reduced chi-squared =         0.8195 for     55 degrees of freedom
# Null hypothesis probability =   8.277966e-01

Energy  Fluence     90% Error
[keV]   [erg/cm2]   [erg/cm2]
15- 25  3.656e-08   2.069e-08
25- 50  6.627e-08   3.506e-08
50-150  1.317e-07   7.534e-08
15-150  2.346e-07   1.242e-07
Peak spectrum fit
Power-law model

Time interval is from    0.692 sec. to    1.692 sec.

Spectral model in power-law:
------------------------------------------------------------
Parameters  : value       lower 90%   higher 90%
Photon index: 1.76772     ( -0.333449   0.360491 )
Norm@50keV  : 6.63496E-03    ( -0.00161429   0.0015677 )
------------------------------------------------------------
#Fit statistic : Chi-Squared =          65.98 using 59 PHA bins.
# Reduced chi-squared =          1.158 for     57 degrees of freedom
# Null hypothesis probability =   1.941739e-01

Photon flux (15-150 keV)    in 1 sec: 0.903134 ( -0.183428  0.183426 ) ph/cm2/s
Energy fluence (15-150 keV)             : 6.11801e-08 ( -1.48738e-08  1.54448e-08 ) ergs/cm2
Cutoff power-law model

Time interval is from    0.692 sec. to    1.692 sec.
Spectral model in the cutoff power-law:
------------------------------------------------------------
Parameters  : value       lower 90%   higher 90%
Photon index: -0.281771     ( -2.94003   1.89632 )
Epeak [keV] : 46.0465      ( -10.3694 54.4633 )
Norm@50keV  : 0.100873    ( -0.105229   4.38101 )
------------------------------------------------------------
#Fit statistic : Chi-Squared =          62.44 using 59 PHA bins.
# Reduced chi-squared =          1.115 for     56 degrees of freedom
# Null hypothesis probability =   2.580208e-01

Photon flux (15-150 keV)    in 1 sec: 0.853061 ( -0.186867  0.188119 ) ph/cm2/s
Energy fluence (15-150 keV)             : 5.15146e-08 ( -1.29819e-08  1.66737e-08 ) ergs/cm2
Band function

Time interval is from    0.692 sec. to    1.692 sec.


Spectral model in the Band function:
------------------------------------------------------------
Parameters  : value       lower 90%   higher 90%
alpha       :    (     )
beta        :     (     )
Epeak [keV] :       (   )
Norm@50keV   :     (     )
------------------------------------------------------------

Photon flux (15-150 keV)    in  sec:  (    ) ph/cm2/s
Energy fluence (15-150 keV)             : 0 ( 0  0 ) ergs/cm2
Single BB

Spectral model blackbody:
------------------------------------------------------------
Parameters  : value    Lower 90%  Upper 90%
kT [keV]    : 11.3578  (-2.02767  2.50394)
R^2/D10^2   : 0.287629  (-0.151542   0.304597)
(R is the radius in km and D10 is the distance to the source in units of 10 kpc)
------------------------------------------------------------
#Fit statistic : Chi-Squared =          62.92 using 59 PHA bins.
# Reduced chi-squared =          1.104 for     57 degrees of freedom
# Null hypothesis probability =   2.746959e-01

Energy  Fluence     90% Error
[keV]   [erg/cm2]   [erg/cm2]
15- 25  7.797e-09   3.272e-09
25- 50  2.296e-08   7.950e-09
50-150  1.714e-08   8.250e-09
15-150  4.789e-08   1.691e-08
Thermal bremsstrahlung (OTTB)

Spectral model: thermal bremsstrahlung
------------------------------------------------------------
Parameters  : value         Lower 90%    Upper 90%
kT [keV]    : 91.4152       (-43.0222      -91.4375)
Norm        : 4.15298       (-1.01079     1.37089)
------------------------------------------------------------
#Fit statistic : Chi-Squared =          64.24 using 59 PHA bins.
# Reduced chi-squared =          1.127 for     57 degrees of freedom
# Null hypothesis probability =   2.379606e-01

Energy  Fluence     90% Error
[keV]   [erg/cm2]   [erg/cm2]
15- 25  1.084e-08   3.416e-09
25- 50  1.840e-08   7.766e-09
50-150  2.828e-08   2.171e-08
15-150  5.752e-08   2.972e-08
Double BB

Spectral model: bbodyrad<1> + bbodyrad<2>
------------------------------------------------------------
Parameters  : value         Lower 90%    Upper 90%
kT1 [keV]   : 3.41486        (-3.61506      -3.61506)
R1^2/D10^2  : 7.70890        (-6.75464      -6.75464)
kT2 [keV]   : 12.3678        (-2.75422      -12.5265)
R2^2/D10^2  : 0.194873    (-0.184569   0.314808)
------------------------------------------------------------
#Fit statistic : Chi-Squared =          61.81 using 59 PHA bins.
# Reduced chi-squared =          1.124 for     55 degrees of freedom
# Null hypothesis probability =   2.458327e-01

Energy  Fluence     90% Error
[keV]   [erg/cm2]   [erg/cm2]
15- 25  9.402e-09   4.711e-09
25- 50  2.128e-08   1.173e-08
50-150  1.931e-08   1.229e-08
15-150  4.999e-08   2.785e-08
Pre-slew spectrum (Pre-slew PHA with pre-slew DRM)
Power-law model

Spectral model in power-law:
------------------------------------------------------------
Parameters  : value       lower 90%   higher 90%
Photon index: 1.60212     ( -0.239494   0.247205 )
Norm@50keV  : 3.78868E-03    ( -0.000581376   0.00057103 )
------------------------------------------------------------
#Fit statistic : Chi-Squared =          48.11 using 59 PHA bins.
# Reduced chi-squared =         0.8441 for     57 degrees of freedom
# Null hypothesis probability =   7.929621e-01

Photon flux (15-150 keV)    in 7.012 sec: 0.487183 ( -0.0676372  0.0676601 ) ph/cm2/s
Energy fluence (15-150 keV)             : 2.48387e-07 ( -4.0703e-08  4.16647e-08 ) ergs/cm2
Cutoff power-law model

Spectral model in the cutoff power-law:
------------------------------------------------------------
Parameters  : value       lower 90%   higher 90%
Photon index: 0.988408     ( -1.08595   0.77908 )
Epeak [keV] : 76.1075      ( -26.5757 -76.1072 )
Norm@50keV  : 8.12198E-03    ( -0.00473626   0.0223885 )
------------------------------------------------------------
#Fit statistic : Chi-Squared =          46.75 using 59 PHA bins.
# Reduced chi-squared =         0.8348 for     56 degrees of freedom
# Null hypothesis probability =   8.061345e-01

Photon flux (15-150 keV)    in 7.012 sec: 0.475664 ( -0.06959  0.069622 ) ph/cm2/s
Energy fluence (15-150 keV)             : 2.34692e-07 ( -4.40382e-08  4.59938e-08 ) ergs/cm2
Band function

Spectral model in the Band function:
------------------------------------------------------------
Parameters  : value       lower 90%   higher 90%
alpha       :    (     )
beta        :     (     )
Epeak [keV] :       (   )
Norm@50keV   :     (     )
------------------------------------------------------------

Photon flux (15-150 keV)    in  sec:  (    ) ph/cm2/s
Energy fluence (15-150 keV)             : 0 ( 0  0 ) ergs/cm2
S(25-50 keV) vs. S(50-100 keV) plot

S(25-50 keV)  = 6.44e-08
S(50-100 keV) = 8.48e-08
T90 vs. Hardness ratio plot
T90                                   = 6.55999994277954 sec.
Hardness ratio (energy fluence ratio) = 1.31677
Color vs. Color plot

Count Ratio  (25-50 keV) / (15-25 keV) = 1.32632
Count Ratio (50-100 keV) / (15-25 keV) = 0.949029
Mask shadow pattern

IMX = -1.664353036938762E-01, IMY = -1.345400180022847E-01
TIME vs. PHA plot around the trigger time
Blue+Cyan dotted lines: Time interval of the scaled map
From 0.000000 to 2.048000
TIME vs. DetID plot around the trigger time

Blue+Cyan dotted lines: Time interval of the scaled map
From 0.000000 to 2.048000
100 us light curve (15-350 keV)
Blue+Cyan dotted lines: Time interval of the scaled map
From 0.000000 to 2.048000
Spacecraft aspect plot

Bright source in the pre-burst/pre-slew/post-slew images
Pre-burst image of 15-350 keV band
Time interval of the image:
-781.127400 -765.110600
-239.528000 -0.256000

# RAcent  DECcent POSerr Theta    Phi  PeakCts   SNR AngSep     Name
#  [deg]    [deg]    ['] [deg]  [deg]                   [']
254.4765  35.3028    3.3  15.8   26.8   1.0681   3.5    2.6	Her X-1
268.2626  -1.5324    6.2  26.0 -110.4  -0.7375  -1.9    7.9	SW J1753.5-0127
273.9199 -14.1626    6.4  39.1 -118.8   1.1959   1.8    9.1	GX 17+2
288.8338  10.9643    3.7  24.1 -168.9   0.9477   3.2    2.4	GRS 1915+105
299.5792  35.2144    2.0  29.4  131.8   2.7486   5.8    0.9	Cyg X-1
308.1490  40.9877    4.1  37.3  124.3   2.5167   2.8    2.7	Cyg X-3
310.8494  45.1455    3.8  40.3  118.7   3.4591   3.0 ------	UNKNOWN
219.8286  47.6830    2.2  44.2   24.8   2.9799   5.1 ------	UNKNOWN
227.1574  33.9496    3.5  36.5    5.2   1.4095   3.3 ------	UNKNOWN
213.4333   7.8352    3.7  54.5  -27.5   2.9984   3.1 ------	UNKNOWN
233.6614  -6.4685    2.8  45.5  -57.9   5.7294   4.2 ------	UNKNOWN
254.9586 -14.3194    2.4  40.8  -90.1   7.2695   4.7 ------	UNKNOWN
Pre-slew background subtracted image of 15-350 keV band
Time interval of the image:
-0.256000 6.756000

# RAcent  DECcent POSerr Theta    Phi  PeakCts   SNR AngSep     Name
#  [deg]    [deg]    ['] [deg]  [deg]                   [']
254.2598  35.2950    8.3  15.9   26.4   0.0535   1.4   10.1	Her X-1
268.4666  -1.5752   88.4  26.1 -110.8   0.0067   0.1    9.4	SW J1753.5-0127
274.0799 -14.0569    3.5  39.0 -119.0  -0.2719  -3.3    4.5	GX 17+2
288.8137  10.8798    5.9  24.1 -168.7   0.0784   2.0    4.0	GRS 1915+105
299.4145  35.1361    5.1  29.2  131.9   0.1322   2.3    9.5	Cyg X-1
308.1172  40.7370    0.0  37.2  124.7   0.2511   2.4   12.9	Cyg X-3
265.8694  52.2342    2.5  27.8   68.0   0.2534   4.6 ------	UNKNOWN
280.7375  27.9775    1.0  12.1  141.0   0.4313  11.2 ------	UNKNOWN
269.2302 -18.2343    2.3  42.7 -111.4   0.8569   5.1 ------	UNKNOWN
Post-slew image of 15-350 keV band
Time interval of the image:
68.572600 962.609400

# RAcent  DECcent POSerr Theta    Phi  PeakCts   SNR AngSep     Name
#  [deg]    [deg]    ['] [deg]  [deg]                   [']
254.4410  35.3340    2.0  23.5  -10.3   4.9408   5.9    1.0	Her X-1
268.4356  -1.3192   15.2  31.6 -101.2   1.0195   0.8    9.0	SW J1753.5-0127
273.8766 -13.9983    7.3  42.5 -115.3  -5.7549  -1.6    7.9	GX 17+2
288.8059  10.9845    1.9  18.6 -150.8   4.9834   6.2    2.4	GRS 1915+105
299.5903  35.1724    1.2  17.6  115.8   8.6680   9.6    1.8	Cyg X-1
308.1468  40.9252    1.4  25.9  107.6   9.4748   8.1    2.3	Cyg X-3
326.0824  38.4245    8.5  38.9  117.2   3.8546   1.4    7.5	Cyg X-2
286.8548  58.6246    2.2  31.0   61.0   6.4837   5.2 ------	UNKNOWN
233.3476  50.2277    2.6  42.0   10.1   5.1213   4.4 ------	UNKNOWN
318.0706  -4.2570    2.6  48.3 -179.3   7.9146   4.5 ------	UNKNOWN
236.7380  21.5906    3.2  40.2  -34.2   4.4494   3.6 ------	UNKNOWN
211.8017  28.8483    2.6  59.7  -16.4  23.2522   4.4 ------	UNKNOWN
230.9106  12.9002    3.6  48.7  -42.7  11.0811   3.2 ------	UNKNOWN
283.8719 -19.9559    2.6  48.0 -129.2  17.7983   4.5 ------	UNKNOWN
236.0370   6.7289    3.6  47.3  -53.3  13.1852   3.2 ------	UNKNOWN
Plot creation:
Mon Dec 17 21:04:18 EST 2018