Estimated redshift from machine learning (Ukwatta et al. 2016) - may take a few minute to calcaulte
Image
Pre-slew 15.0-350.0 keV image (Event data)
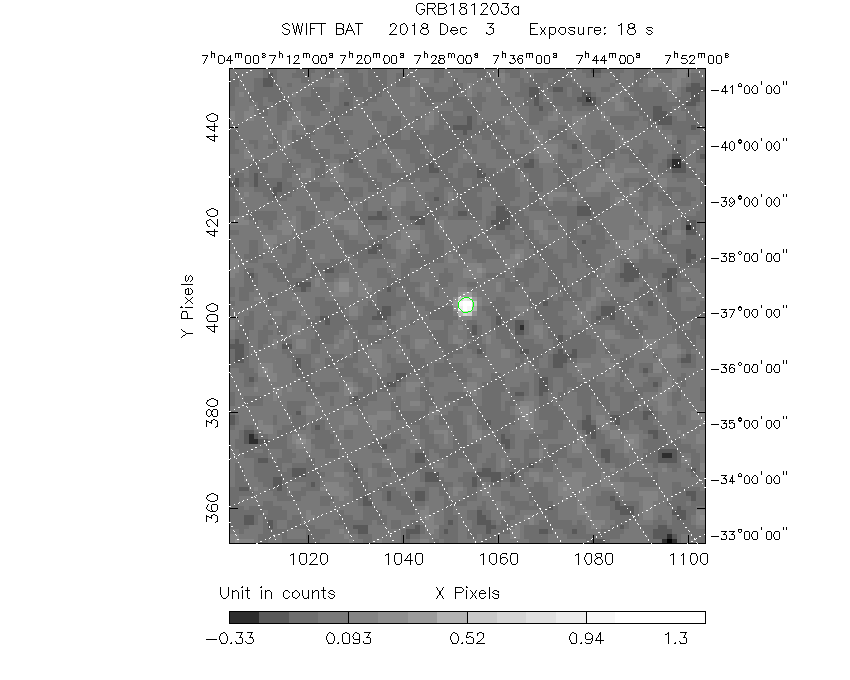
#   RAcent    DECcent   POSerr    Theta     Phi              Peak Cts       SNR   Name
  108.3372   -39.7784   0.0091    21.6201   156.9337         1.4409948     21.058 TRIG_00874475

Foreground time interval of the image:
 -1.796  15.852 (delta_t =  17.648 [sec])
Background time interval of the image:
-298.187 -277.496 (delta_t =  20.691 [sec])
-239.888  -1.796 (delta_t = 238.092 [sec])
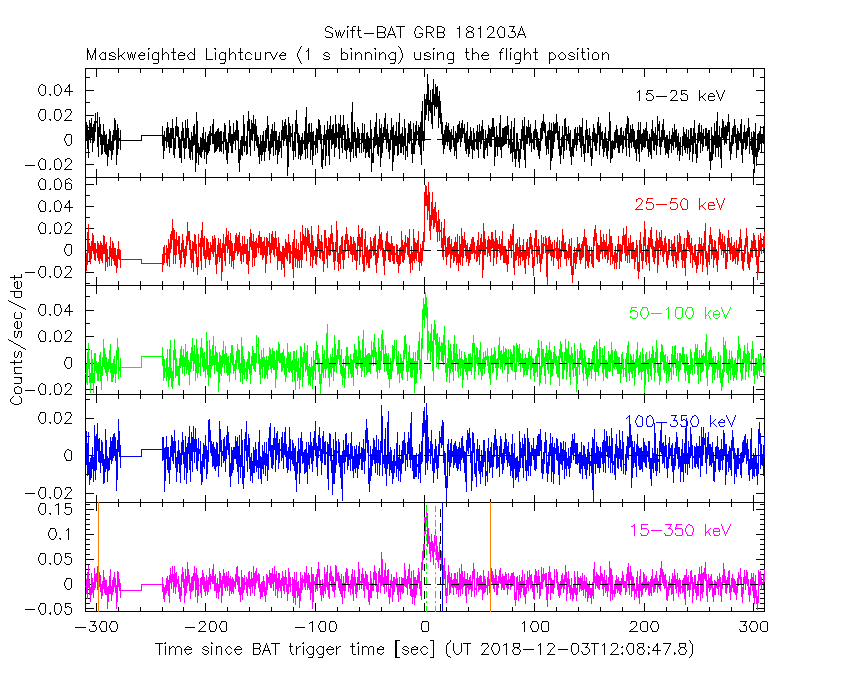
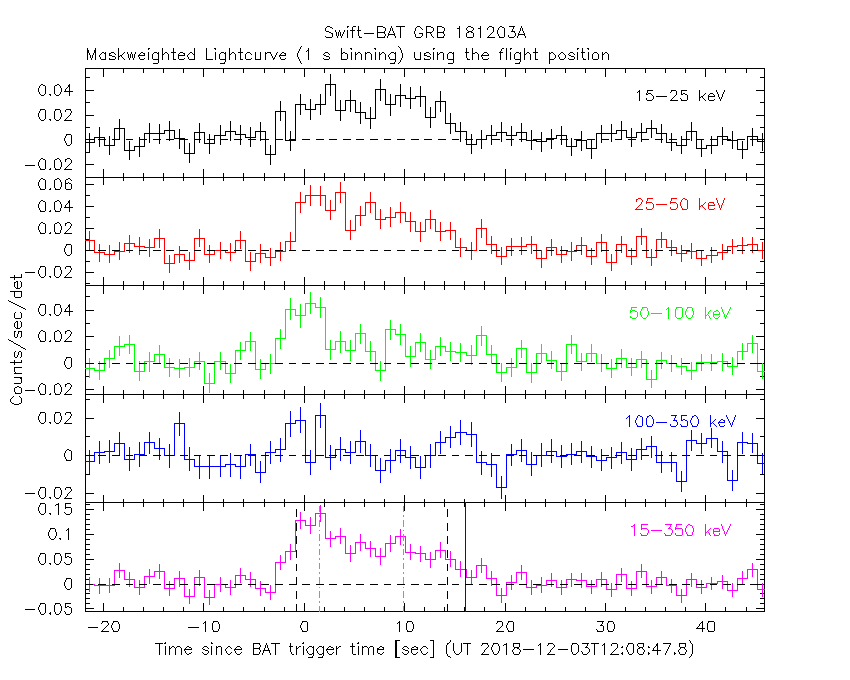
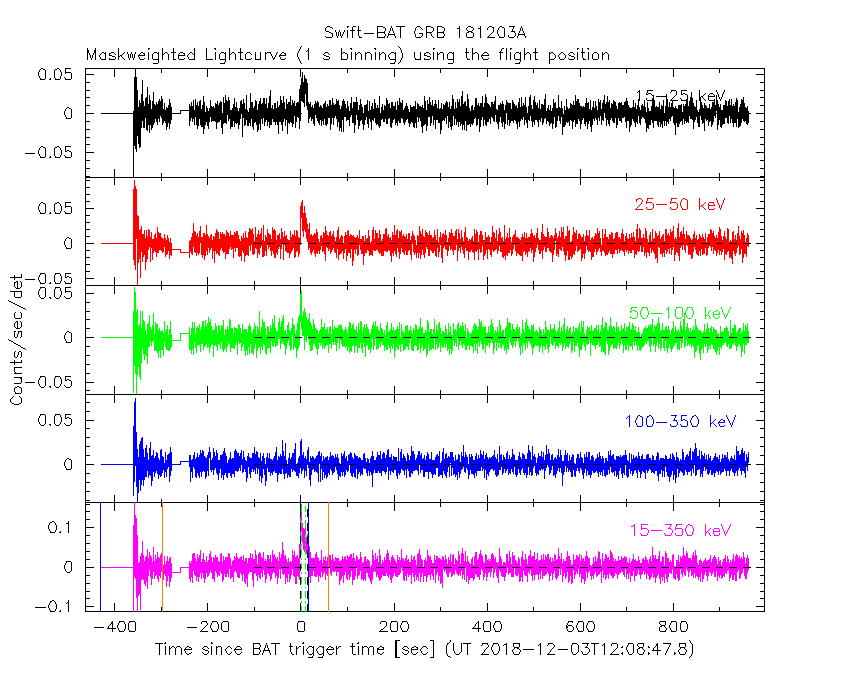
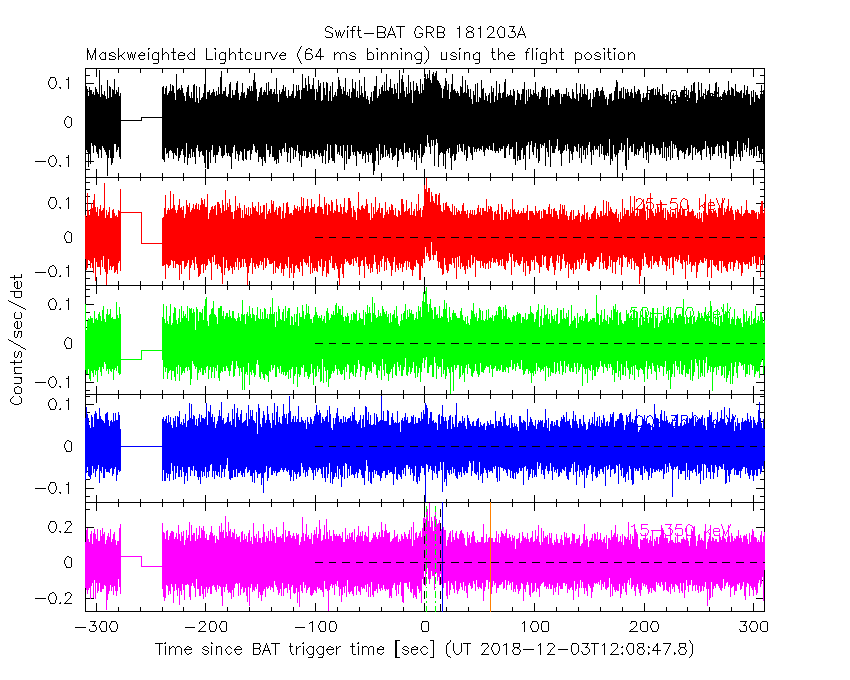
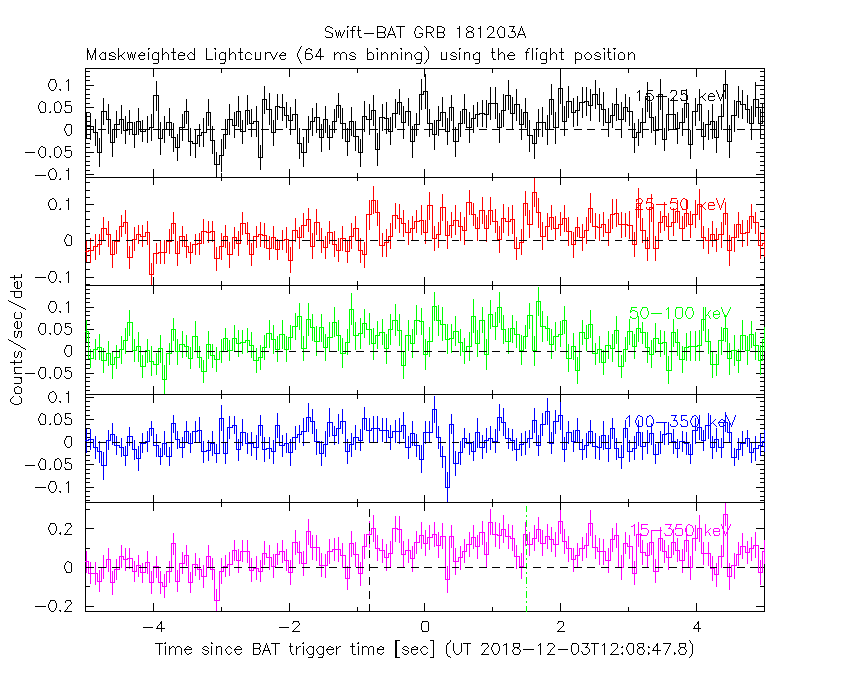
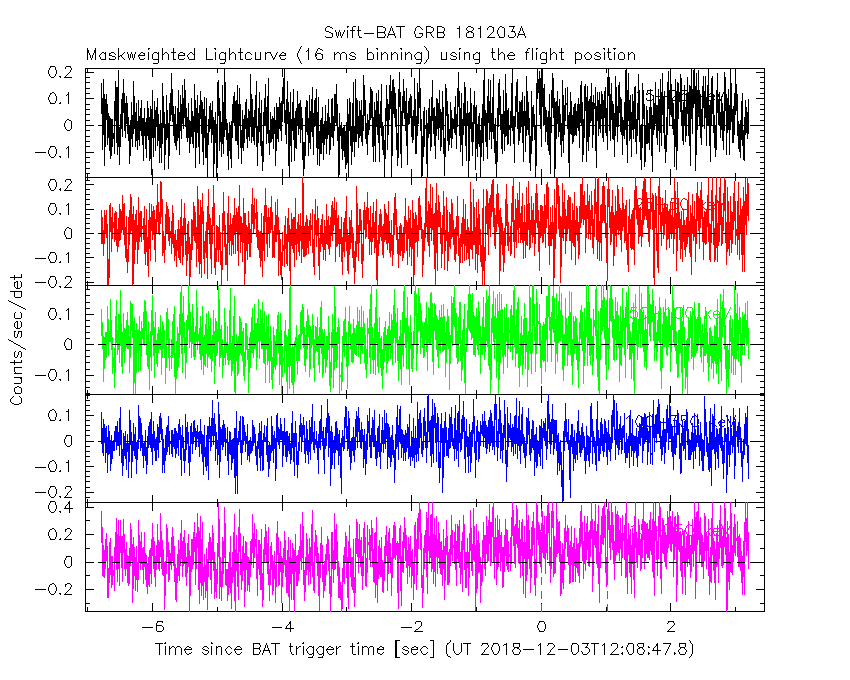
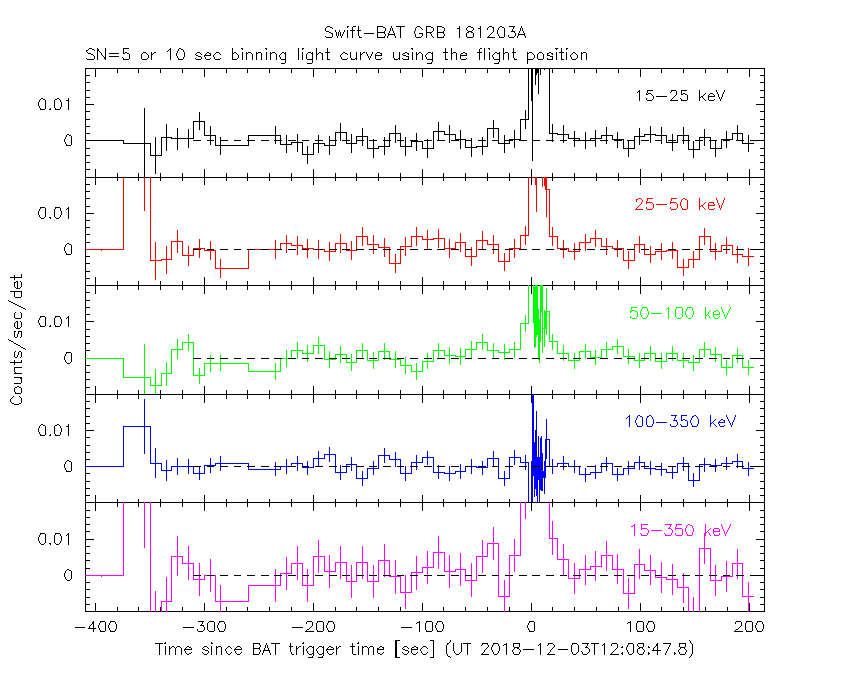
Lightcurves
Notes:
- 1) The mask-weighted light curves are using the flight position.
- 2) Multiple plots of different time binning/intervals are shown to cover all scenarios of short/long GRBs, rate/image triggers, and real/false positives.
- 3) For all the mask-weighted lightcurves, the y-axis units are counts/sec/det where a det is 0.4 x 0.4 = 0.16 sq cm.
- 4) The verticle lines correspond to following: green dotted lines are T50 interval, black dotted lines are T90 interval, blue solid line(s) is a spacecraft slew start time, and orange solid line(s) is a spacecraft slew end time.
- 5) Time of each bin is in the middle of the bin.
1 s binning
From T0-310 s to T0+310 s
From T100_start - 20 s to T100_end + 30 s
Full time interval
64 ms binning
Full time interval
From T100_start to T100_end
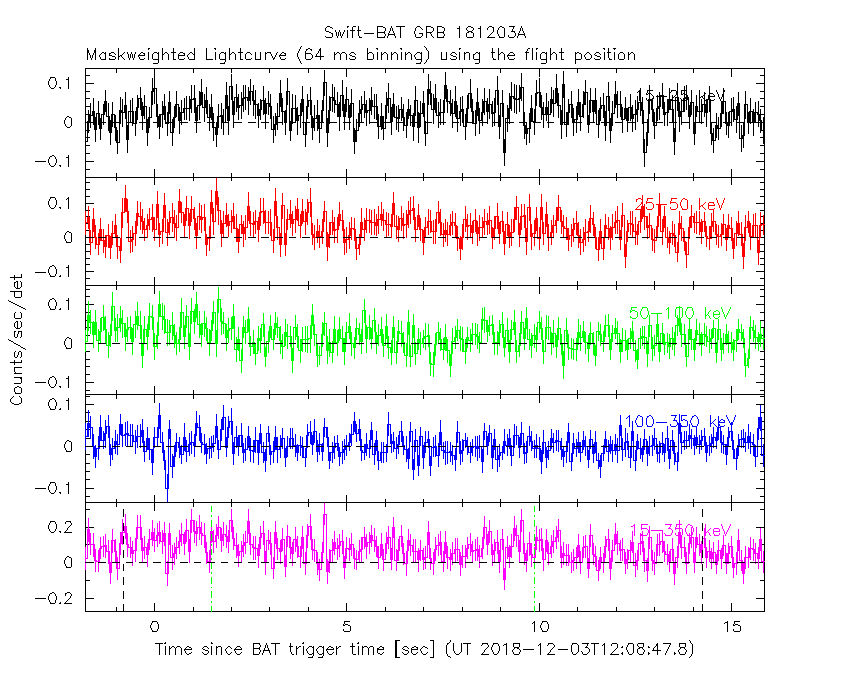
From T0-5 sec to T0+5 sec
16 ms binning
From T100_start-5 s to T100_start+5 s
Blue+Cyan dotted lines: Time interval of the scaled map
From 0.000000 to 1.024000
8 ms binning
From T100_start-3 s to T100_start+3 s

Blue+Cyan dotted lines: Time interval of the scaled map
From 0.000000 to 1.024000
2 ms binning
From T100_start-1 s to T100_start+1 s
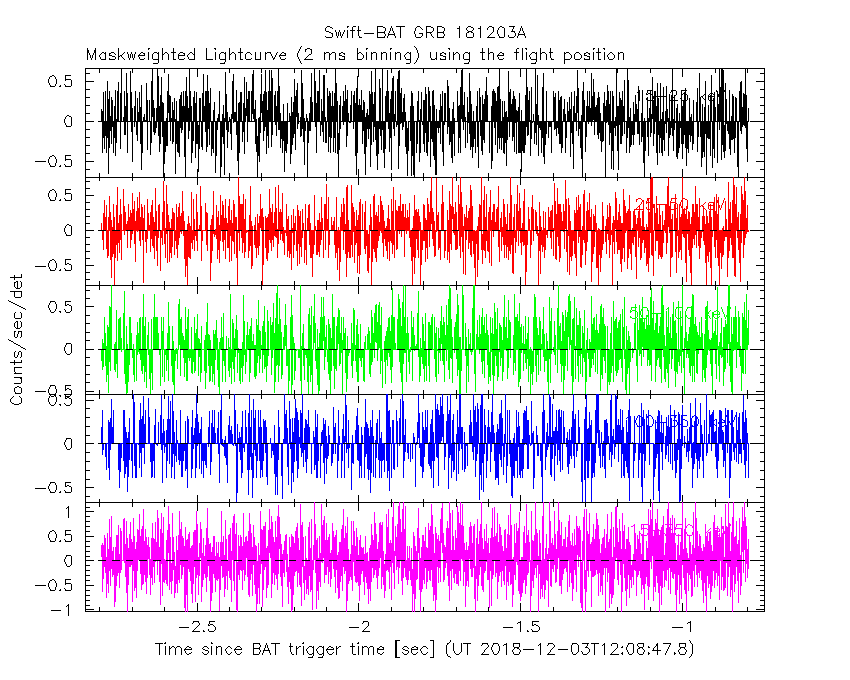
Blue+Cyan dotted lines: Time interval of the scaled map
From 0.000000 to 1.024000
SN=5 or 10 sec. binning (whichever binning is satisfied first)

SN=5 or 10 sec. binning (T < 200 sec)
Quad-rate summed light curves (from T0-300s to T0+1000s)

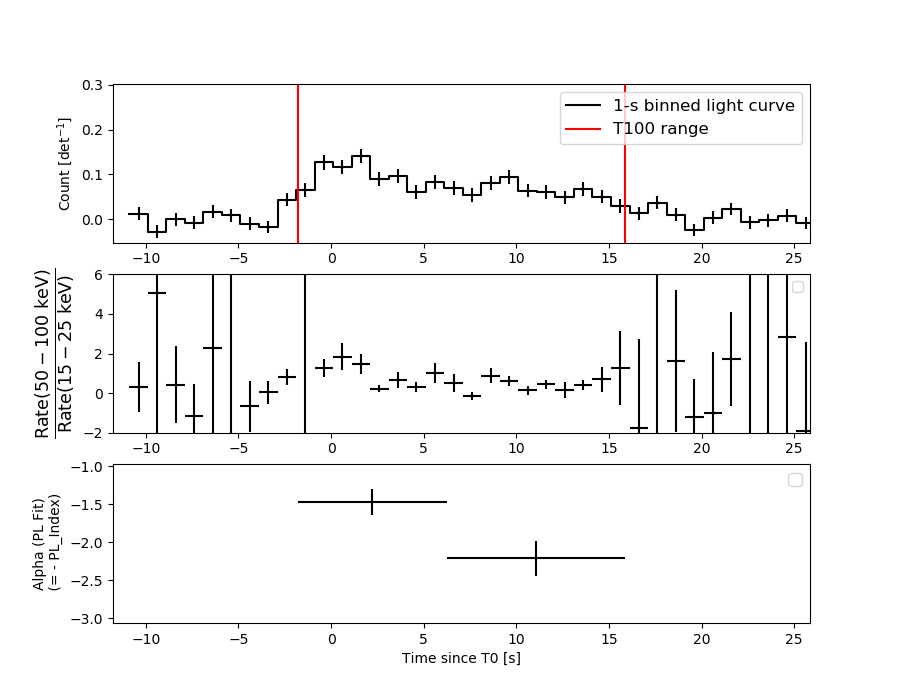
Spectral Evolution
Spectra
Notes:
- 1) The fitting includes the systematic errors.
- 2) When the burst includes telescope slew time periods, the fitting uses an average response file made from multiple 5-s response files through out the slew time plus single time preiod for the non-slew times, and weighted by the total counts in the corresponding time period using addrmf. An average response file is needed becuase a spectral fit using the pre-slew DRM will introduce some errors in both a spectral shape and a normalization if the PHA file contains a lot of the slew/post-slew time interval.
- 3) For fits to more complicated models (e.g. a power-law over a cutoff power-law), the BAT team has decided to require a chi-square improvement of more than 6 for each extra dof.
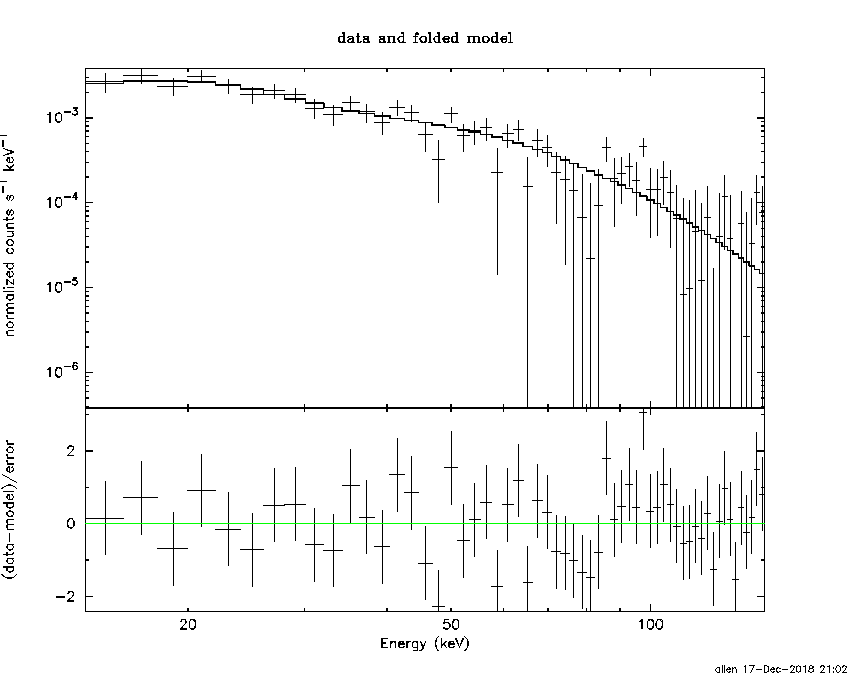
Time averaged spectrum fit using the average DRM
Power-law model
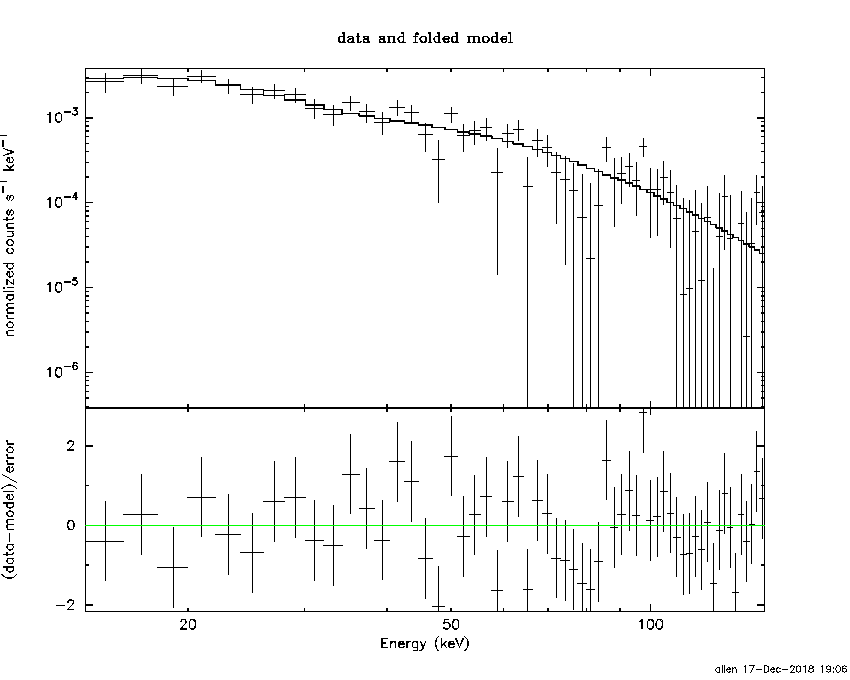
Time interval is from   -1.796 sec. to   15.852 sec.

Spectral model in power-law:
------------------------------------------------------------
Parameters  : value       lower 90%   higher 90%
Photon index: 1.81411     ( -0.143235   0.147382 )
Norm@50keV  : 4.74708E-03    ( -0.000428446   0.000421681 )
------------------------------------------------------------
#Fit statistic : Chi-Squared =          56.00 using 59 PHA bins.
# Reduced chi-squared =         0.9825 for     57 degrees of freedom
# Null hypothesis probability =   5.126057e-01

Photon flux (15-150 keV)    in 17.65 sec: 0.657787 ( -0.051072  0.0511 ) ph/cm2/s
Energy fluence (15-150 keV)             : 7.71107e-07 ( -7.0145e-08  7.11498e-08 ) ergs/cm2
Cutoff power-law model

Time interval is from   -1.796 sec. to   15.852 sec.
Spectral model in the cutoff power-law:
------------------------------------------------------------
Parameters  : value       lower 90%   higher 90%
Photon index: 1.62861     ( -0.611539   0.562442 )
Epeak [keV] : 89.3582      (   )
Norm@50keV  : 6.01123E-03    (     )
------------------------------------------------------------
#Fit statistic : Chi-Squared =          55.67 using 59 PHA bins.
# Reduced chi-squared =         0.9941 for     56 degrees of freedom
# Null hypothesis probability =   4.873852e-01

Photon flux (15-150 keV)    in 17.65 sec: 0.652226 ( -0.053692  0.05351 ) ph/cm2/s
Energy fluence (15-150 keV)             : 7.56214e-07 ( -8.25016e-08  8.12662e-08 ) ergs/cm2
Band function

Time interval is from   -1.796 sec. to   15.852 sec.


Spectral model in the Band function:
------------------------------------------------------------
Parameters  : value       lower 90%   higher 90%
alpha       :    (     )
beta        :     (     )
Epeak [keV] :       (   )
Norm@50keV   :     (     )
------------------------------------------------------------

Photon flux (15-150 keV)    in  sec:  (    ) ph/cm2/s
Energy fluence (15-150 keV)             : 0 ( 0  0 ) ergs/cm2
Single BB

Spectral model blackbody:
------------------------------------------------------------
Parameters  : value    Lower 90%  Upper 90%
kT [keV]    : 11.0556  (-1.0343  1.16739)
R^2/D10^2   : 0.209447  (-0.0656458   0.0934127)
(R is the radius in km and D10 is the distance to the source in units of 10 kpc)
------------------------------------------------------------
#Fit statistic : Chi-Squared =          93.59 using 59 PHA bins.
# Reduced chi-squared =          1.642 for     57 degrees of freedom
# Null hypothesis probability =   1.615763e-03

Energy  Fluence     90% Error
[keV]   [erg/cm2]   [erg/cm2]
15- 25  9.450e-08   1.302e-08
25- 50  2.690e-07   2.453e-08
50-150  1.864e-07   4.058e-08
15-150  5.499e-07   5.313e-08
Thermal bremsstrahlung (OTTB)
Spectral model: thermal bremsstrahlung
------------------------------------------------------------
Parameters  : value         Lower 90%    Upper 90%
kT [keV]    : 97.7381       (-25.2988      42.4819)
Norm        : 2.90688       (-0.312833     0.370062)
------------------------------------------------------------
#Fit statistic : Chi-Squared =          56.50 using 59 PHA bins.
# Reduced chi-squared =         0.9913 for     57 degrees of freedom
# Null hypothesis probability =   4.937133e-01

Energy  Fluence     90% Error
[keV]   [erg/cm2]   [erg/cm2]
15- 25  1.341e-07   1.594e-08
25- 50  2.308e-07   2.162e-08
50-150  3.691e-07   1.341e-07
15-150  7.340e-07   1.446e-07
Double BB
Spectral model: bbodyrad<1> + bbodyrad<2>
------------------------------------------------------------
Parameters  : value         Lower 90%    Upper 90%
kT1 [keV]   : 6.99065        (-1.71697      1.60364)
R1^2/D10^2  : 0.860126        (-0.421062      1.38354)
kT2 [keV]   : 26.7315        (-8.35672      20.9213)
R2^2/D10^2  : 5.68440E-03    (-0.00471038   0.0181058)
------------------------------------------------------------
#Fit statistic : Chi-Squared =          57.60 using 59 PHA bins.
# Reduced chi-squared =          1.047 for     55 degrees of freedom
# Null hypothesis probability =   3.793749e-01

Energy  Fluence     90% Error
[keV]   [erg/cm2]   [erg/cm2]
15- 25  1.310e-07   3.377e-08
25- 50  2.330e-07   5.922e-08
50-150  3.951e-07   1.981e-07
15-150  7.591e-07   2.589e-07
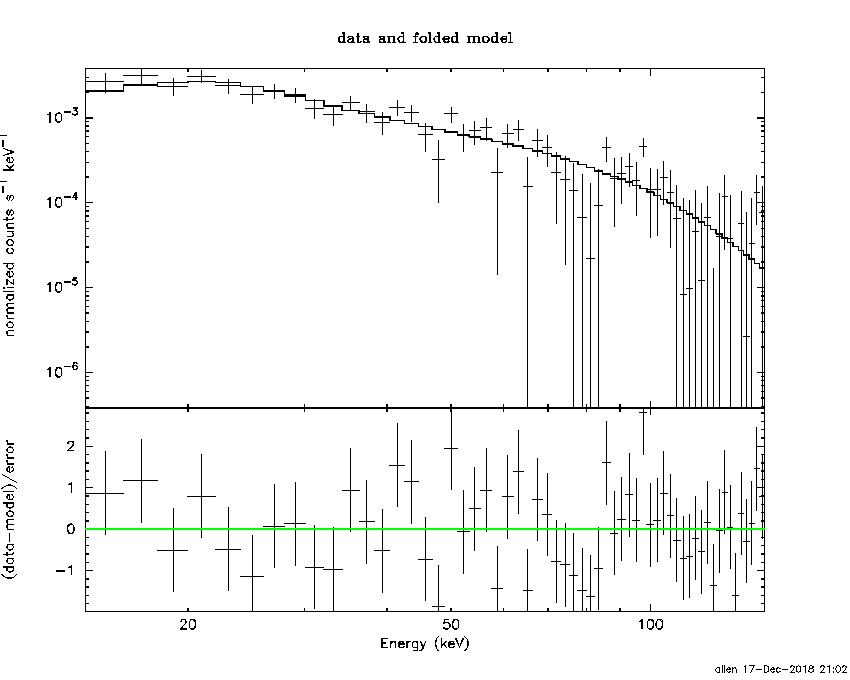
Peak spectrum fit
Power-law model

Time interval is from    1.024 sec. to    2.024 sec.

Spectral model in power-law:
------------------------------------------------------------
Parameters  : value       lower 90%   higher 90%
Photon index: 1.20429     ( -0.383372   0.365754 )
Norm@50keV  : 9.05344E-03    ( -0.00165752   0.00165735 )
------------------------------------------------------------
#Fit statistic : Chi-Squared =          57.84 using 59 PHA bins.
# Reduced chi-squared =          1.015 for     57 degrees of freedom
# Null hypothesis probability =   4.439689e-01

Photon flux (15-150 keV)    in 1 sec: 1.06333 ( -0.20264  0.20346 ) ph/cm2/s
Energy fluence (15-150 keV)             : 9.17508e-08 ( -1.90097e-08  1.92203e-08 ) ergs/cm2
Cutoff power-law model
Time interval is from    1.024 sec. to    2.024 sec.
Spectral model in the cutoff power-law:
------------------------------------------------------------
Parameters  : value       lower 90%   higher 90%
Photon index: 1.20155     ( -0.412172   0.344458 )
Epeak [keV] : 1.00000E+04      ( -10000 -10000 )
Norm@50keV  : 9.09559E-03    ( -0.00166515   -0.00909559 )
------------------------------------------------------------
#Fit statistic : Chi-Squared =          57.86 using 59 PHA bins.
# Reduced chi-squared =          1.033 for     56 degrees of freedom
# Null hypothesis probability =   4.063147e-01

Photon flux (15-150 keV)    in 1 sec: 1.06976 ( -0.218146  0.20498 ) ph/cm2/s
Energy fluence (15-150 keV)             : 9.09829e-08 ( -1.82887e-08  1.99116e-08 ) ergs/cm2
Band function

Time interval is from    1.024 sec. to    2.024 sec.


Spectral model in the Band function:
------------------------------------------------------------
Parameters  : value       lower 90%   higher 90%
alpha       :    (     )
beta        :     (     )
Epeak [keV] :       (   )
Norm@50keV   :     (     )
------------------------------------------------------------

Photon flux (15-150 keV)    in  sec:  (    ) ph/cm2/s
Energy fluence (15-150 keV)             : 0 ( 0  0 ) ergs/cm2
Single BB

Spectral model blackbody:
------------------------------------------------------------
Parameters  : value    Lower 90%  Upper 90%
kT [keV]    : 24.5068  (-8.54227  13.3491)
R^2/D10^2   : 2.40969E-02  (-0.0168094   0.0688951)
(R is the radius in km and D10 is the distance to the source in units of 10 kpc)
------------------------------------------------------------
#Fit statistic : Chi-Squared =          72.85 using 59 PHA bins.
# Reduced chi-squared =          1.278 for     57 degrees of freedom
# Null hypothesis probability =   7.683074e-02

Energy  Fluence     90% Error
[keV]   [erg/cm2]   [erg/cm2]
15- 25  2.541e-09   1.308e-09
25- 50  1.427e-08   6.148e-09
50-150  6.370e-08   2.807e-08
15-150  8.050e-08   2.699e-08
Thermal bremsstrahlung (OTTB)

Spectral model: thermal bremsstrahlung
------------------------------------------------------------
Parameters  : value         Lower 90%    Upper 90%
kT [keV]    : 200.000       (-70.2313      -200)
Norm        : 4.38443       (-0.823258     0.823258)
------------------------------------------------------------
#Fit statistic : Chi-Squared =          61.79 using 59 PHA bins.
# Reduced chi-squared =          1.084 for     57 degrees of freedom
# Null hypothesis probability =   3.091358e-01

Energy  Fluence     90% Error
[keV]   [erg/cm2]   [erg/cm2]
15- 25  1.092e-08   6.335e-09
25- 50  2.101e-08   1.215e-08
50-150  4.608e-08   2.635e-08
15-150  7.802e-08   4.503e-08
Double BB

Spectral model: bbodyrad<1> + bbodyrad<2>
------------------------------------------------------------
Parameters  : value         Lower 90%    Upper 90%
kT1 [keV]   : 7.11320        (-2.28181      2.82818)
R1^2/D10^2  : 1.17496        (-0.833849      3.27326)
kT2 [keV]   : 57.4742        (-26.1665      -57.4692)
R2^2/D10^2  : 2.09050E-03    (-0.00175471   0.00800197)
------------------------------------------------------------
#Fit statistic : Chi-Squared =          54.01 using 59 PHA bins.
# Reduced chi-squared =         0.9821 for     55 degrees of freedom
# Null hypothesis probability =   5.122963e-01

Energy  Fluence     90% Error
[keV]   [erg/cm2]   [erg/cm2]
15- 25  1.038e-08   5.900e-09
25- 50  1.874e-08   1.022e-08
50-150  7.206e-08   3.882e-08
15-150  1.012e-07   5.230e-08
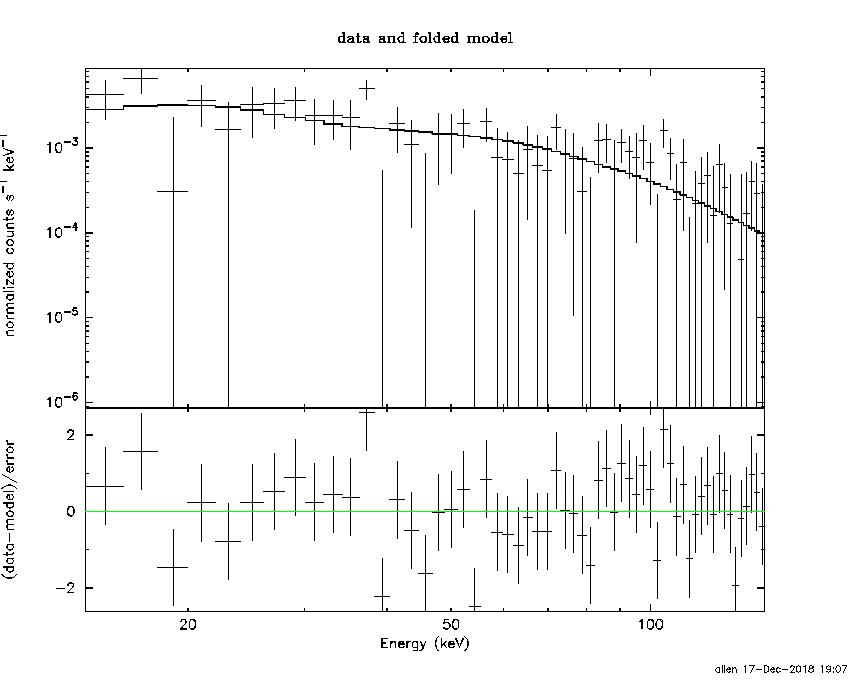
Pre-slew spectrum (Pre-slew PHA with pre-slew DRM)
Power-law model

Spectral model in power-law:
------------------------------------------------------------
Parameters  : value       lower 90%   higher 90%
Photon index: 1.81411     ( -0.143235   0.147382 )
Norm@50keV  : 4.74708E-03    ( -0.000428446   0.000421681 )
------------------------------------------------------------
#Fit statistic : Chi-Squared =          56.00 using 59 PHA bins.
# Reduced chi-squared =         0.9825 for     57 degrees of freedom
# Null hypothesis probability =   5.126057e-01

Photon flux (15-150 keV)    in 17.65 sec: 0.657752 ( -0.0510675  0.0510961 ) ph/cm2/s
Energy fluence (15-150 keV)             : 7.70987e-07 ( -7.02253e-08  7.11556e-08 ) ergs/cm2
Cutoff power-law model

Spectral model in the cutoff power-law:
------------------------------------------------------------
Parameters  : value       lower 90%   higher 90%
Photon index: 1.62860     ( -0.611538   0.562544 )
Epeak [keV] : 89.3568      (   )
Norm@50keV  : 6.01127E-03    (     )
------------------------------------------------------------
#Fit statistic : Chi-Squared =          55.67 using 59 PHA bins.
# Reduced chi-squared =         0.9941 for     56 degrees of freedom
# Null hypothesis probability =   4.873852e-01

Photon flux (15-150 keV)    in 17.65 sec: 0.652096 ( -0.05367  0.026751 ) ph/cm2/s
Energy fluence (15-150 keV)             : 7.56415e-07 ( -8.26179e-08  8.11759e-08 ) ergs/cm2
Band function

Spectral model in the Band function:
------------------------------------------------------------
Parameters  : value       lower 90%   higher 90%
alpha       :    (     )
beta        :     (     )
Epeak [keV] :       (   )
Norm@50keV   :     (     )
------------------------------------------------------------

Photon flux (15-150 keV)    in  sec:  (    ) ph/cm2/s
Energy fluence (15-150 keV)             : 0 ( 0  0 ) ergs/cm2
S(25-50 keV) vs. S(50-100 keV) plot

S(25-50 keV)  = 2.19e-07
S(50-100 keV) = 2.49e-07
T90 vs. Hardness ratio plot
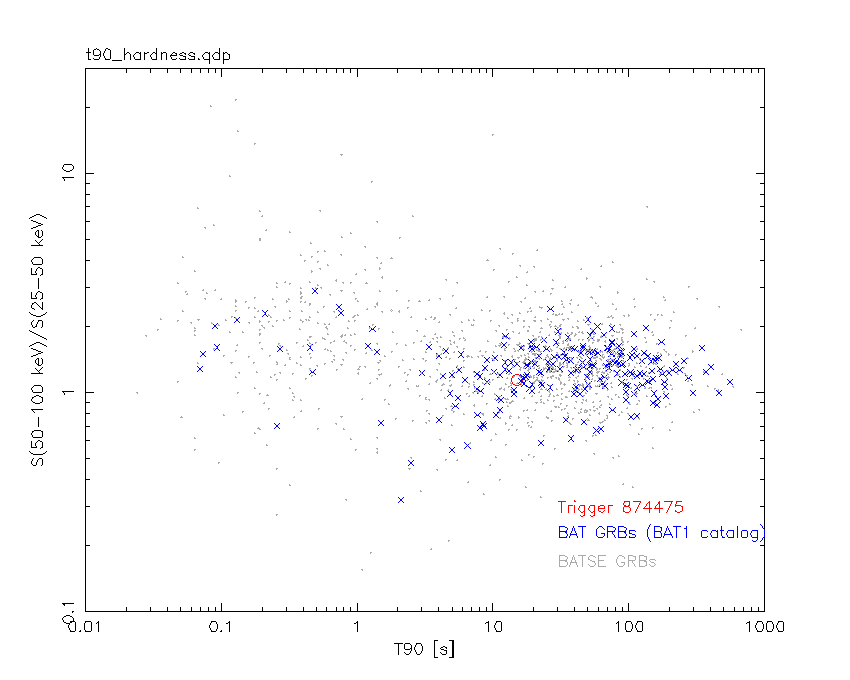
T90                                   = 15.0599999427795 sec.
Hardness ratio (energy fluence ratio) = 1.13699
Color vs. Color plot
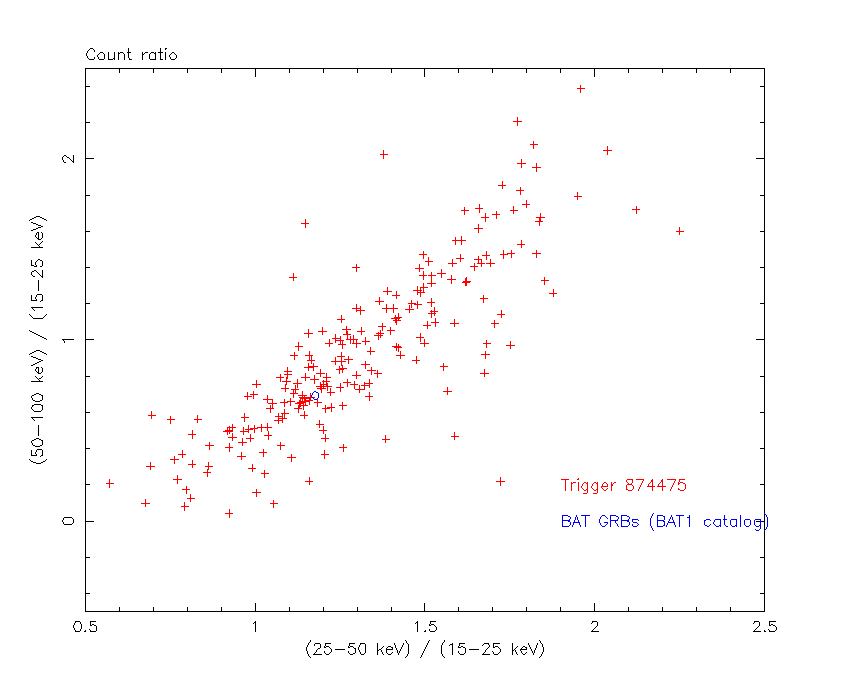
Count Ratio  (25-50 keV) / (15-25 keV) = 1.17674
Count Ratio (50-100 keV) / (15-25 keV) = 0.692999
Mask shadow pattern

IMX = -3.646480396765555E-01, IMY = -1.552817912817654E-01
TIME vs. PHA plot around the trigger time
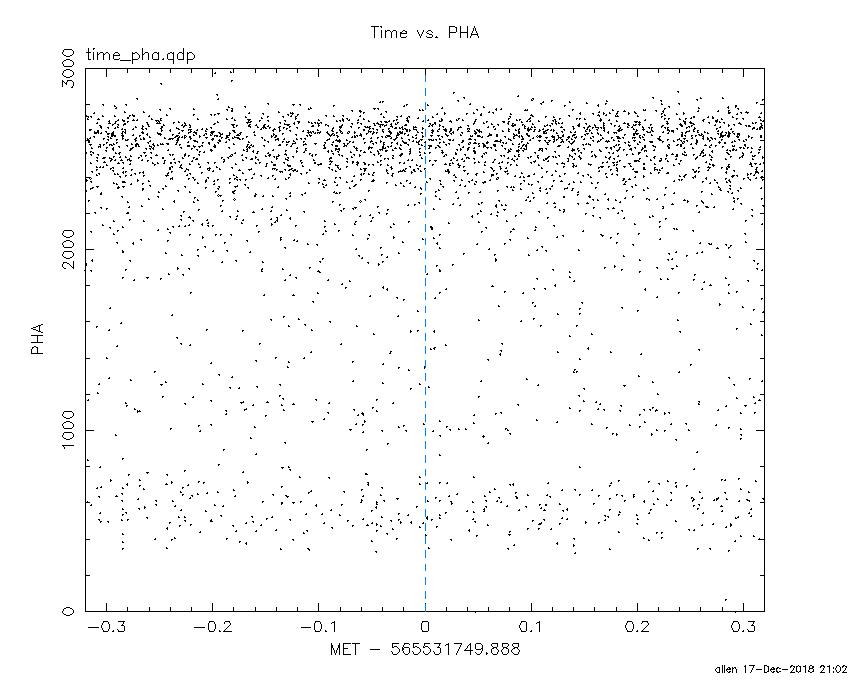
Blue+Cyan dotted lines: Time interval of the scaled map
From 0.000000 to 1.024000
TIME vs. DetID plot around the trigger time

Blue+Cyan dotted lines: Time interval of the scaled map
From 0.000000 to 1.024000
100 us light curve (15-350 keV)

Blue+Cyan dotted lines: Time interval of the scaled map
From 0.000000 to 1.024000
Spacecraft aspect plot

Bright source in the pre-burst/pre-slew/post-slew images
Pre-burst image of 15-350 keV band
Time interval of the image:
-298.187400 -277.496100
-239.888000 -1.796000

# RAcent  DECcent POSerr Theta    Phi  PeakCts   SNR AngSep     Name
#  [deg]    [deg]    ['] [deg]  [deg]                   [']
135.4639 -40.5188   11.5  35.4 -169.6   0.3349   1.0    3.7	Vela X-1
170.0526 -60.7291    0.0  41.7 -122.8  -1.1338  -1.7   10.0	Cen X-3
 38.3144 -27.1524    2.5  44.3   34.0   2.8592   4.6 ------	UNKNOWN
 53.0195 -29.0431    2.2  35.3   49.0   2.9732   5.3 ------	UNKNOWN
156.7354 -37.4734    3.0  49.5 -156.0   2.5124   3.9 ------	UNKNOWN
159.6455 -38.9094    3.0  50.1 -152.5   2.6223   3.9 ------	UNKNOWN
Pre-slew background subtracted image of 15-350 keV band
Time interval of the image:
-1.796000 15.852000

# RAcent  DECcent POSerr Theta    Phi  PeakCts   SNR AngSep     Name
#  [deg]    [deg]    ['] [deg]  [deg]                   [']
135.5094 -40.6794    5.6  35.4 -169.4   0.1787   2.1    7.5	Vela X-1
170.1437 -60.4841    9.3  41.8 -123.1   0.1908   1.2    9.8	Cen X-3
108.3372 -39.7784    0.5  21.6  156.9   1.4411  21.1 ------	UNKNOWN
Post-slew image of 15-350 keV band
Time interval of the image:
60.012590 962.201700

# RAcent  DECcent POSerr Theta    Phi  PeakCts   SNR AngSep     Name
#  [deg]    [deg]    ['] [deg]  [deg]                   [']
135.4888 -40.6407    5.5  20.7 -131.1   1.7595   2.1    5.5	Vela X-1
102.5984   0.0856    3.6  40.2  118.8   9.0329   3.3 ------	UNKNOWN
121.8017   6.1901    3.7  47.6  146.0   8.2856   3.1 ------	UNKNOWN
 75.0653 -75.7406    3.6  38.9  -39.8   3.4552   3.2 ------	UNKNOWN
Plot creation:
Mon Dec 17 21:02:58 EST 2018