Estimated redshift from machine learning (Ukwatta et al. 2016) - may take a few minute to calcaulte
Image
Pre-slew 15.0-350.0 keV image (Event data)

#   RAcent    DECcent   POSerr    Theta     Phi              Peak Cts       SNR   Name
  248.2090    78.5009   0.0160    47.5642  -148.1640         1.9556417     11.990 TRIG_00876016

Foreground time interval of the image:
 -0.408  15.944 (delta_t =  16.352 [sec])
Background time interval of the image:
-696.311 -680.381 (delta_t =  15.930 [sec])
-239.512  -0.408 (delta_t = 239.104 [sec])
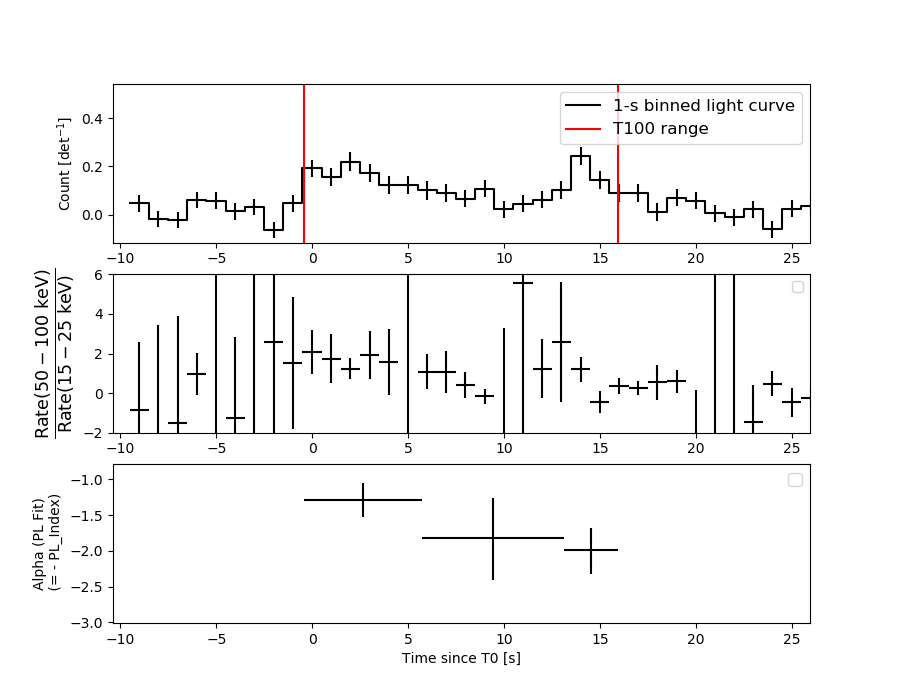
Lightcurves
Notes:
- 1) The mask-weighted light curves are using the flight position.
- 2) Multiple plots of different time binning/intervals are shown to cover all scenarios of short/long GRBs, rate/image triggers, and real/false positives.
- 3) For all the mask-weighted lightcurves, the y-axis units are counts/sec/det where a det is 0.4 x 0.4 = 0.16 sq cm.
- 4) The verticle lines correspond to following: green dotted lines are T50 interval, black dotted lines are T90 interval, blue solid line(s) is a spacecraft slew start time, and orange solid line(s) is a spacecraft slew end time.
- 5) Time of each bin is in the middle of the bin.
1 s binning
From T0-310 s to T0+310 s

From T100_start - 20 s to T100_end + 30 s

Full time interval

64 ms binning
Full time interval
From T100_start to T100_end

From T0-5 sec to T0+5 sec
16 ms binning
From T100_start-5 s to T100_start+5 s
Blue+Cyan dotted lines: Time interval of the scaled map
From 0.000000 to 16.384000
8 ms binning
From T100_start-3 s to T100_start+3 s

Blue+Cyan dotted lines: Time interval of the scaled map
From 0.000000 to 16.384000
2 ms binning
From T100_start-1 s to T100_start+1 s
Blue+Cyan dotted lines: Time interval of the scaled map
From 0.000000 to 16.384000
SN=5 or 10 sec. binning (whichever binning is satisfied first)

SN=5 or 10 sec. binning (T < 200 sec)

Quad-rate summed light curves (from T0-300s to T0+1000s)

Spectral Evolution
Spectra
Notes:
- 1) The fitting includes the systematic errors.
- 2) When the burst includes telescope slew time periods, the fitting uses an average response file made from multiple 5-s response files through out the slew time plus single time preiod for the non-slew times, and weighted by the total counts in the corresponding time period using addrmf. An average response file is needed becuase a spectral fit using the pre-slew DRM will introduce some errors in both a spectral shape and a normalization if the PHA file contains a lot of the slew/post-slew time interval.
- 3) For fits to more complicated models (e.g. a power-law over a cutoff power-law), the BAT team has decided to require a chi-square improvement of more than 6 for each extra dof.
Time averaged spectrum fit using the average DRM
Power-law model

Time interval is from   -0.408 sec. to   15.944 sec.

Spectral model in power-law:
------------------------------------------------------------
Parameters  : value       lower 90%   higher 90%
Photon index: 1.58252     ( -0.197261   0.199716 )
Norm@50keV  : 9.40880E-03    ( -0.00109224   0.00108504 )
------------------------------------------------------------
#Fit statistic : Chi-Squared =          39.30 using 59 PHA bins.
# Reduced chi-squared =         0.6895 for     57 degrees of freedom
# Null hypothesis probability =   9.644334e-01

Photon flux (15-150 keV)    in 16.35 sec: 1.20266 ( -0.14023  0.14071 ) ph/cm2/s
Energy fluence (15-150 keV)             : 1.44201e-06 ( -1.78297e-07  1.79682e-07 ) ergs/cm2
Cutoff power-law model

Time interval is from   -0.408 sec. to   15.944 sec.
Spectral model in the cutoff power-law:
------------------------------------------------------------
Parameters  : value       lower 90%   higher 90%
Photon index: 1.49606     ( -0.82732   1.32341 )
Epeak [keV] : 270.472      ( -306.638 -306.638 )
Norm@50keV  : 1.04210E-02    ( -0.00845883   0.0166258 )
------------------------------------------------------------
#Fit statistic : Chi-Squared =          39.28 using 59 PHA bins.
# Reduced chi-squared =         0.7014 for     56 degrees of freedom
# Null hypothesis probability =   9.560926e-01

Photon flux (15-150 keV)    in 16.35 sec: 1.19881 ( -0.14457  0.14319 ) ph/cm2/s
Energy fluence (15-150 keV)             : 1.43406e-06 ( -1.95356e-07  1.85576e-07 ) ergs/cm2
Band function

Time interval is from   -0.408 sec. to   15.944 sec.


Spectral model in the Band function:
------------------------------------------------------------
Parameters  : value       lower 90%   higher 90%
alpha       :    (     )
beta        :     (     )
Epeak [keV] :       (   )
Norm@50keV   :     (     )
------------------------------------------------------------

Photon flux (15-150 keV)    in  sec:  (    ) ph/cm2/s
Energy fluence (15-150 keV)             : 0 ( 0  0 ) ergs/cm2
Single BB
Spectral model blackbody:
------------------------------------------------------------
Parameters  : value    Lower 90%  Upper 90%
kT [keV]    : 13.6818  (-1.88802  2.29616)
R^2/D10^2   : 0.183768  (-0.0786399   0.130838)
(R is the radius in km and D10 is the distance to the source in units of 10 kpc)
------------------------------------------------------------
#Fit statistic : Chi-Squared =          59.42 using 59 PHA bins.
# Reduced chi-squared =          1.042 for     57 degrees of freedom
# Null hypothesis probability =   3.876261e-01

Energy  Fluence     90% Error
[keV]   [erg/cm2]   [erg/cm2]
15- 25  1.190e-07   2.650e-08
25- 50  4.326e-07   7.096e-08
50-150  5.268e-07   1.252e-07
15-150  1.078e-06   1.781e-07
Thermal bremsstrahlung (OTTB)
Spectral model: thermal bremsstrahlung
------------------------------------------------------------
Parameters  : value         Lower 90%    Upper 90%
kT [keV]    : 197.705       (-87.3681      -197.343)
Norm        : 4.88309       (-0.556329     0.67768)
------------------------------------------------------------
#Fit statistic : Chi-Squared =          39.49 using 59 PHA bins.
# Reduced chi-squared =         0.6928 for     57 degrees of freedom
# Null hypothesis probability =   9.626502e-01

Energy  Fluence     90% Error
[keV]   [erg/cm2]   [erg/cm2]
15- 25  1.990e-07   1.100e-07
25- 50  3.825e-07   2.014e-07
50-150  8.365e-07   4.508e-07
15-150  1.418e-06   7.707e-07
Double BB

Spectral model: bbodyrad<1> + bbodyrad<2>
------------------------------------------------------------
Parameters  : value         Lower 90%    Upper 90%
kT1 [keV]   : 9.11658        (-2.30658      2.27405)
R1^2/D10^2  : 0.626751        (-0.320936      1.12697)
kT2 [keV]   : 47.3408        (-21.9948      -47.342)
R2^2/D10^2  : 2.04992E-03    (-0.00194555   0.0130666)
------------------------------------------------------------
#Fit statistic : Chi-Squared =          38.17 using 59 PHA bins.
# Reduced chi-squared =         0.6941 for     55 degrees of freedom
# Null hypothesis probability =   9.590552e-01

Energy  Fluence     90% Error
[keV]   [erg/cm2]   [erg/cm2]
15- 25  1.755e-07   6.851e-08
25- 50  4.229e-07   1.594e-07
50-150  8.495e-07   4.368e-07
15-150  1.448e-06   5.706e-07
Peak spectrum fit
Power-law model

Time interval is from    1.164 sec. to    2.164 sec.

Spectral model in power-law:
------------------------------------------------------------
Parameters  : value       lower 90%   higher 90%
Photon index: 1.69712     ( -0.419594   0.455146 )
Norm@50keV  : 1.57030E-02    ( -0.00462664   0.00450963 )
------------------------------------------------------------
#Fit statistic : Chi-Squared =          47.38 using 59 PHA bins.
# Reduced chi-squared =         0.8312 for     57 degrees of freedom
# Null hypothesis probability =   8.143289e-01

Photon flux (15-150 keV)    in 1 sec: 2.08353 ( -0.57334  0.5743 ) ph/cm2/s
Energy fluence (15-150 keV)             : 1.45445e-07 ( -4.36163e-08  4.43435e-08 ) ergs/cm2
Cutoff power-law model

Time interval is from    1.164 sec. to    2.164 sec.
Spectral model in the cutoff power-law:
------------------------------------------------------------
Parameters  : value       lower 90%   higher 90%
Photon index: 0.650172     ( -2.98618   1.54929 )
Epeak [keV] : 60.9586      ( -28.9813 -60.9576 )
Norm@50keV  : 5.73653E-02    ( -0.0573691   2.33968 )
------------------------------------------------------------
#Fit statistic : Chi-Squared =          46.44 using 59 PHA bins.
# Reduced chi-squared =         0.8292 for     56 degrees of freedom
# Null hypothesis probability =   8.151271e-01

Photon flux (15-150 keV)    in 1 sec: 2.05298 ( -0.57914  0.57832 ) ph/cm2/s
Energy fluence (15-150 keV)             : 1.38663e-07 ( -4.55158e-08  4.65963e-08 ) ergs/cm2
Band function

Time interval is from    1.164 sec. to    2.164 sec.


Spectral model in the Band function:
------------------------------------------------------------
Parameters  : value       lower 90%   higher 90%
alpha       :    (     )
beta        :     (     )
Epeak [keV] :       (   )
Norm@50keV   :     (     )
------------------------------------------------------------

Photon flux (15-150 keV)    in  sec:  (    ) ph/cm2/s
Energy fluence (15-150 keV)             : 0 ( 0  0 ) ergs/cm2
Single BB

Spectral model blackbody:
------------------------------------------------------------
Parameters  : value    Lower 90%  Upper 90%
kT [keV]    : 12.8357  (-3.3927  4.53508)
R^2/D10^2   : 0.430106  (-0.291643   0.862131)
(R is the radius in km and D10 is the distance to the source in units of 10 kpc)
------------------------------------------------------------
#Fit statistic : Chi-Squared =          48.18 using 59 PHA bins.
# Reduced chi-squared =         0.8453 for     57 degrees of freedom
# Null hypothesis probability =   7.909479e-01

Energy  Fluence     90% Error
[keV]   [erg/cm2]   [erg/cm2]
15- 25  1.503e-08   8.308e-09
25- 50  5.106e-08   2.700e-08
50-150  5.278e-08   3.234e-08
15-150  1.189e-07   6.023e-08
Thermal bremsstrahlung (OTTB)

Spectral model: thermal bremsstrahlung
------------------------------------------------------------
Parameters  : value         Lower 90%    Upper 90%
kT [keV]    : 131.336       (-76.7621      -128.659)
Norm        : 8.87933       (-2.6392     3.88339)
------------------------------------------------------------
#Fit statistic : Chi-Squared =          46.73 using 59 PHA bins.
# Reduced chi-squared =         0.8198 for     57 degrees of freedom
# Null hypothesis probability =   8.323487e-01

Energy  Fluence     90% Error
[keV]   [erg/cm2]   [erg/cm2]
15- 25  2.302e-08   1.324e-08
25- 50  4.182e-08   2.472e-08
50-150  7.790e-08   5.255e-08
15-150  1.427e-07   8.775e-08
Double BB

------------------------------------------------------------
#Fit statistic : Chi-Squared =          46.58 using 59 PHA bins.
#Fit statistic : Chi-Squared =          46.49 using 59 PHA bins.
#Fit statistic : Chi-Squared =          46.47 using 59 PHA bins.
#Fit statistic : Chi-Squared =          46.45 using 59 PHA bins.
# Reduced chi-squared =         0.8470 for     55 degrees of freedom
# Reduced chi-squared =         0.8453 for     55 degrees of freedom
# Reduced chi-squared =         0.8448 for     55 degrees of freedom
# Reduced chi-squared =         0.8446 for     55 degrees of freedom
# Null hypothesis probability =   7.832220e-01
# Null hypothesis probability =   7.860741e-01
# Null hypothesis probability =   7.868508e-01
# Null hypothesis probability =   7.873237e-01

Energy  Fluence     90% Error
[keV]   [erg/cm2]   [erg/cm2]
15- 25  2.112e-08   1.345e-08
25- 50  4.429e-08   2.462e-08
50-150  6.783e-08   4.504e-08
15-150  1.333e-07   7.590e-08
Pre-slew spectrum (Pre-slew PHA with pre-slew DRM)
Power-law model

Spectral model in power-law:
------------------------------------------------------------
Parameters  : value       lower 90%   higher 90%
Photon index: 1.58252     ( -0.197261   0.199716 )
Norm@50keV  : 9.40880E-03    ( -0.00109224   0.00108504 )
------------------------------------------------------------
#Fit statistic : Chi-Squared =          39.30 using 59 PHA bins.
# Reduced chi-squared =         0.6895 for     57 degrees of freedom
# Null hypothesis probability =   9.644334e-01

Photon flux (15-150 keV)    in 16.35 sec: 1.20262 ( -0.140216  0.1407 ) ph/cm2/s
Energy fluence (15-150 keV)             : 1.44183e-06 ( -1.78307e-07  1.79693e-07 ) ergs/cm2
Cutoff power-law model

Spectral model in the cutoff power-law:
------------------------------------------------------------
Parameters  : value       lower 90%   higher 90%
Photon index: 1.49590     ( -0.827366   1.32371 )
Epeak [keV] : 269.467      ( -306.495 -306.495 )
Norm@50keV  : 1.04228E-02    ( -0.0071392   0.0166263 )
------------------------------------------------------------
#Fit statistic : Chi-Squared =          39.28 using 59 PHA bins.
# Reduced chi-squared =         0.7015 for     56 degrees of freedom
# Null hypothesis probability =   9.560827e-01

Photon flux (15-150 keV)    in 16.35 sec: 1.19862 ( -0.14449  0.14308 ) ph/cm2/s
Energy fluence (15-150 keV)             : 1.43456e-06 ( -1.95412e-07  1.86101e-07 ) ergs/cm2
Band function

Spectral model in the Band function:
------------------------------------------------------------
Parameters  : value       lower 90%   higher 90%
alpha       :    (     )
beta        :     (     )
Epeak [keV] :       (   )
Norm@50keV   :     (     )
------------------------------------------------------------

Photon flux (15-150 keV)    in  sec:  (    ) ph/cm2/s
Energy fluence (15-150 keV)             : 0 ( 0  0 ) ergs/cm2
S(25-50 keV) vs. S(50-100 keV) plot
S(25-50 keV)  = 3.71e-07
S(50-100 keV) = 4.95e-07
T90 vs. Hardness ratio plot

T90                                   = 15.2960000038147 sec.
Hardness ratio (energy fluence ratio) = 1.33423
Color vs. Color plot
Count Ratio  (25-50 keV) / (15-25 keV) = 1.67013
Count Ratio (50-100 keV) / (15-25 keV) = 1.15985
Mask shadow pattern

IMX = -9.292220457320508E-01, IMY = 5.769502027173130E-01
TIME vs. PHA plot around the trigger time

Blue+Cyan dotted lines: Time interval of the scaled map
From 0.000000 to 16.384000
TIME vs. DetID plot around the trigger time

Blue+Cyan dotted lines: Time interval of the scaled map
From 0.000000 to 16.384000
100 us light curve (15-350 keV)

Blue+Cyan dotted lines: Time interval of the scaled map
From 0.000000 to 16.384000
Spacecraft aspect plot
Bright source in the pre-burst/pre-slew/post-slew images
Pre-burst image of 15-350 keV band
Time interval of the image:
-696.311400 -680.381100
-239.512000 -0.408000

# RAcent  DECcent POSerr Theta    Phi  PeakCts   SNR AngSep     Name
#  [deg]    [deg]    ['] [deg]  [deg]                   [']
 44.5527  71.7084    3.0  47.2  171.8   2.7098   3.8 ------	UNKNOWN
166.1027  10.2831    3.0  43.4  -23.5   1.8495   3.8 ------	UNKNOWN
174.8589   2.7522    2.8  54.2  -29.0   4.3101   4.1 ------	UNKNOWN
180.8857  13.2134    2.4  48.7  -42.8   4.8088   4.8 ------	UNKNOWN
Pre-slew background subtracted image of 15-350 keV band
Time interval of the image:
-0.408000 15.944000

# RAcent  DECcent POSerr Theta    Phi  PeakCts   SNR AngSep     Name
#  [deg]    [deg]    ['] [deg]  [deg]                   [']
248.2092  78.5009    1.0  47.6 -148.2   1.9561  12.0 ------	UNKNOWN
Post-slew image of 15-350 keV band
Time interval of the image:
213.988600 654.794800
660.488000 719.368000
720.488000 900.588600

# RAcent  DECcent POSerr Theta    Phi  PeakCts   SNR AngSep     Name
#  [deg]    [deg]    ['] [deg]  [deg]                   [']
170.2236 -60.4213    7.7  28.7   36.4   1.2132   1.5   12.4	Cen X-3
186.6769 -62.7724    0.9  23.9   21.4   9.7179  12.7    0.6	GX 301-2
244.9636 -15.6656    1.1  42.3 -117.5  22.5225  10.7    1.8	Sco X-1
256.0104 -37.8446    3.6  37.8  -80.0   5.4765   3.2    1.1	4U 1700-377
256.6074 -36.3637    5.1  38.9  -81.9   4.3685   2.2    9.0	GX 349+2
264.6316 -44.3613   14.6  41.8  -67.0   1.9073   0.8    7.1	4U 1735-44
132.9626 -59.8446    5.0  46.8   40.4   5.3623   2.3 ------	UNKNOWN
174.0616 -27.4050    4.0  29.9  107.5   3.0384   2.9 ------	UNKNOWN
323.8081 -74.2227    3.7  56.7  -17.7   7.9854   3.1 ------	UNKNOWN
225.6909  12.8515    2.4  57.5 -158.4  18.5019   4.8 ------	UNKNOWN
Plot creation:
Thu Mar 21 14:39:22 EDT 2019