Estimated redshift from machine learning (Ukwatta et al. 2016) - may take a few minutes to calcaulte
Image
Pre-slew 15.0-350.0 keV image (Event data)

#   RAcent    DECcent   POSerr    Theta     Phi              Peak Cts       SNR   Name
  131.3266    -5.4858   0.0383    23.2127  -166.2816         0.5163950      5.038 TRIG_00878504

Foreground time interval of the image:
  0.000  64.000 (delta_t =  64.000 [sec])
Background time interval of the image:
Lightcurves
Notes:
- 1) All plots contain as much data as has been downloaded to date.
- 2) The mask-weighted light curves are using the flight position.
- 3) Multiple plots of different time binning/intervals are shown to cover all scenarios of short/long GRBs, rate/image triggers, and real/false positives.
- 4) For all the mask-weighted lightcurves, the y-axis units are counts/sec/det where a det is 0.4 x 0.4 = 0.16 sq cm.
- 5) The verticle lines correspond to following: green dotted lines are T50 interval, black dotted lines are T90 interval, blue solid line(s) is a spacecraft slew start time, and orange solid line(s) is a spacecraft slew end time.
- 6) Time of each bin is in the middle of the bin.
1 s binning
From T0-310 s to T0+310 s

From T100_start - 20 s to T100_end + 30 s

Full time interval

64 ms binning
Full time interval

From T100_start to T100_end

From T0-5 sec to T0+5 sec

16 ms binning
From T100_start-5 s to T100_start+5 s

Blue+Cyan dotted lines: Time interval of the scaled map
From 0.000000 to 64.000000
8 ms binning
From T100_start-3 s to T100_start+3 s

Blue+Cyan dotted lines: Time interval of the scaled map
From 0.000000 to 64.000000
2 ms binning
From T100_start-1 s to T100_start+1 s

Blue+Cyan dotted lines: Time interval of the scaled map
From 0.000000 to 64.000000
SN=5 or 10 sec. binning (whichever binning is satisfied first)

SN=5 or 10 sec. binning (T < 200 sec)

Spectra
Notes:
- 1) The fitting includes the systematic errors.
- 2) For long bursts, a spectral fit of the pre-slew DRM will introduce some errors in both a spectral shape and a normalization if the PHA file contains a lot of the slew/post-slew time interval.
- 3) For fits to more complicated models (e.g. a power-law over a cutoff power-law), the BAT team has decided to require a chi-square improvement of more than 6 for each extra dof.
- 4) For short bursts (T90<1sec), the specrtum is also fit with Blackbody, OTTB, and Double Blackbody.
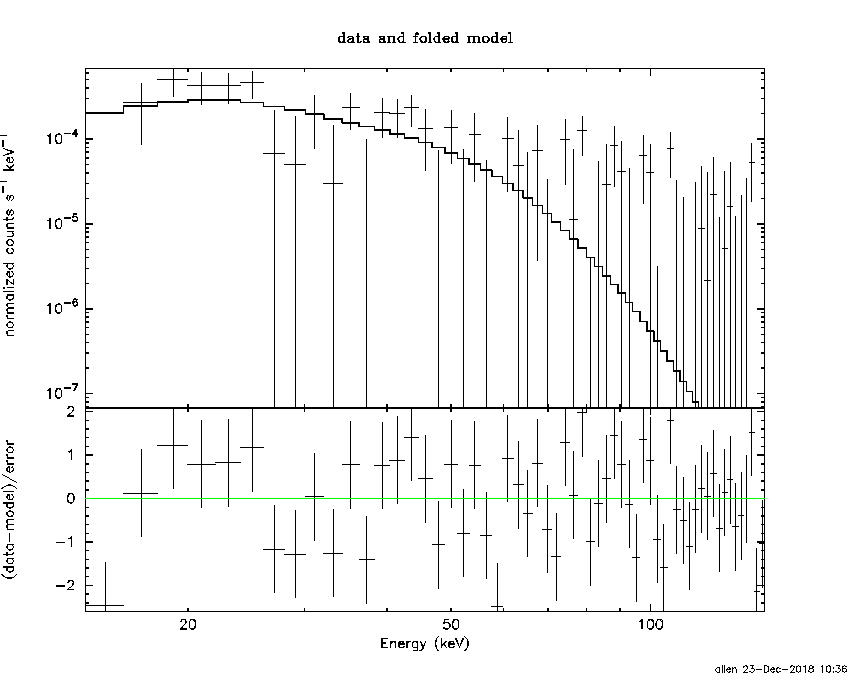
Time averaged spectrum fit using the pre-slew DRM
Power-law model

Time interval is from    0.000 sec. to   64.000 sec.

Spectral model in power-law:
------------------------------------------------------------
Parameters  : value       lower 90%   higher 90%
Photon index: 1.94801     ( -0.457814   0.518924 )
Norm@50keV  : 4.32629E-04    ( -0.000159896   0.000158871 )
------------------------------------------------------------
#Fit statistic : Chi-Squared =          71.93 using 59 PHA bins.
# Reduced chi-squared =          1.262 for     57 degrees of freedom
# Null hypothesis probability =   8.796420e-02

Photon flux (15-150 keV)    in 64 sec: 6.33960E-02 ( -0.0186562  0.0186727 ) ph/cm2/s
Energy fluence (15-150 keV)             : 2.5516e-07 ( -8.81869e-08  9.53747e-08 ) ergs/cm2
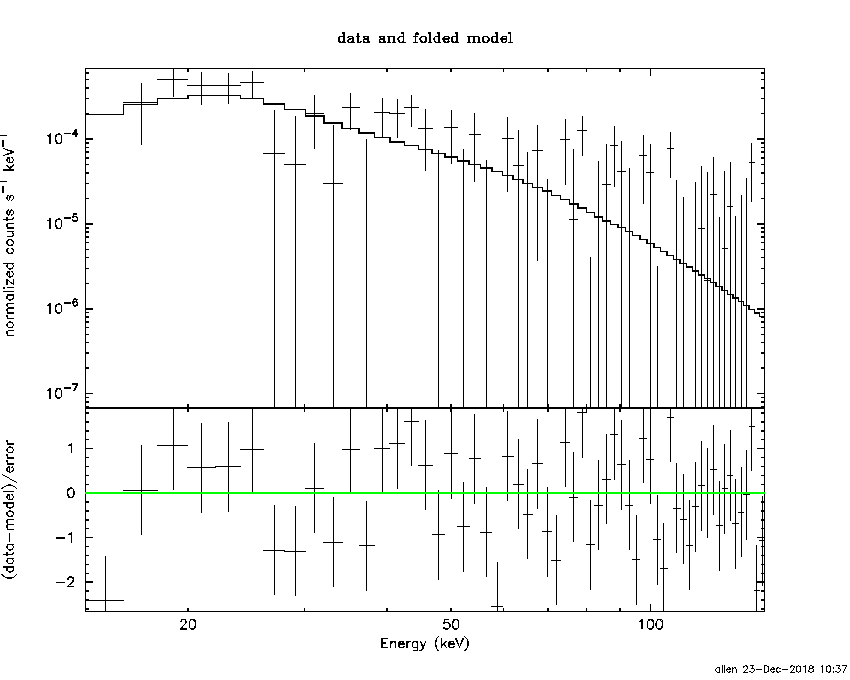
Cutoff power-law model

Time interval is from    0.000 sec. to   64.000 sec.
Spectral model in the cutoff power-law:
------------------------------------------------------------
Parameters  : value       lower 90%   higher 90%
Photon index: -1.67314     ( -5.59571   2.89312 )
Epeak [keV] : 35.0942      ( -7.98455 13.9789 )
Norm@50keV  : 9.29350E-02    ( -0.111788   550.819 )
------------------------------------------------------------
#Fit statistic : Chi-Squared =          66.74 using 59 PHA bins.
# Reduced chi-squared =          1.192 for     56 degrees of freedom
# Null hypothesis probability =   1.542000e-01

Photon flux (15-150 keV)    in 64 sec: 6.03452E-02 ( -0.017276  0.0177034 ) ph/cm2/s
Energy fluence (15-150 keV)             : 1.93631e-07 ( -6.12173e-08  8.3673e-08 ) ergs/cm2
Band function

Time interval is from    0.000 sec. to   64.000 sec.

Spectral model in the Band function:
------------------------------------------------------------
Parameters  : value       lower 90%   higher 90%
alpha       : 4.38550   ( -2.80566   -1.6194 )
beta        : -2.71821    ( 9.37167   19.3664 )
Epeak [keV] : 27.6381      ( -13.54 14.4317 )
Norm@50keV   : 16.1556    ( -16.1743   5.06127 )
------------------------------------------------------------
#Fit statistic : Chi-Squared =          66.50 using 59 PHA bins.
# Reduced chi-squared =          1.209 for     55 degrees of freedom
# Null hypothesis probability =   1.376735e-01

Photon flux (15-150 keV)    in 64 sec: 5.97381E-02 (    ) ph/cm2/s
Energy fluence (15-150 keV)             : 2.05018e-07 ( -2.0457e-07  -7.03341e-08 ) ergs/cm2
Single BB

Spectral model blackbody:
------------------------------------------------------------
Parameters  : value    Lower 90%  Upper 90%
kT [keV]    : 9.01286  (-2.07671  2.79482)
R^2/D10^2   : 4.92851E-02  (-0.0321389   0.0848568)
(R is the radius in km and D10 is the distance to the source in units of 10 kpc)
------------------------------------------------------------
#Fit statistic : Chi-Squared =          66.83 using 59 PHA bins.
# Reduced chi-squared =          1.172 for     57 degrees of freedom
# Null hypothesis probability =   1.751013e-01

Energy  Fluence     90% Error
[keV]   [erg/cm2]   [erg/cm2]
15- 25  4.992e-08   2.931e-08
25- 50  1.063e-07   6.160e-08
50-150  4.075e-08   3.064e-08
15-150  1.970e-07   1.216e-07
Thermal bremsstrahlung (OTTB)

Spectral model: thermal bremsstrahlung
------------------------------------------------------------
Parameters  : value         Lower 90%    Upper 90%
kT [keV]    : 57.5212       (-28.7863      105.323)
Norm        : 0.350204       (-0.128554     0.199583)
------------------------------------------------------------
#Fit statistic : Chi-Squared =          69.74 using 59 PHA bins.
# Reduced chi-squared =          1.224 for     57 degrees of freedom
# Null hypothesis probability =   1.198117e-01

Energy  Fluence     90% Error
[keV]   [erg/cm2]   [erg/cm2]
15- 25  5.593e-08   3.161e-08
25- 50  8.401e-08   4.828e-08
50-150  9.224e-08   7.437e-08
15-150  2.322e-07   1.467e-07
Double BB

Spectral model: bbodyrad<1> + bbodyrad<2>
------------------------------------------------------------
Parameters  : value         Lower 90%    Upper 90%
kT1 [keV]   : 8.01859        (-8.0946      -8.0946)
R1^2/D10^2  : 2.74053E-02        (-0.0278028      -0.0278028)
kT2 [keV]   : 9.65062        (-9.6596      -9.6596)
R2^2/D10^2  : 2.48508E-02    (-0.0191119   -0.0191119)
------------------------------------------------------------
#Fit statistic : Chi-Squared =          66.83 using 59 PHA bins.
# Reduced chi-squared =          1.215 for     55 degrees of freedom
# Null hypothesis probability =   1.316906e-01

Energy  Fluence     90% Error
[keV]   [erg/cm2]   [erg/cm2]
15- 25  5.020e-08   1.757e-04
25- 50  1.062e-07   1.365e-03
50-150  4.258e-08   3.232e-02
15-150  1.990e-07   3.277e-02
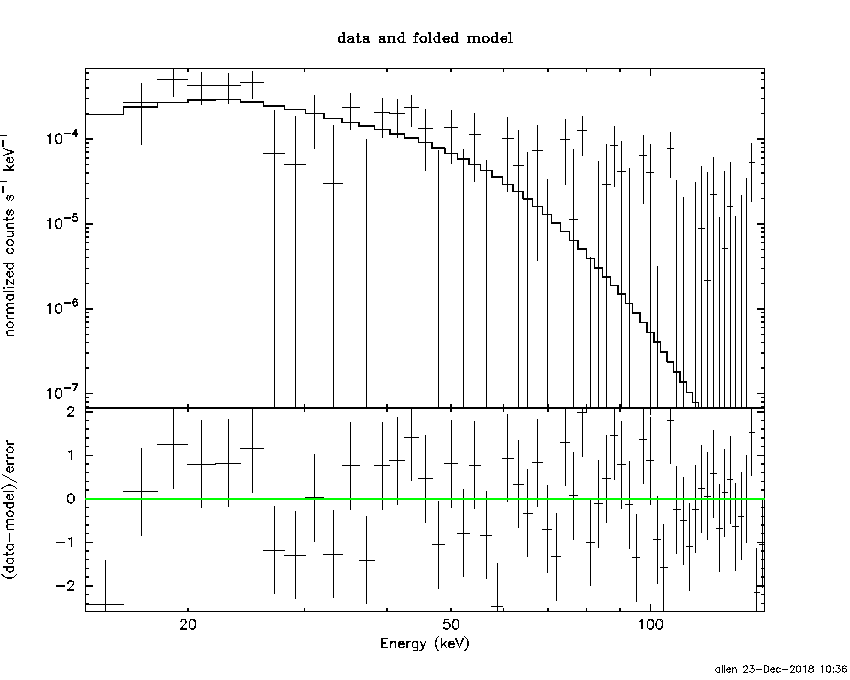
Peak spectrum fit
Power-law model

Time interval is from    0.000 sec. to   64.000 sec.

Spectral model in power-law:
------------------------------------------------------------
Parameters  : value       lower 90%   higher 90%
Photon index: 1.94801     ( -0.457814   0.518924 )
Norm@50keV  : 4.32629E-04    ( -0.000159896   0.000158871 )
------------------------------------------------------------
#Fit statistic : Chi-Squared =          71.93 using 59 PHA bins.
# Reduced chi-squared =          1.262 for     57 degrees of freedom
# Null hypothesis probability =   8.796420e-02

Photon flux (15-150 keV)    in 64 sec: 6.33960E-02 ( -0.0186562  0.0186727 ) ph/cm2/s
Energy fluence (15-150 keV)             : 2.5516e-07 ( -8.81869e-08  9.53747e-08 ) ergs/cm2
Cutoff power-law model

Time interval is from    0.000 sec. to   64.000 sec.
Spectral model in the cutoff power-law:
------------------------------------------------------------
Parameters  : value       lower 90%   higher 90%
Photon index: -1.67314     ( -5.59571   2.89312 )
Epeak [keV] : 35.0942      ( -7.98455 13.9789 )
Norm@50keV  : 9.29350E-02    ( -0.111788   550.819 )
------------------------------------------------------------
#Fit statistic : Chi-Squared =          66.74 using 59 PHA bins.
# Reduced chi-squared =          1.192 for     56 degrees of freedom
# Null hypothesis probability =   1.542000e-01

Photon flux (15-150 keV)    in 64 sec: 6.03452E-02 ( -0.017276  0.0177034 ) ph/cm2/s
Energy fluence (15-150 keV)             : 1.93631e-07 ( -6.12173e-08  8.3673e-08 ) ergs/cm2
Band function

Time interval is from    0.000 sec. to   64.000 sec.

Spectral model in the Band function:
------------------------------------------------------------
Parameters  : value       lower 90%   higher 90%
alpha       : 4.38550   ( -2.80566   -1.6194 )
beta        : -2.71821    ( 9.37167   19.3664 )
Epeak [keV] : 27.6381      ( -13.54 14.4314 )
Norm@50keV   : 16.1556    ( -16.1743   5.06127 )
------------------------------------------------------------
#Fit statistic : Chi-Squared =          66.50 using 59 PHA bins.
# Reduced chi-squared =          1.209 for     55 degrees of freedom
# Null hypothesis probability =   1.376735e-01

Photon flux (15-150 keV)    in 64 sec: 5.97381E-02 (    ) ph/cm2/s
Energy fluence (15-150 keV)             : 2.05018e-07 ( -2.0457e-07  -7.03341e-08 ) ergs/cm2
Single BB
Spectral model blackbody:
------------------------------------------------------------
Parameters  : value    Lower 90%  Upper 90%
kT [keV]    : 9.01286  (-2.07671  2.79482)
R^2/D10^2   : 4.92851E-02  (-0.0321389   0.0848568)
(R is the radius in km and D10 is the distance to the source in units of 10 kpc)
------------------------------------------------------------
#Fit statistic : Chi-Squared =          66.83 using 59 PHA bins.
# Reduced chi-squared =          1.172 for     57 degrees of freedom
# Null hypothesis probability =   1.751013e-01

Energy  Fluence     90% Error
[keV]   [erg/cm2]   [erg/cm2]
15- 25  4.992e-08   2.602e-08
25- 50  1.063e-07   5.883e-08
50-150  4.075e-08   3.101e-08
15-150  1.970e-07   1.224e-07
Thermal bremsstrahlung (OTTB)

Spectral model: thermal bremsstrahlung
------------------------------------------------------------
Parameters  : value         Lower 90%    Upper 90%
kT [keV]    : 57.5212       (-28.7863      105.323)
Norm        : 0.350204       (-0.128554     0.199583)
------------------------------------------------------------
#Fit statistic : Chi-Squared =          69.74 using 59 PHA bins.
# Reduced chi-squared =          1.224 for     57 degrees of freedom
# Null hypothesis probability =   1.198117e-01

Energy  Fluence     90% Error
[keV]   [erg/cm2]   [erg/cm2]
15- 25  5.593e-08   3.385e-08
25- 50  8.401e-08   5.042e-08
50-150  9.224e-08   7.465e-08
15-150  2.322e-07   1.414e-07
Double BB

Spectral model: bbodyrad<1> + bbodyrad<2>
------------------------------------------------------------
Parameters  : value         Lower 90%    Upper 90%
kT1 [keV]   : 8.01859        (-8.0946      -8.0946)
R1^2/D10^2  : 2.74053E-02        (-0.0278028      -0.0278028)
kT2 [keV]   : 9.65062        (-9.6596      -9.6596)
R2^2/D10^2  : 2.48508E-02    (-0.0191119   -0.0191119)
------------------------------------------------------------
#Fit statistic : Chi-Squared =          66.83 using 59 PHA bins.
# Reduced chi-squared =          1.215 for     55 degrees of freedom
# Null hypothesis probability =   1.316906e-01

Energy  Fluence     90% Error
[keV]   [erg/cm2]   [erg/cm2]
15- 25  5.020e-08   1.612e-04
25- 50  1.062e-07   1.490e-03
50-150  4.258e-08   3.076e-02
15-150  1.990e-07   3.450e-02
Pre-slew spectrum (Pre-slew PHA with pre-slew DRM)
Power-law model
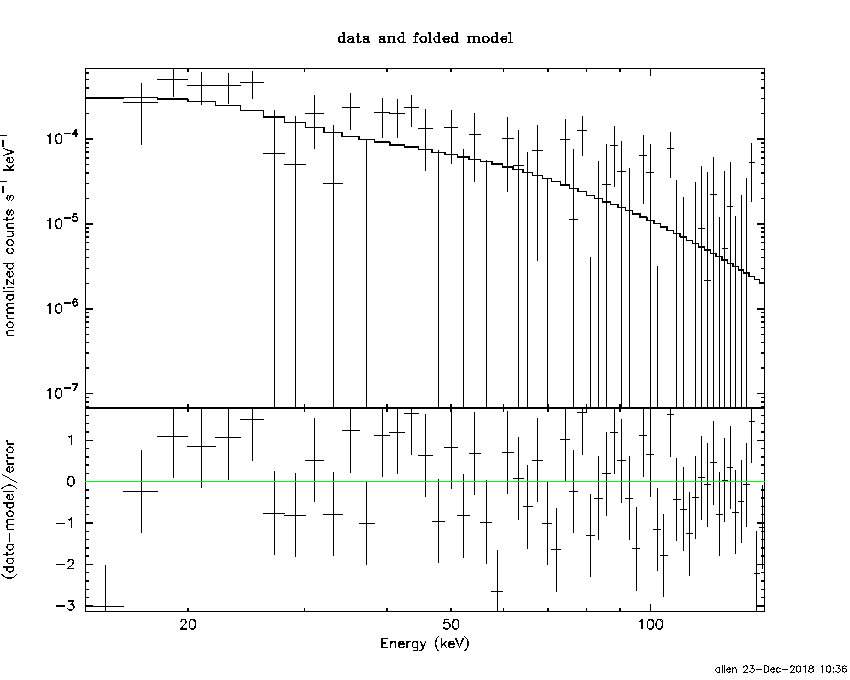
Spectral model in power-law:
------------------------------------------------------------
Parameters  : value       lower 90%   higher 90%
Photon index: 1.94801     ( -0.457814   0.518924 )
Norm@50keV  : 4.32629E-04    ( -0.000159896   0.000158871 )
------------------------------------------------------------
#Fit statistic : Chi-Squared =          71.93 using 59 PHA bins.
# Reduced chi-squared =          1.262 for     57 degrees of freedom
# Null hypothesis probability =   8.796420e-02

Photon flux (15-150 keV)    in 64 sec: 6.33960E-02 ( -0.0186562  0.0186727 ) ph/cm2/s
Energy fluence (15-150 keV)             : 2.5516e-07 ( -8.81869e-08  9.53747e-08 ) ergs/cm2
Cutoff power-law model
Spectral model in the cutoff power-law:
------------------------------------------------------------
Parameters  : value       lower 90%   higher 90%
Photon index: -1.67314     ( -5.59571   2.89312 )
Epeak [keV] : 35.0942      ( -7.98455 13.9789 )
Norm@50keV  : 9.29350E-02    ( -0.111788   550.819 )
------------------------------------------------------------
#Fit statistic : Chi-Squared =          66.74 using 59 PHA bins.
# Reduced chi-squared =          1.192 for     56 degrees of freedom
# Null hypothesis probability =   1.542000e-01

Photon flux (15-150 keV)    in 64 sec: 6.03452E-02 ( -0.017276  0.0177034 ) ph/cm2/s
Energy fluence (15-150 keV)             : 1.93631e-07 ( -6.12173e-08  8.3673e-08 ) ergs/cm2
Band function
Spectral model in the Band function:
------------------------------------------------------------
Parameters  : value       lower 90%   higher 90%
alpha       : 4.38550   ( -2.80566   -1.6194 )
beta        : -2.71821    ( 9.37167   19.3664 )
Epeak [keV] : 27.6381      ( -13.54 14.4314 )
Norm@50keV   : 16.1556    ( -16.1743   5.06127 )
------------------------------------------------------------
#Fit statistic : Chi-Squared =          66.50 using 59 PHA bins.
# Reduced chi-squared =          1.209 for     55 degrees of freedom
# Null hypothesis probability =   1.376735e-01

Photon flux (15-150 keV)    in 64 sec: 5.97381E-02 (    ) ph/cm2/s
Energy fluence (15-150 keV)             : 2.05018e-07 ( -2.0457e-07  -7.03341e-08 ) ergs/cm2
S(25-50 keV) vs. S(50-100 keV) plot

S(25-50 keV)  = 7.55e-08
S(50-100 keV) = 7.85e-08
T90 vs. Hardness ratio plot

T90                                   = 64 sec.
Hardness ratio (energy fluence ratio) = 1.03974
Color vs. Color plot

Count Ratio  (25-50 keV) / (15-25 keV) = 1.08041
Count Ratio (50-100 keV) / (15-25 keV) = 0.274676
Mask shadow pattern

IMX = -4.166288316581853E-01, IMY = 1.017047495321999E-01
TIME vs. PHA plot around the trigger time

Blue+Cyan dotted lines: Time interval of the scaled map
From 0.000000 to 64.000000
TIME vs. DetID plot around the trigger time

Blue+Cyan dotted lines: Time interval of the scaled map
From 0.000000 to 64.000000
100 us light curve (15-350 keV)

Blue+Cyan dotted lines: Time interval of the scaled map
From 0.000000 to 64.000000
Spacecraft aspect plot

Bright source in the pre-burst/pre-slew/post-slew images
Pre-burst image of 15-350 keV band
Time interval of the image:
Pre-slew background subtracted image of 15-350 keV band
Time interval of the image:
0.000000 64.000000

# RAcent  DECcent POSerr Theta    Phi  PeakCts   SNR AngSep     Name
#  [deg]    [deg]    ['] [deg]  [deg]                   [']
 83.5923  21.9946    1.8  39.4   73.6   3.0533   6.3    2.6	Crab
135.7518 -40.6154    0.0  39.9 -102.1   0.1828   0.5   10.8	Vela X-1
113.9821  31.5297    3.0  41.0  118.6   1.8129   3.8 ------	UNKNOWN
 81.1992 -47.0800    2.0  44.4  -42.7   1.2104   5.7 ------	UNKNOWN
Post-slew image of 15-350 keV band
Time interval of the image:
127.900600 963.101400

# RAcent  DECcent POSerr Theta    Phi  PeakCts   SNR AngSep     Name
#  [deg]    [deg]    ['] [deg]  [deg]                   [']
135.5093 -40.6020    3.1  35.3  -43.2   2.9561   3.7    3.0	Vela X-1
 87.8146 -35.6741    2.9  50.1    9.1   5.5129   4.0 ------	UNKNOWN
117.3811 -46.6307    4.3  42.9  -23.6   3.0830   2.7 ------	UNKNOWN
179.9976   7.0915    2.6  50.1 -141.8   8.2495   4.4 ------	UNKNOWN
179.4447  -2.6789    3.0  48.0 -129.1  10.2466   3.9 ------	UNKNOWN
Plot creation:
Sun Dec 23 10:37:32 EST 2018