Estimated redshift from machine learning (Ukwatta et al. 2016) - may take a few minute to calcaulte
Image
Pre-slew 15.0-350.0 keV image (Event data)

#   RAcent    DECcent   POSerr    Theta     Phi              Peak Cts       SNR   Name
   49.8314    13.2108   0.0043    32.8476   114.5651        12.2585964     45.031 TRIG_00879909

Foreground time interval of the image:
 -3.984  14.525 (delta_t =  18.509 [sec])
Background time interval of the image:
-239.776  -3.984 (delta_t = 235.792 [sec])
Lightcurves
Notes:
- 1) The mask-weighted light curves are using the flight position.
- 2) Multiple plots of different time binning/intervals are shown to cover all scenarios of short/long GRBs, rate/image triggers, and real/false positives.
- 3) For all the mask-weighted lightcurves, the y-axis units are counts/sec/det where a det is 0.4 x 0.4 = 0.16 sq cm.
- 4) The verticle lines correspond to following: green dotted lines are T50 interval, black dotted lines are T90 interval, blue solid line(s) is a spacecraft slew start time, and orange solid line(s) is a spacecraft slew end time.
- 5) Time of each bin is in the middle of the bin.
1 s binning
From T0-310 s to T0+310 s

From T100_start - 20 s to T100_end + 30 s

Full time interval

64 ms binning
Full time interval

From T100_start to T100_end

From T0-5 sec to T0+5 sec

16 ms binning
From T100_start-5 s to T100_start+5 s

Blue+Cyan dotted lines: Time interval of the scaled map
From 0.000000 to 1.024000
8 ms binning
From T100_start-3 s to T100_start+3 s

Blue+Cyan dotted lines: Time interval of the scaled map
From 0.000000 to 1.024000
2 ms binning
From T100_start-1 s to T100_start+1 s

Blue+Cyan dotted lines: Time interval of the scaled map
From 0.000000 to 1.024000
SN=5 or 10 sec. binning (whichever binning is satisfied first)

SN=5 or 10 sec. binning (T < 200 sec)

Quad-rate summed light curves (from T0-300s to T0+1000s)

Spectral Evolution

Spectra
Notes:
- 1) The fitting includes the systematic errors.
- 2) When the burst includes telescope slew time periods, the fitting uses an average response file made from multiple 5-s response files through out the slew time plus single time preiod for the non-slew times, and weighted by the total counts in the corresponding time period using addrmf. An average response file is needed becuase a spectral fit using the pre-slew DRM will introduce some errors in both a spectral shape and a normalization if the PHA file contains a lot of the slew/post-slew time interval.
- 3) For fits to more complicated models (e.g. a power-law over a cutoff power-law), the BAT team has decided to require a chi-square improvement of more than 6 for each extra dof.
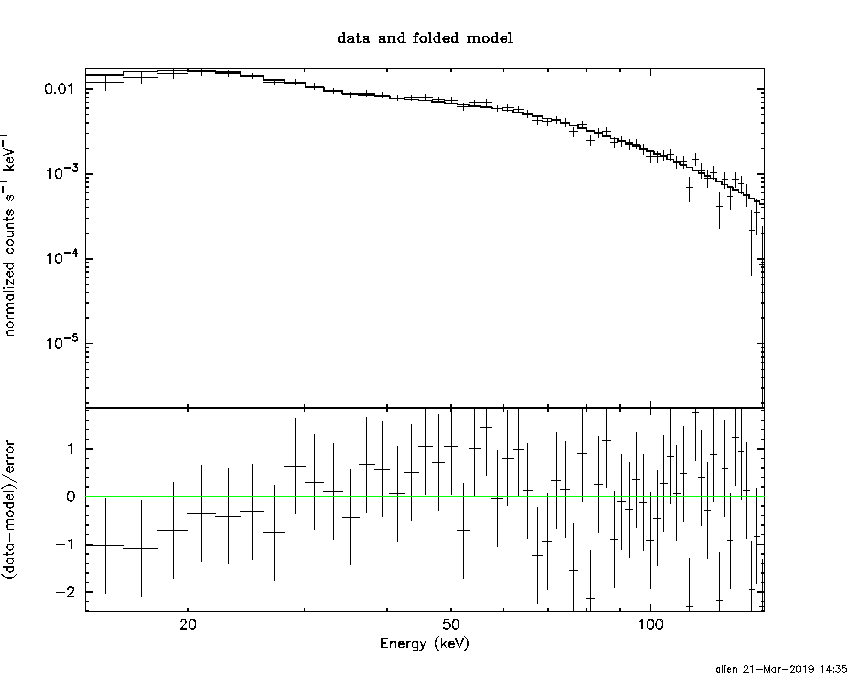
Time averaged spectrum fit using the average DRM
Power-law model

Time interval is from   -3.984 sec. to  337.936 sec.

Spectral model in power-law:
------------------------------------------------------------
Parameters  : value       lower 90%   higher 90%
Photon index: 1.44179     ( -0.0559262   0.0559068 )
Norm@50keV  : 3.16604E-03    ( -9.35941e-05   9.35892e-05 )
------------------------------------------------------------
#Fit statistic : Chi-Squared =          52.69 using 59 PHA bins.
# Reduced chi-squared =         0.9243 for     57 degrees of freedom
# Null hypothesis probability =   6.374903e-01

Photon flux (15-150 keV)    in 341.9 sec: 0.389391 ( -0.012515  0.012547 ) ph/cm2/s
Energy fluence (15-150 keV)             : 1.03755e-05 ( -3.28209e-07  3.28818e-07 ) ergs/cm2
Cutoff power-law model

Time interval is from   -3.984 sec. to  337.936 sec.
Spectral model in the cutoff power-law:
------------------------------------------------------------
Parameters  : value       lower 90%   higher 90%
Photon index: 1.24062     ( -0.226753   0.212972 )
Epeak [keV] : 205.684      ( -80.5734 -205.684 )
Norm@50keV  : 3.92176E-03    ( -0.000773815   0.00103748 )
------------------------------------------------------------
#Fit statistic : Chi-Squared =          50.15 using 59 PHA bins.
# Reduced chi-squared =         0.8956 for     56 degrees of freedom
# Null hypothesis probability =   6.947670e-01

Photon flux (15-150 keV)    in 341.9 sec: 0.383942 ( -0.013709  0.013747 ) ph/cm2/s
Energy fluence (15-150 keV)             : 1.02303e-05 ( -3.64831e-07  3.62917e-07 ) ergs/cm2
Band function

Time interval is from   -3.984 sec. to  337.936 sec.


Spectral model in the Band function:
------------------------------------------------------------
Parameters  : value       lower 90%   higher 90%
alpha       :    (     )
beta        :     (     )
Epeak [keV] :       (   )
Norm@50keV   :     (     )
------------------------------------------------------------

Photon flux (15-150 keV)    in  sec:  (    ) ph/cm2/s
Energy fluence (15-150 keV)             : 0 ( 0  0 ) ergs/cm2
Single BB

Spectral model blackbody:
------------------------------------------------------------
Parameters  : value    Lower 90%  Upper 90%
kT [keV]    : 16.9142  (  )
R^2/D10^2   : 2.85600E-02  (   )
(R is the radius in km and D10 is the distance to the source in units of 10 kpc)
------------------------------------------------------------
#Fit statistic : Chi-Squared =         272.20 using 59 PHA bins.
# Reduced chi-squared =         4.7754 for     57 degrees of freedom
# Null hypothesis probability =   8.175184e-30

Energy  Fluence     90% Error
[keV]   [erg/cm2]   [erg/cm2]
15- 25  5.697e-07   3.504e-08
25- 50  2.511e-06   1.014e-07
50-150  5.120e-06   2.872e-07
15-150  8.200e-06   2.718e-07
Thermal bremsstrahlung (OTTB)

Spectral model: thermal bremsstrahlung
------------------------------------------------------------
Parameters  : value         Lower 90%    Upper 90%
kT [keV]    : 200.000       (-7.65778      -200)
Norm        : 1.61170       (-0.0477312     0.0477312)
------------------------------------------------------------
#Fit statistic : Chi-Squared =          66.75 using 59 PHA bins.
# Reduced chi-squared =          1.171 for     57 degrees of freedom
# Null hypothesis probability =   1.769506e-01

Energy  Fluence     90% Error
[keV]   [erg/cm2]   [erg/cm2]
15- 25  1.372e-06   4.325e-08
25- 50  2.640e-06   8.462e-08
50-150  5.790e-06   1.863e-07
15-150  9.803e-06   3.094e-07
Double BB

Spectral model: bbodyrad<1> + bbodyrad<2>
------------------------------------------------------------
Parameters  : value         Lower 90%    Upper 90%
kT1 [keV]   : 8.07544        (-0.941916      0.988085)
R1^2/D10^2  : 0.233906        (-0.0711849      0.118197)
kT2 [keV]   : 30.4904        (-3.64533      5.15804)
R2^2/D10^2  : 3.02542E-03    (-0.00124368   0.00173664)
------------------------------------------------------------
#Fit statistic : Chi-Squared =          55.77 using 59 PHA bins.
# Reduced chi-squared =          1.014 for     55 degrees of freedom
# Null hypothesis probability =   4.455095e-01

Energy  Fluence     90% Error
[keV]   [erg/cm2]   [erg/cm2]
15- 25  1.099e-06   1.270e-07
25- 50  2.614e-06   1.923e-07
50-150  6.492e-06   6.582e-07
15-150  1.020e-05   9.009e-07
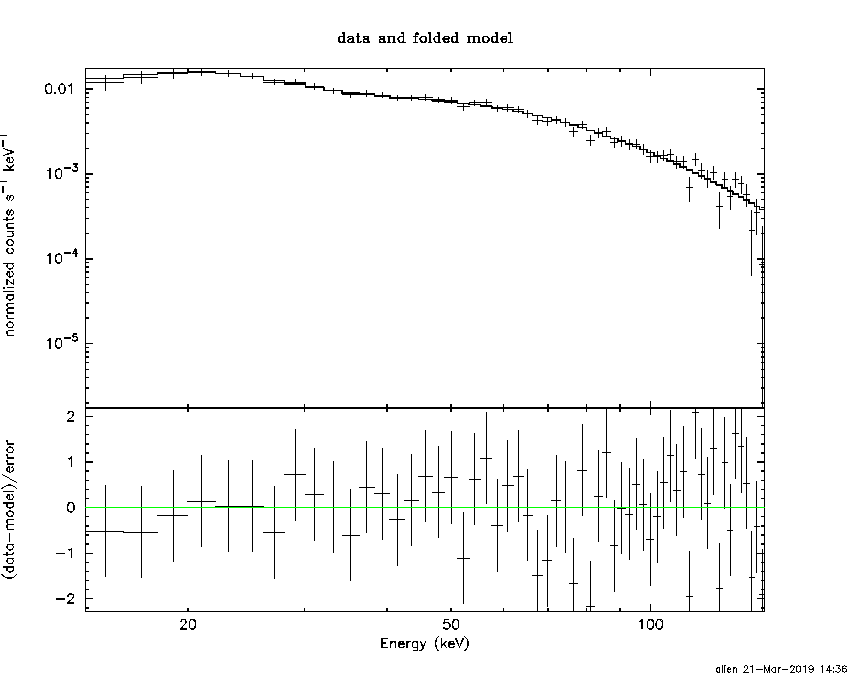
Peak spectrum fit
Power-law model

Time interval is from   13.076 sec. to   14.076 sec.

Spectral model in power-law:
------------------------------------------------------------
Parameters  : value       lower 90%   higher 90%
Photon index: 1.12941     ( -0.0999643   0.099488 )
Norm@50keV  : 8.14224E-02    ( -0.0044288   0.00442809 )
------------------------------------------------------------
#Fit statistic : Chi-Squared =          44.59 using 59 PHA bins.
# Reduced chi-squared =         0.7822 for     57 degrees of freedom
# Null hypothesis probability =   8.841781e-01

Photon flux (15-150 keV)    in 1 sec: 0.391955 (    ) ph/cm2/s
Energy fluence (15-150 keV)             : 8.43568e-07 ( -5.17051e-08  5.19205e-08 ) ergs/cm2
Cutoff power-law model

Time interval is from   13.076 sec. to   14.076 sec.
Spectral model in the cutoff power-law:
------------------------------------------------------------
Parameters  : value       lower 90%   higher 90%
Photon index: 1.12453     ( -0.219001   0.146512 )
Epeak [keV] : 9999.17      ( -9999.18 -9999.18 )
Norm@50keV  : 8.18463E-02    ( -0.00444841   0.0123419 )
------------------------------------------------------------
#Fit statistic : Chi-Squared =          44.62 using 59 PHA bins.
# Reduced chi-squared =         0.7968 for     56 degrees of freedom
# Null hypothesis probability =   8.630299e-01

Photon flux (15-150 keV)    in 1 sec: 9.53318 ( -0.59109  0.46742 ) ph/cm2/s
Energy fluence (15-150 keV)             : 2.10892e-07 ( -3.17201e-08  2.11999e-08 ) ergs/cm2
Band function

Time interval is from   13.076 sec. to   14.076 sec.


Spectral model in the Band function:
------------------------------------------------------------
Parameters  : value       lower 90%   higher 90%
alpha       :    (     )
beta        :     (     )
Epeak [keV] :       (   )
Norm@50keV   :     (     )
------------------------------------------------------------

Photon flux (15-150 keV)    in  sec:  (    ) ph/cm2/s
Energy fluence (15-150 keV)             : 0 ( 0  0 ) ergs/cm2
Single BB

Spectral model blackbody:
------------------------------------------------------------
Parameters  : value    Lower 90%  Upper 90%
kT [keV]    : 20.8819  (  )
R^2/D10^2   : 0.381063  (   )
(R is the radius in km and D10 is the distance to the source in units of 10 kpc)
------------------------------------------------------------
#Fit statistic : Chi-Squared =         132.60 using 59 PHA bins.
# Reduced chi-squared =         2.3264 for     57 degrees of freedom
# Null hypothesis probability =   5.809408e-08

Energy  Fluence     90% Error
[keV]   [erg/cm2]   [erg/cm2]
15- 25  3.147e-08   3.730e-09
25- 50  1.612e-07   1.270e-08
50-150  5.236e-07   5.075e-08
15-150  7.163e-07   5.040e-08
Thermal bremsstrahlung (OTTB)

Spectral model: thermal bremsstrahlung
------------------------------------------------------------
Parameters  : value         Lower 90%    Upper 90%
kT [keV]    : 200.000       (-8.75981      -200)
Norm        : 38.7439       (-2.16912     2.16912)
------------------------------------------------------------
#Fit statistic : Chi-Squared =          97.04 using 59 PHA bins.
# Reduced chi-squared =          1.702 for     57 degrees of freedom
# Null hypothesis probability =   7.471357e-04

Energy  Fluence     90% Error
[keV]   [erg/cm2]   [erg/cm2]
15- 25  9.645e-08   5.945e-09
25- 50  1.855e-07   1.240e-08
50-150  4.069e-07   7.745e-08
15-150  6.889e-07   8.995e-08
Double BB

Spectral model: bbodyrad<1> + bbodyrad<2>
------------------------------------------------------------
Parameters  : value         Lower 90%    Upper 90%
kT1 [keV]   : 7.11619        (-1.27353      1.52388)
R1^2/D10^2  : 7.76588        (-3.69481      7.98055)
kT2 [keV]   : 35.1712        (-5.49886      8.72069)
R2^2/D10^2  : 6.56384E-02    (-0.0312656   0.04567)
------------------------------------------------------------
#Fit statistic : Chi-Squared =          43.30 using 59 PHA bins.
# Reduced chi-squared =         0.7873 for     55 degrees of freedom
# Null hypothesis probability =   8.731706e-01

Energy  Fluence     90% Error
[keV]   [erg/cm2]   [erg/cm2]
15- 25  7.571e-08   1.995e-08
25- 50  1.659e-07   2.390e-08
50-150  6.218e-07   1.223e-07
15-150  8.634e-07   1.247e-07
Pre-slew spectrum (Pre-slew PHA with pre-slew DRM)
Power-law model
Spectral model in power-law:
------------------------------------------------------------
Parameters  : value       lower 90%   higher 90%
Photon index: 1.35701     ( -0.0418317   0.0417783 )
Norm@50keV  : 4.51970E-02    ( -0.00101926   0.00101902 )
------------------------------------------------------------
#Fit statistic : Chi-Squared =          55.96 using 59 PHA bins.
# Reduced chi-squared =         0.9817 for     57 degrees of freedom
# Null hypothesis probability =   5.142700e-01

Photon flux (15-150 keV)    in 18.51 sec: 5.45285 ( -0.136022  0.136362 ) ph/cm2/s
Energy fluence (15-150 keV)             : 8.15808e-06 ( -1.91664e-07  1.91819e-07 ) ergs/cm2
Cutoff power-law model
Spectral model in the cutoff power-law:
------------------------------------------------------------
Parameters  : value       lower 90%   higher 90%
Photon index: 1.11881     ( -0.173   0.16656 )
Epeak [keV] : 213.573      ( -65.577 327.924 )
Norm@50keV  : 5.74748E-02    ( -0.00868683   0.0106445 )
------------------------------------------------------------
#Fit statistic : Chi-Squared =          49.92 using 59 PHA bins.
# Reduced chi-squared =         0.8915 for     56 degrees of freedom
# Null hypothesis probability =   7.028925e-01

Photon flux (15-150 keV)    in 18.51 sec: 5.36260 ( -0.14803  0.14863 ) ph/cm2/s
Energy fluence (15-150 keV)             : 8.06194e-06 ( -2.05868e-07  2.04795e-07 ) ergs/cm2
Band function

Spectral model in the Band function:
------------------------------------------------------------
Parameters  : value       lower 90%   higher 90%
alpha       :    (     )
beta        :     (     )
Epeak [keV] :       (   )
Norm@50keV   :     (     )
------------------------------------------------------------

Photon flux (15-150 keV)    in  sec:  (    ) ph/cm2/s
Energy fluence (15-150 keV)             : 0 ( 0  0 ) ergs/cm2
S(25-50 keV) vs. S(50-100 keV) plot

S(25-50 keV)  = 2.49e-06
S(50-100 keV) = 3.66e-06
T90 vs. Hardness ratio plot

T90                                   = 255.152000069618 sec.
Hardness ratio (energy fluence ratio) = 1.46988
Color vs. Color plot

Count Ratio  (25-50 keV) / (15-25 keV) = 1.48979
Count Ratio (50-100 keV) / (15-25 keV) = 1.18751
Mask shadow pattern

IMX = -2.684074174296271E-01, IMY = -5.871966875140635E-01
TIME vs. PHA plot around the trigger time

Blue+Cyan dotted lines: Time interval of the scaled map
From 0.000000 to 1.024000
TIME vs. DetID plot around the trigger time

Blue+Cyan dotted lines: Time interval of the scaled map
From 0.000000 to 1.024000
100 us light curve (15-350 keV)

Blue+Cyan dotted lines: Time interval of the scaled map
From 0.000000 to 1.024000
Spacecraft aspect plot

Bright source in the pre-burst/pre-slew/post-slew images
Pre-burst image of 15-350 keV band
Time interval of the image:
-239.776000 -3.984000

# RAcent  DECcent POSerr Theta    Phi  PeakCts   SNR AngSep     Name
#  [deg]    [deg]    ['] [deg]  [deg]                   [']
326.2310  38.3032    8.3  45.3  -46.4   0.9755   1.4    3.0	Cyg X-2
 40.9219  61.4473    1.0  41.4   29.4   5.4240  11.8 ------	UNKNOWN
  1.0458   7.5685    3.1  22.0 -121.6   1.0171   3.7  458.4	UNKNOWN
345.5597  22.1046    2.5  28.8  -74.2   1.5776   4.6 ------	UNKNOWN
  7.4523 -33.3622    2.8  57.5 -158.5   6.2320   4.0 ------	UNKNOWN
Pre-slew background subtracted image of 15-350 keV band
Time interval of the image:
-3.984000 14.524600

# RAcent  DECcent POSerr Theta    Phi  PeakCts   SNR AngSep     Name
#  [deg]    [deg]    ['] [deg]  [deg]                   [']
325.9981  38.2962   10.4  45.5  -46.4  -0.2881  -1.1    8.3	Cyg X-2
 49.8314  13.2108    0.3  32.8  114.6  12.2580  45.0 ------	UNKNOWN
 49.9414  24.2427    2.8  30.2   94.0   0.9531   4.1 ------	UNKNOWN
 45.5158  38.4625    4.1  28.6   63.9   0.5319   2.9 ------	UNKNOWN
 39.7592  30.8794    2.3  21.6   77.2   0.7236   4.9 ------	UNKNOWN
335.9956  58.2795    2.8  45.3  -16.7   0.7277   4.2 ------	UNKNOWN
Post-slew image of 15-350 keV band
Time interval of the image:
71.124600 962.314000

# RAcent  DECcent POSerr Theta    Phi  PeakCts   SNR AngSep     Name
#  [deg]    [deg]    ['] [deg]  [deg]                   [']
 83.6269  22.0136    0.5  33.3   89.9  34.6751  21.9    0.4	Crab
 40.9509  61.4630    1.1  48.7   14.4  18.4075  10.4 ------	UNKNOWN
  8.3181  61.7510    2.8  56.9   -2.0  12.4929   4.1 ------	UNKNOWN
358.4149  57.8487    3.1  58.9   -9.1  12.6686   3.8 ------	UNKNOWN
Plot creation:
Thu Mar 21 14:36:38 EDT 2019