Estimated redshift from machine learning (Ukwatta et al. 2016) - may take a few minute to calcaulte
Image
Pre-slew 15.0-350.0 keV image (Event data)
#   RAcent    DECcent   POSerr    Theta     Phi              Peak Cts       SNR   Name
  212.5609    35.2539   0.0094    48.5950   143.7816        19.1008849     20.410 TRIG_00881709

Foreground time interval of the image:
-10.432  16.176 (delta_t =  26.608 [sec])
Background time interval of the image:
-239.376 -10.432 (delta_t = 228.944 [sec])
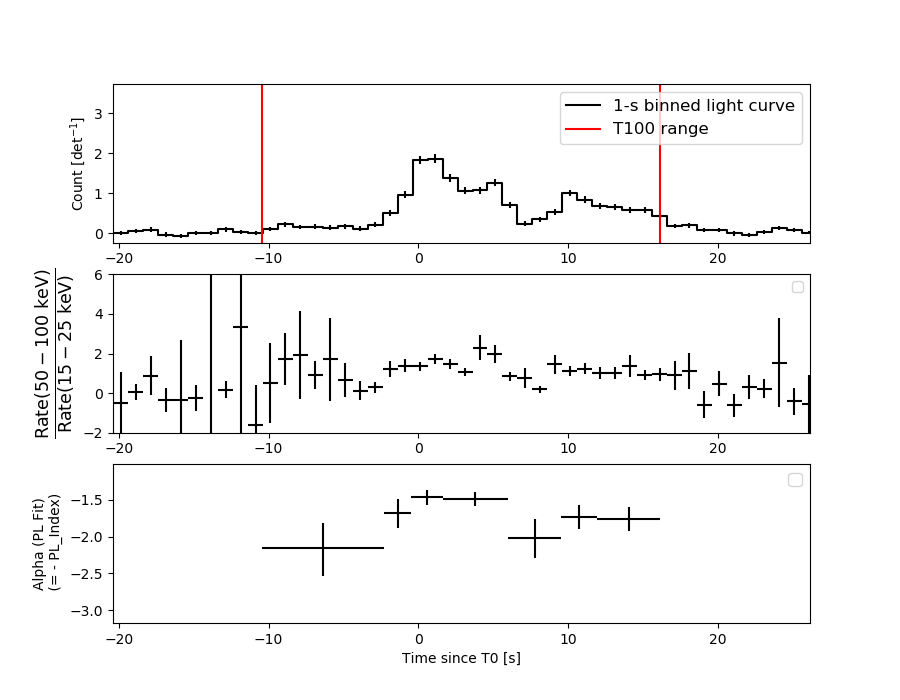
Lightcurves
Notes:
- 1) The mask-weighted light curves are using the flight position.
- 2) Multiple plots of different time binning/intervals are shown to cover all scenarios of short/long GRBs, rate/image triggers, and real/false positives.
- 3) For all the mask-weighted lightcurves, the y-axis units are counts/sec/det where a det is 0.4 x 0.4 = 0.16 sq cm.
- 4) The verticle lines correspond to following: green dotted lines are T50 interval, black dotted lines are T90 interval, blue solid line(s) is a spacecraft slew start time, and orange solid line(s) is a spacecraft slew end time.
- 5) Time of each bin is in the middle of the bin.
1 s binning
From T0-310 s to T0+310 s

From T100_start - 20 s to T100_end + 30 s

Full time interval

64 ms binning
Full time interval

From T100_start to T100_end
From T0-5 sec to T0+5 sec
16 ms binning
From T100_start-5 s to T100_start+5 s
8 ms binning
From T100_start-3 s to T100_start+3 s

2 ms binning
From T100_start-1 s to T100_start+1 s
SN=5 or 10 sec. binning (whichever binning is satisfied first)

SN=5 or 10 sec. binning (T < 200 sec)

Quad-rate summed light curves (from T0-300s to T0+1000s)

Spectral Evolution
Spectra
Notes:
- 1) The fitting includes the systematic errors.
- 2) When the burst includes telescope slew time periods, the fitting uses an average response file made from multiple 5-s response files through out the slew time plus single time preiod for the non-slew times, and weighted by the total counts in the corresponding time period using addrmf. An average response file is needed becuase a spectral fit using the pre-slew DRM will introduce some errors in both a spectral shape and a normalization if the PHA file contains a lot of the slew/post-slew time interval.
- 3) For fits to more complicated models (e.g. a power-law over a cutoff power-law), the BAT team has decided to require a chi-square improvement of more than 6 for each extra dof.
Time averaged spectrum fit using the average DRM
Power-law model

Time interval is from  -10.432 sec. to   16.176 sec.

Spectral model in power-law:
------------------------------------------------------------
Parameters  : value       lower 90%   higher 90%
Photon index: 1.62959     ( -0.0647583   0.0650154 )
Norm@50keV  : 4.96319E-02    ( -0.00186147   0.00186076 )
------------------------------------------------------------
#Fit statistic : Chi-Squared =          74.91 using 59 PHA bins.
# Reduced chi-squared =          1.314 for     57 degrees of freedom
# Null hypothesis probability =   5.599662e-02

Photon flux (15-150 keV)    in 26.61 sec: 6.43801 ( -0.26319  0.264 ) ph/cm2/s
Energy fluence (15-150 keV)             : 1.2311e-05 ( -4.78309e-07  4.78796e-07 ) ergs/cm2
Cutoff power-law model

Time interval is from  -10.432 sec. to   16.176 sec.
Spectral model in the cutoff power-law:
------------------------------------------------------------
Parameters  : value       lower 90%   higher 90%
Photon index: 0.992416     ( -0.296062   0.277909 )
Epeak [keV] : 84.9884      ( -11.8793 25.2435 )
Norm@50keV  : 9.91097E-02    ( -0.0252581   0.0365017 )
------------------------------------------------------------
#Fit statistic : Chi-Squared =          58.41 using 59 PHA bins.
# Reduced chi-squared =          1.043 for     56 degrees of freedom
# Null hypothesis probability =   3.869927e-01

Photon flux (15-150 keV)    in 26.61 sec: 6.19589 ( -0.27966  0.28085 ) ph/cm2/s
Energy fluence (15-150 keV)             : 1.19145e-05 ( -5.13943e-07  5.12777e-07 ) ergs/cm2
Band function

Time interval is from  -10.432 sec. to   16.176 sec.


Spectral model in the Band function:
------------------------------------------------------------
Parameters  : value       lower 90%   higher 90%
alpha       :    (     )
beta        :     (     )
Epeak [keV] :       (   )
Norm@50keV   :     (     )
------------------------------------------------------------

Photon flux (15-150 keV)    in  sec:  (    ) ph/cm2/s
Energy fluence (15-150 keV)             : 0 ( 0  0 ) ergs/cm2
Single BB

Spectral model blackbody:
------------------------------------------------------------
Parameters  : value    Lower 90%  Upper 90%
kT [keV]    : 15.4671  (  )
R^2/D10^2   : 0.633978  (   )
(R is the radius in km and D10 is the distance to the source in units of 10 kpc)
------------------------------------------------------------
#Fit statistic : Chi-Squared =         178.12 using 59 PHA bins.
# Reduced chi-squared =         3.1249 for     57 degrees of freedom
# Null hypothesis probability =   2.170501e-14

Energy  Fluence     90% Error
[keV]   [erg/cm2]   [erg/cm2]
15- 25  8.404e-07   6.293e-08
25- 50  3.433e-06   1.743e-07
50-150  5.664e-06   3.792e-07
15-150  9.937e-06   4.351e-07
Thermal bremsstrahlung (OTTB)
Spectral model: thermal bremsstrahlung
------------------------------------------------------------
Parameters  : value         Lower 90%    Upper 90%
kT [keV]    : 169.901       (-27.5827      -169.901)
Norm        : 26.3076       (-1.16232     1.24425)
------------------------------------------------------------
#Fit statistic : Chi-Squared =          61.09 using 59 PHA bins.
# Reduced chi-squared =          1.072 for     57 degrees of freedom
# Null hypothesis probability =   3.312694e-01

Energy  Fluence     90% Error
[keV]   [erg/cm2]   [erg/cm2]
15- 25  1.777e-06   1.168e-07
25- 50  3.350e-06   2.555e-07
50-150  6.946e-06   1.748e-06
15-150  1.207e-05   1.952e-06
Double BB
Spectral model: bbodyrad<1> + bbodyrad<2>
------------------------------------------------------------
Parameters  : value         Lower 90%    Upper 90%
kT1 [keV]   : 7.49371        (-1.12974      1.23254)
R1^2/D10^2  : 4.95772        (-1.88119      3.62809)
kT2 [keV]   : 24.2201        (-2.7964      4.07309)
R2^2/D10^2  : 9.58168E-02    (-0.044501   0.0626539)
------------------------------------------------------------
#Fit statistic : Chi-Squared =          60.85 using 59 PHA bins.
# Reduced chi-squared =          1.106 for     55 degrees of freedom
# Null hypothesis probability =   2.736144e-01

Energy  Fluence     90% Error
[keV]   [erg/cm2]   [erg/cm2]
15- 25  1.535e-06   2.370e-07
25- 50  3.453e-06   3.313e-07
50-150  6.854e-06   9.194e-07
15-150  1.184e-05   1.251e-06
Peak spectrum fit
Power-law model
Time interval is from    0.596 sec. to    1.596 sec.

Spectral model in power-law:
------------------------------------------------------------
Parameters  : value       lower 90%   higher 90%
Photon index: 1.41128     ( -0.142398   0.144585 )
Norm@50keV  : 0.133474    ( -0.0123802   0.0123628 )
------------------------------------------------------------
#Fit statistic : Chi-Squared =          71.27 using 59 PHA bins.
# Reduced chi-squared =          1.250 for     57 degrees of freedom
# Null hypothesis probability =   9.679020e-02

Photon flux (15-150 keV)    in 1 sec: 0.329948 (    ) ph/cm2/s
Energy fluence (15-150 keV)             : 1.28695e-06 ( -1.29106e-07  1.29496e-07 ) ergs/cm2
Cutoff power-law model
Time interval is from    0.596 sec. to    1.596 sec.
Spectral model in the cutoff power-law:
------------------------------------------------------------
Parameters  : value       lower 90%   higher 90%
Photon index: 0.581363     ( -0.693857   0.599014 )
Epeak [keV] : 91.9278      ( -21.5056 95.2032 )
Norm@50keV  : 0.335973    ( -0.160584   0.37792 )
------------------------------------------------------------
#Fit statistic : Chi-Squared =          65.41 using 59 PHA bins.
# Reduced chi-squared =          1.168 for     56 degrees of freedom
# Null hypothesis probability =   1.824458e-01

Photon flux (15-150 keV)    in 1 sec: 16.0037 ( -1.549  1.5506 ) ph/cm2/s
Energy fluence (15-150 keV)             : 1.25849e-06 ( -1.36291e-07  1.3518e-07 ) ergs/cm2
Band function

Time interval is from    0.596 sec. to    1.596 sec.


Spectral model in the Band function:
------------------------------------------------------------
Parameters  : value       lower 90%   higher 90%
alpha       :    (     )
beta        :     (     )
Epeak [keV] :       (   )
Norm@50keV   :     (     )
------------------------------------------------------------

Photon flux (15-150 keV)    in  sec:  (    ) ph/cm2/s
Energy fluence (15-150 keV)             : 0 ( 0  0 ) ergs/cm2
Single BB

Spectral model blackbody:
------------------------------------------------------------
Parameters  : value    Lower 90%  Upper 90%
kT [keV]    : 16.4846  (-1.75801  1.96547)
R^2/D10^2   : 1.44527  (-0.4648   0.678162)
(R is the radius in km and D10 is the distance to the source in units of 10 kpc)
------------------------------------------------------------
#Fit statistic : Chi-Squared =          83.03 using 59 PHA bins.
# Reduced chi-squared =          1.457 for     57 degrees of freedom
# Null hypothesis probability =   1.381011e-02

Energy  Fluence     90% Error
[keV]   [erg/cm2]   [erg/cm2]
15- 25  8.063e-08   1.325e-08
25- 50  3.479e-07   4.365e-08
50-150  6.682e-07   1.174e-07
15-150  1.097e-06   1.322e-07
Thermal bremsstrahlung (OTTB)
Spectral model: thermal bremsstrahlung
------------------------------------------------------------
Parameters  : value         Lower 90%    Upper 90%
kT [keV]    : 200.000       (-37.64      -200)
Norm        : 67.9616       (-6.24081     6.24081)
------------------------------------------------------------
#Fit statistic : Chi-Squared =          70.96 using 59 PHA bins.
# Reduced chi-squared =          1.245 for     57 degrees of freedom
# Null hypothesis probability =   1.011595e-01

Energy  Fluence     90% Error
[keV]   [erg/cm2]   [erg/cm2]
15- 25  1.692e-07   2.045e-08
25- 50  3.255e-07   8.345e-08
50-150  7.139e-07   3.161e-07
15-150  1.209e-06   3.660e-07
Double BB

Spectral model: bbodyrad<1> + bbodyrad<2>
------------------------------------------------------------
Parameters  : value         Lower 90%    Upper 90%
kT1 [keV]   : 8.69855        (-2.69523      3.17274)
R1^2/D10^2  : 7.31415        (-4.1348      10.6601)
kT2 [keV]   : 27.4657        (-6.73449      19.6443)
R2^2/D10^2  : 0.178100    (-0.152428   0.210884)
------------------------------------------------------------
#Fit statistic : Chi-Squared =          64.38 using 59 PHA bins.
# Reduced chi-squared =          1.171 for     55 degrees of freedom
# Null hypothesis probability =   1.811690e-01

Energy  Fluence     90% Error
[keV]   [erg/cm2]   [erg/cm2]
15- 25  1.279e-07   5.535e-08
25- 50  3.445e-07   1.551e-07
50-150  7.947e-07   3.955e-07
15-150  1.267e-06   5.575e-07
Pre-slew spectrum (Pre-slew PHA with pre-slew DRM)
Power-law model

Spectral model in power-law:
------------------------------------------------------------
Parameters  : value       lower 90%   higher 90%
Photon index: 1.62959     ( -0.0647583   0.0650154 )
Norm@50keV  : 4.96319E-02    ( -0.00186147   0.00186076 )
------------------------------------------------------------
#Fit statistic : Chi-Squared =          74.91 using 59 PHA bins.
# Reduced chi-squared =          1.314 for     57 degrees of freedom
# Null hypothesis probability =   5.599662e-02

Photon flux (15-150 keV)    in 26.61 sec: 6.43778 ( -0.263161  0.26397 ) ph/cm2/s
Energy fluence (15-150 keV)             : 1.23091e-05 ( -4.78094e-07  4.79124e-07 ) ergs/cm2
Cutoff power-law model

Spectral model in the cutoff power-law:
------------------------------------------------------------
Parameters  : value       lower 90%   higher 90%
Photon index: 0.992417     ( -0.296062   0.277908 )
Epeak [keV] : 84.9884      ( -11.8793 25.2435 )
Norm@50keV  : 9.91096E-02    ( -0.025258   0.0365017 )
------------------------------------------------------------
#Fit statistic : Chi-Squared =          58.41 using 59 PHA bins.
# Reduced chi-squared =          1.043 for     56 degrees of freedom
# Null hypothesis probability =   3.869927e-01

Photon flux (15-150 keV)    in 26.61 sec: 6.19514 ( -0.27956  0.28073 ) ph/cm2/s
Energy fluence (15-150 keV)             : 1.19188e-05 ( -5.15223e-07  5.13014e-07 ) ergs/cm2
Band function

Spectral model in the Band function:
------------------------------------------------------------
Parameters  : value       lower 90%   higher 90%
alpha       :    (     )
beta        :     (     )
Epeak [keV] :       (   )
Norm@50keV   :     (     )
------------------------------------------------------------

Photon flux (15-150 keV)    in  sec:  (    ) ph/cm2/s
Energy fluence (15-150 keV)             : 0 ( 0  0 ) ergs/cm2
S(25-50 keV) vs. S(50-100 keV) plot

S(25-50 keV)  = 3.25e-06
S(50-100 keV) = 4.18e-06
T90 vs. Hardness ratio plot
T90                                   = 19.5199999809265 sec.
Hardness ratio (energy fluence ratio) = 1.28615
Color vs. Color plot
Count Ratio  (25-50 keV) / (15-25 keV) = 1.5564
Count Ratio (50-100 keV) / (15-25 keV) = 1.25337
Mask shadow pattern

IMX = -9.149408666892626E-01, IMY = -6.700877383759765E-01
TIME vs. PHA plot around the trigger time
TIME vs. DetID plot around the trigger time

100 us light curve (15-350 keV)
Spacecraft aspect plot
Bright source in the pre-burst/pre-slew/post-slew images
Pre-burst image of 15-350 keV band
Time interval of the image:
-239.376000 -10.432000

# RAcent  DECcent POSerr Theta    Phi  PeakCts   SNR AngSep     Name
#  [deg]    [deg]    ['] [deg]  [deg]                   [']
244.9688 -15.6495    0.4  17.7  -93.9   8.3201  27.4    0.8	Sco X-1
254.4111  35.3644    4.8  53.2 -172.5   1.8549   2.4    2.6	Her X-1
255.9537 -37.9719   62.5  37.0  -59.0  -0.0842  -0.2    7.8	4U 1700-377
256.4864 -36.2966   13.6  36.3  -61.7   0.4157   0.8    8.0	GX 349+2
263.0381 -24.7972    4.9  36.4  -83.4   1.3836   2.4    3.5	GX 1+4
264.7427 -44.4464   56.9  46.1  -57.1   0.2305   0.2    0.2	4U 1735-44
268.2151  -1.5209    0.0  41.7 -120.7  -0.4356  -0.6   10.0	SW J1753.5-0127
263.0922 -33.8895   10.7  39.7  -69.6   0.7715   1.1    6.1	GX 354-0
247.8508 -47.8162    1.7  40.4  -41.4   2.8313   6.7 ------	UNKNOWN
Pre-slew background subtracted image of 15-350 keV band
Time interval of the image:
-10.432000 16.176000

# RAcent  DECcent POSerr Theta    Phi  PeakCts   SNR AngSep     Name
#  [deg]    [deg]    ['] [deg]  [deg]                   [']
244.7946 -15.7181   14.8  17.6  -93.6   0.0791   0.8   11.7	Sco X-1
254.3396  35.3187    8.1  53.2 -172.5  -0.5898  -1.4    6.0	Her X-1
255.8090 -37.8169   29.1  36.8  -59.1  -0.0574  -0.4    8.6	4U 1700-377
256.2443 -36.5028   59.6  36.3  -61.2   0.0279   0.2   10.4	GX 349+2
263.0836 -24.8760    4.7  36.5  -83.3  -0.4382  -2.4    8.8	GX 1+4
264.8413 -44.4441    9.3  46.2  -57.2  -0.4224  -1.2    4.2	4U 1735-44
268.3645  -1.3746    5.8  41.9 -120.8  -0.4476  -2.0    4.7	SW J1753.5-0127
262.8331 -33.7540    3.0  39.4  -69.6   0.8569   3.8    9.2	GX 354-0
212.5609  35.2539    0.6  48.6  143.8  19.0855  19.9 ------	UNKNOWN
232.6764   8.8602    2.5  20.8  174.9   0.4841   4.6 ------	UNKNOWN
251.4604  37.0044    2.9  53.4 -176.1   1.9245   4.0 ------	UNKNOWN
228.0262 -44.5381    2.4  33.3  -21.0   0.5227   4.9 ------	UNKNOWN
268.2604   3.8103    2.4  43.4 -128.1   0.9440   4.9 ------	UNKNOWN
Post-slew image of 15-350 keV band
Time interval of the image:
82.124600 879.924600

# RAcent  DECcent POSerr Theta    Phi  PeakCts   SNR AngSep     Name
#  [deg]    [deg]    ['] [deg]  [deg]                   [']
254.5101  35.3745    2.5  34.0 -131.4   4.0061   4.7    3.2	Her X-1
181.4229  48.3333    3.4  26.4  100.6   3.1227   3.4 ------	UNKNOWN
295.3801  63.7254    2.4  55.8 -176.6  11.0465   4.8 ------	UNKNOWN
272.0972  41.4374    2.9  46.2 -145.1   5.3102   3.9 ------	UNKNOWN
Plot creation:
Thu Mar 21 14:35:14 EDT 2019