Estimated redshift from machine learning (Ukwatta et al. 2016) - may take a few minute to calcaulte
Image
Pre-slew 15.0-350.0 keV image (Event data)

#   RAcent    DECcent   POSerr    Theta     Phi              Peak Cts       SNR   Name
   29.8783    23.8396   0.0047    33.5753  -149.6076         2.7932499     41.286 TRIG_00882252

Foreground time interval of the image:
 -0.124  11.885 (delta_t =  12.009 [sec])
Background time interval of the image:
-572.715 -554.030 (delta_t =  18.686 [sec])
-239.816  -0.124 (delta_t = 239.692 [sec])
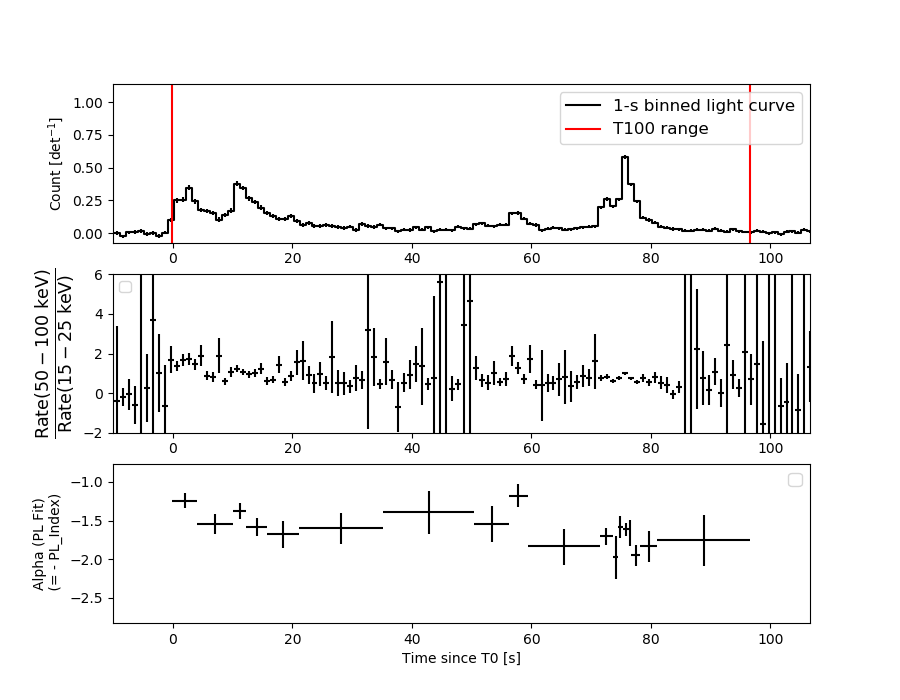
Lightcurves
Notes:
- 1) The mask-weighted light curves are using the flight position.
- 2) Multiple plots of different time binning/intervals are shown to cover all scenarios of short/long GRBs, rate/image triggers, and real/false positives.
- 3) For all the mask-weighted lightcurves, the y-axis units are counts/sec/det where a det is 0.4 x 0.4 = 0.16 sq cm.
- 4) The verticle lines correspond to following: green dotted lines are T50 interval, black dotted lines are T90 interval, blue solid line(s) is a spacecraft slew start time, and orange solid line(s) is a spacecraft slew end time.
- 5) Time of each bin is in the middle of the bin.
1 s binning
From T0-310 s to T0+310 s

From T100_start - 20 s to T100_end + 30 s

Full time interval

64 ms binning
Full time interval
From T100_start to T100_end

From T0-5 sec to T0+5 sec
16 ms binning
From T100_start-5 s to T100_start+5 s

8 ms binning
From T100_start-3 s to T100_start+3 s
2 ms binning
From T100_start-1 s to T100_start+1 s

SN=5 or 10 sec. binning (whichever binning is satisfied first)

SN=5 or 10 sec. binning (T < 200 sec)
Quad-rate summed light curves (from T0-300s to T0+1000s)

Spectral Evolution
Spectra
Notes:
- 1) The fitting includes the systematic errors.
- 2) When the burst includes telescope slew time periods, the fitting uses an average response file made from multiple 5-s response files through out the slew time plus single time preiod for the non-slew times, and weighted by the total counts in the corresponding time period using addrmf. An average response file is needed becuase a spectral fit using the pre-slew DRM will introduce some errors in both a spectral shape and a normalization if the PHA file contains a lot of the slew/post-slew time interval.
- 3) For fits to more complicated models (e.g. a power-law over a cutoff power-law), the BAT team has decided to require a chi-square improvement of more than 6 for each extra dof.
Time averaged spectrum fit using the average DRM
Power-law model
Time interval is from   -0.124 sec. to   96.616 sec.

Spectral model in power-law:
------------------------------------------------------------
Parameters  : value       lower 90%   higher 90%
Photon index: 1.58844     ( -0.0516712   0.0517753 )
Norm@50keV  : 6.47202E-03    ( -0.000173924   0.000173877 )
------------------------------------------------------------
#Fit statistic : Chi-Squared =          41.20 using 59 PHA bins.
# Reduced chi-squared =         0.7229 for     57 degrees of freedom
# Null hypothesis probability =   9.429108e-01

Photon flux (15-150 keV)    in 96.74 sec: 0.828762 ( -0.024651  0.024735 ) ph/cm2/s
Energy fluence (15-150 keV)             : 5.86457e-06 ( -1.65606e-07  1.65966e-07 ) ergs/cm2
Cutoff power-law model

Time interval is from   -0.124 sec. to   96.616 sec.
Spectral model in the cutoff power-law:
------------------------------------------------------------
Parameters  : value       lower 90%   higher 90%
Photon index: 1.36822     ( -0.210106   0.200549 )
Epeak [keV] : 154.628      ( -50.0653 738.298 )
Norm@50keV  : 8.18970E-03    ( -0.00154095   0.00200013 )
------------------------------------------------------------
#Fit statistic : Chi-Squared =          37.68 using 59 PHA bins.
# Reduced chi-squared =         0.6728 for     56 degrees of freedom
# Null hypothesis probability =   9.714335e-01

Photon flux (15-150 keV)    in 96.74 sec: 0.814324 ( -0.027627  0.027746 ) ph/cm2/s
Energy fluence (15-150 keV)             : 4.00365e-06 ( -2.40116e-07  2.08519e-07 ) ergs/cm2
Band function

Time interval is from   -0.124 sec. to   96.616 sec.


Spectral model in the Band function:
------------------------------------------------------------
Parameters  : value       lower 90%   higher 90%
alpha       :    (     )
beta        :     (     )
Epeak [keV] :       (   )
Norm@50keV   :     (     )
------------------------------------------------------------

Photon flux (15-150 keV)    in  sec:  (    ) ph/cm2/s
Energy fluence (15-150 keV)             : 0 ( 0  0 ) ergs/cm2
Single BB
Spectral model blackbody:
------------------------------------------------------------
Parameters  : value    Lower 90%  Upper 90%
kT [keV]    : 15.8952  (  )
R^2/D10^2   : 7.17627E-02  (   )
(R is the radius in km and D10 is the distance to the source in units of 10 kpc)
------------------------------------------------------------
#Fit statistic : Chi-Squared =         321.23 using 59 PHA bins.
# Reduced chi-squared =         5.6357 for     57 degrees of freedom
# Null hypothesis probability =   1.685011e-38

Energy  Fluence     90% Error
[keV]   [erg/cm2]   [erg/cm2]
15- 25  3.632e-07   1.944e-08
25- 50  1.520e-06   5.708e-08
50-150  2.677e-06   1.369e-07
15-150  4.560e-06   1.301e-07
Thermal bremsstrahlung (OTTB)

Spectral model: thermal bremsstrahlung
------------------------------------------------------------
Parameters  : value         Lower 90%    Upper 90%
kT [keV]    : 200.000       (-28.0712      -200)
Norm        : 3.32453       (-0.0888785     0.0888785)
------------------------------------------------------------
#Fit statistic : Chi-Squared =          38.50 using 59 PHA bins.
# Reduced chi-squared =         0.6755 for     57 degrees of freedom
# Null hypothesis probability =   9.714037e-01

Energy  Fluence     90% Error
[keV]   [erg/cm2]   [erg/cm2]
15- 25  8.012e-07   2.399e-08
25- 50  1.541e-06   4.547e-08
50-150  3.378e-06   9.771e-08
15-150  5.720e-06   1.751e-07
Double BB

Spectral model: bbodyrad<1> + bbodyrad<2>
------------------------------------------------------------
Parameters  : value         Lower 90%    Upper 90%
kT1 [keV]   : 6.75736        (-0.714956      0.787472)
R1^2/D10^2  : 0.955867        (-0.306586      0.497602)
kT2 [keV]   : 25.2621        (-2.11978      2.71608)
R2^2/D10^2  : 1.13913E-02    (-0.00358001   0.00445603)
------------------------------------------------------------
#Fit statistic : Chi-Squared =          43.46 using 59 PHA bins.
# Reduced chi-squared =         0.7901 for     55 degrees of freedom
# Null hypothesis probability =   8.695029e-01

Energy  Fluence     90% Error
[keV]   [erg/cm2]   [erg/cm2]
15- 25  7.745e-07   8.455e-08
25- 50  1.527e-06   8.755e-08
50-150  3.395e-06   2.380e-07
15-150  5.697e-06   3.483e-07
Peak spectrum fit
Power-law model

Time interval is from   75.276 sec. to   76.276 sec.

Spectral model in power-law:
------------------------------------------------------------
Parameters  : value       lower 90%   higher 90%
Photon index: 1.60516     ( -0.0812595   0.0820543 )
Norm@50keV  : 3.79181E-02    ( -0.00191809   0.00191124 )
------------------------------------------------------------
#Fit statistic : Chi-Squared =          72.56 using 59 PHA bins.
# Reduced chi-squared =          1.273 for     57 degrees of freedom
# Null hypothesis probability =   8.025763e-02

Photon flux (15-150 keV)    in 1 sec: 4.88064 ( -0.24029  0.24046 ) ph/cm2/s
Energy fluence (15-150 keV)             : 3.54446e-07 ( -1.91642e-08  1.92513e-08 ) ergs/cm2
Cutoff power-law model

Time interval is from   75.276 sec. to   76.276 sec.
Spectral model in the cutoff power-law:
------------------------------------------------------------
Parameters  : value       lower 90%   higher 90%
Photon index: 0.892926     ( -0.389094   0.35556 )
Epeak [keV] : 74.7712      ( -11.8985 28.2012 )
Norm@50keV  : 8.92257E-02    ( -0.0304938   0.0523995 )
------------------------------------------------------------
#Fit statistic : Chi-Squared =          59.88 using 59 PHA bins.
# Reduced chi-squared =          1.069 for     56 degrees of freedom
# Null hypothesis probability =   3.369476e-01

Photon flux (15-150 keV)    in 1 sec: 4.74436 ( -0.24939  0.24935 ) ph/cm2/s
Energy fluence (15-150 keV)             : 3.35885e-07 ( -2.13782e-08  2.14043e-08 ) ergs/cm2
Band function

Time interval is from   75.276 sec. to   76.276 sec.


Spectral model in the Band function:
------------------------------------------------------------
Parameters  : value       lower 90%   higher 90%
alpha       :    (     )
beta        :     (     )
Epeak [keV] :       (   )
Norm@50keV   :     (     )
------------------------------------------------------------

Photon flux (15-150 keV)    in  sec:  (    ) ph/cm2/s
Energy fluence (15-150 keV)             : 0 ( 0  0 ) ergs/cm2
Single BB
Spectral model blackbody:
------------------------------------------------------------
Parameters  : value    Lower 90%  Upper 90%
kT [keV]    : 13.4071  (  )
R^2/D10^2   : 0.821321  (   )
(R is the radius in km and D10 is the distance to the source in units of 10 kpc)
------------------------------------------------------------
#Fit statistic : Chi-Squared =         124.79 using 59 PHA bins.
# Reduced chi-squared =         2.1893 for     57 degrees of freedom
# Null hypothesis probability =   5.670674e-07

Energy  Fluence     90% Error
[keV]   [erg/cm2]   [erg/cm2]
15- 25  3.128e-08   2.575e-09
25- 50  1.113e-07   5.750e-09
50-150  1.288e-07   1.220e-08
15-150  2.714e-07   1.580e-08
Thermal bremsstrahlung (OTTB)
Spectral model: thermal bremsstrahlung
------------------------------------------------------------
Parameters  : value         Lower 90%    Upper 90%
kT [keV]    : 161.683       (-33.3307      -161.695)
Norm        : 20.1903       (-1.09054     1.17)
------------------------------------------------------------
#Fit statistic : Chi-Squared =          62.73 using 59 PHA bins.
# Reduced chi-squared =          1.100 for     57 degrees of freedom
# Null hypothesis probability =   2.804552e-01

Energy  Fluence     90% Error
[keV]   [erg/cm2]   [erg/cm2]
15- 25  5.150e-08   3.705e-09
25- 50  9.648e-08   1.014e-08
50-150  1.963e-07   6.267e-08
15-150  3.442e-07   7.095e-08
Double BB

Spectral model: bbodyrad<1> + bbodyrad<2>
------------------------------------------------------------
Parameters  : value         Lower 90%    Upper 90%
kT1 [keV]   : 8.56957        (-1.42074      1.35746)
R1^2/D10^2  : 2.81230        (-0.9584      1.89447)
kT2 [keV]   : 28.3580        (-6.36089      12.7457)
R2^2/D10^2  : 3.64541E-02    (-0.0263269   0.0356712)
------------------------------------------------------------
#Fit statistic : Chi-Squared =          57.98 using 59 PHA bins.
# Reduced chi-squared =          1.054 for     55 degrees of freedom
# Null hypothesis probability =   3.659068e-01

Energy  Fluence     90% Error
[keV]   [erg/cm2]   [erg/cm2]
15- 25  4.386e-08   6.225e-09
25- 50  1.055e-07   1.552e-08
50-150  1.908e-07   7.813e-08
15-150  3.401e-07   8.735e-08
Pre-slew spectrum (Pre-slew PHA with pre-slew DRM)
Power-law model

Spectral model in power-law:
------------------------------------------------------------
Parameters  : value       lower 90%   higher 90%
Photon index: 1.36898     ( -0.0722635   0.0721771 )
Norm@50keV  : 1.56359E-02    ( -0.000611321   0.000611317 )
------------------------------------------------------------
#Fit statistic : Chi-Squared =          31.34 using 59 PHA bins.
# Reduced chi-squared =         0.5499 for     57 degrees of freedom
# Null hypothesis probability =   9.977353e-01

Photon flux (15-150 keV)    in 12.01 sec: 1.89119 ( -0.0791204  0.0793887 ) ph/cm2/s
Energy fluence (15-150 keV)             : 1.82641e-06 ( -7.70697e-08  7.73545e-08 ) ergs/cm2
Cutoff power-law model

Spectral model in the cutoff power-law:
------------------------------------------------------------
Parameters  : value       lower 90%   higher 90%
Photon index: 1.23766     ( -0.286252   0.165595 )
Epeak [keV] : 322.638      ( -322.527 -322.527 )
Norm@50keV  : 1.79573E-02    ( -0.00278935   0.0061068 )
------------------------------------------------------------
#Fit statistic : Chi-Squared =          30.67 using 59 PHA bins.
# Reduced chi-squared =         0.5476 for     56 degrees of freedom
# Null hypothesis probability =   9.976756e-01

Photon flux (15-150 keV)    in 12.01 sec: 1.87593 ( -0.08458  0.07867 ) ph/cm2/s
Energy fluence (15-150 keV)             : 1.81351e-06 ( -8.26408e-08  4.15066e-08 ) ergs/cm2
Band function

Spectral model in the Band function:
------------------------------------------------------------
Parameters  : value       lower 90%   higher 90%
alpha       :    (     )
beta        :     (     )
Epeak [keV] :       (   )
Norm@50keV   :     (     )
------------------------------------------------------------

Photon flux (15-150 keV)    in  sec:  (    ) ph/cm2/s
Energy fluence (15-150 keV)             : 0 ( 0  0 ) ergs/cm2
S(25-50 keV) vs. S(50-100 keV) plot

S(25-50 keV)  = 1.51e-06
S(50-100 keV) = 2.01e-06
T90 vs. Hardness ratio plot

T90                                   = 78.095999956131 sec.
Hardness ratio (energy fluence ratio) = 1.33113
Color vs. Color plot

Count Ratio  (25-50 keV) / (15-25 keV) = 1.2789
Count Ratio (50-100 keV) / (15-25 keV) = 0.945637
Mask shadow pattern

IMX = -5.725623150005047E-01, IMY = 3.358176116065797E-01
TIME vs. PHA plot around the trigger time

TIME vs. DetID plot around the trigger time
100 us light curve (15-350 keV)

Spacecraft aspect plot

Bright source in the pre-burst/pre-slew/post-slew images
Pre-burst image of 15-350 keV band
Time interval of the image:
-572.715410 -554.029900
-239.816000 -0.124000

# RAcent  DECcent POSerr Theta    Phi  PeakCts   SNR AngSep     Name
#  [deg]    [deg]    ['] [deg]  [deg]                   [']
 83.6476  22.0126    0.7  33.2  111.9   9.3900  15.6    0.8	Crab
 40.8992  61.4309    0.6  16.3  -53.9   5.8787  19.4 ------	UNKNOWN
Pre-slew background subtracted image of 15-350 keV band
Time interval of the image:
-0.124000 11.884600

# RAcent  DECcent POSerr Theta    Phi  PeakCts   SNR AngSep     Name
#  [deg]    [deg]    ['] [deg]  [deg]                   [']
 83.5102  21.9351    7.4  33.2  112.1  -0.1738  -1.6    8.3	Crab
 90.6392  18.2681    3.1  39.8  105.8   0.7299   3.7 ------	UNKNOWN
 29.8783  23.8396    0.3  33.6 -149.6   2.7932  41.3 ------	UNKNOWN
Post-slew image of 15-350 keV band
Time interval of the image:
70.484590 901.984600

# RAcent  DECcent POSerr Theta    Phi  PeakCts   SNR AngSep     Name
#  [deg]    [deg]    ['] [deg]  [deg]                   [']
 72.2663  44.2358    4.1  40.0   65.5   6.5769   2.8 ------	UNKNOWN
 40.9248  61.4357    0.7  38.3   25.2  17.4535  16.2 ------	UNKNOWN
 16.4508  59.1153    3.1  36.5    5.2   3.1101   3.7 ------	UNKNOWN
 16.4341  19.9694    2.2  13.1  -88.0   3.3134   5.2 ------	UNKNOWN
  2.6690  27.6441    2.8  24.7  -58.7   2.9084   4.0 ------	UNKNOWN
  8.1009 -22.5756    3.4  51.0 -137.1  12.8108   3.4 ------	UNKNOWN
Plot creation:
Thu Mar 21 14:33:48 EDT 2019